


Cintas Corporation-(CTAS/NASDAQ)-Short Idea
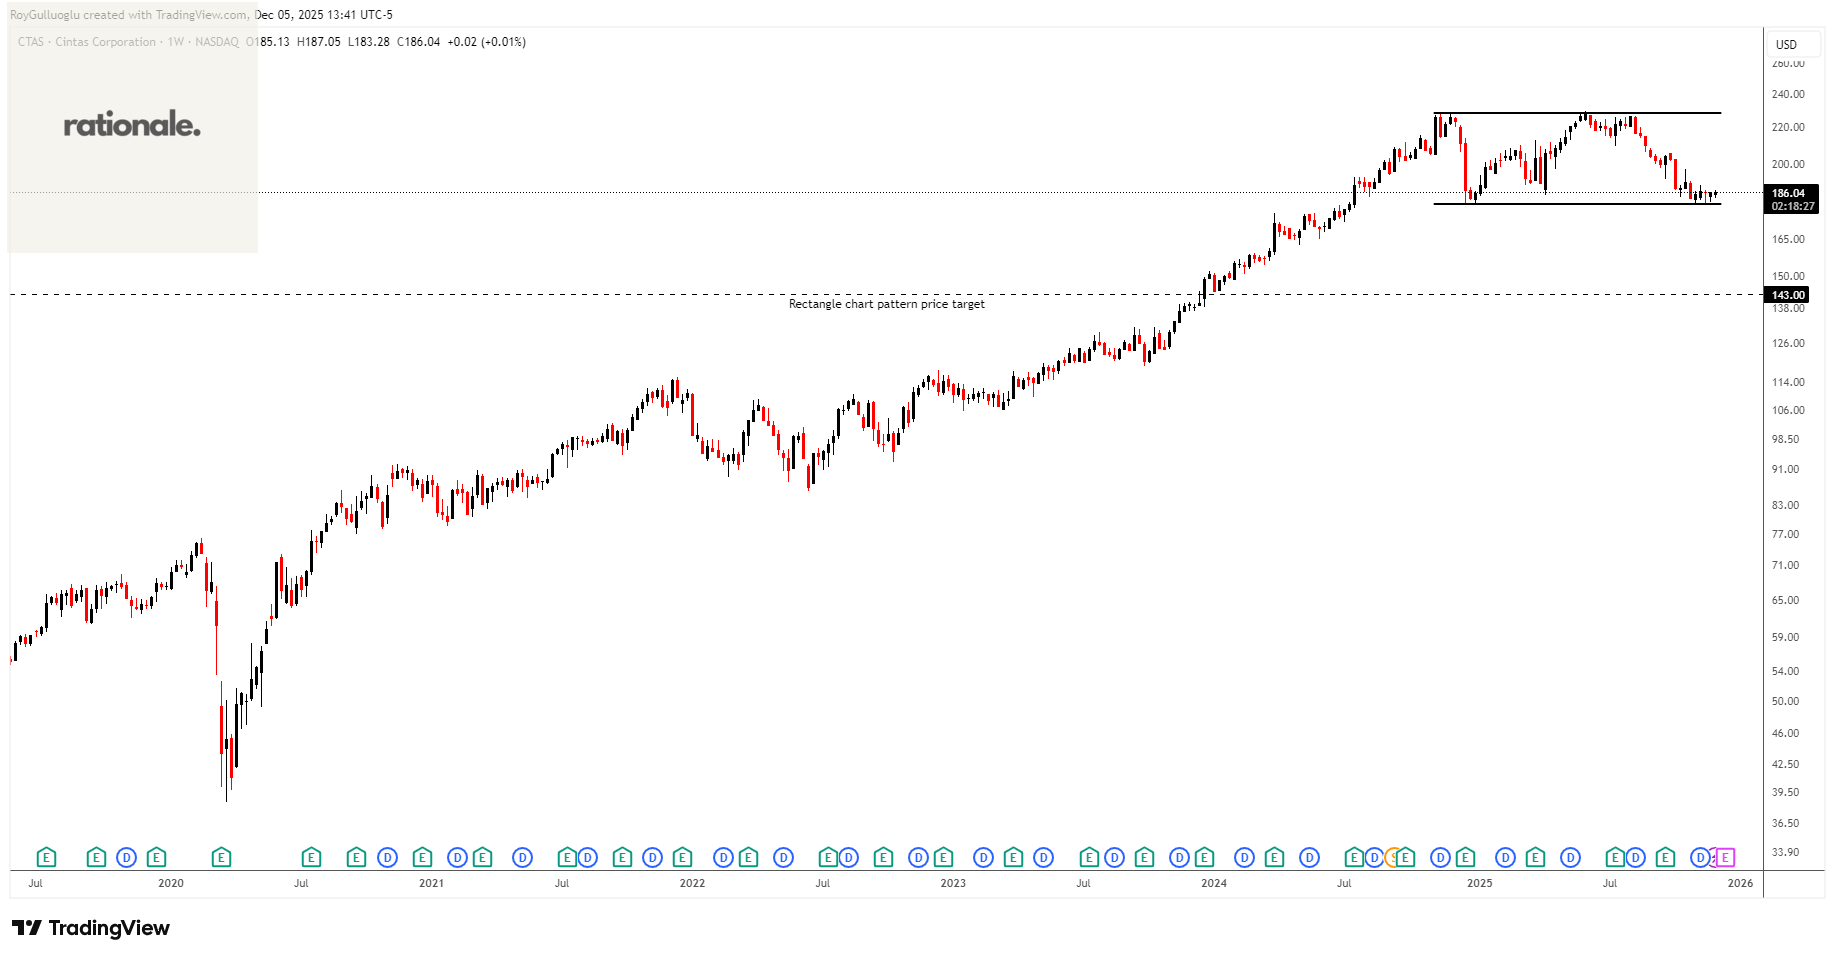
Cintas Corporation engages in the provision of corporate identity uniforms and related business services primarily in the United States, Canada, and Latin America.
The above weekly chart formed an approximately 13-month-long rectangle chart pattern as a bearish reversal after an uptrend.
The horizontal boundary at 180.53 levels acts as a support within this pattern.
A daily close below 175.12 levels would validate the breakdown from the 13-month-long rectangle chart pattern.
Based on this chart pattern, the potential price target is 143 levels.
APA Corporation-(APA/NASDAQ)-Long Idea
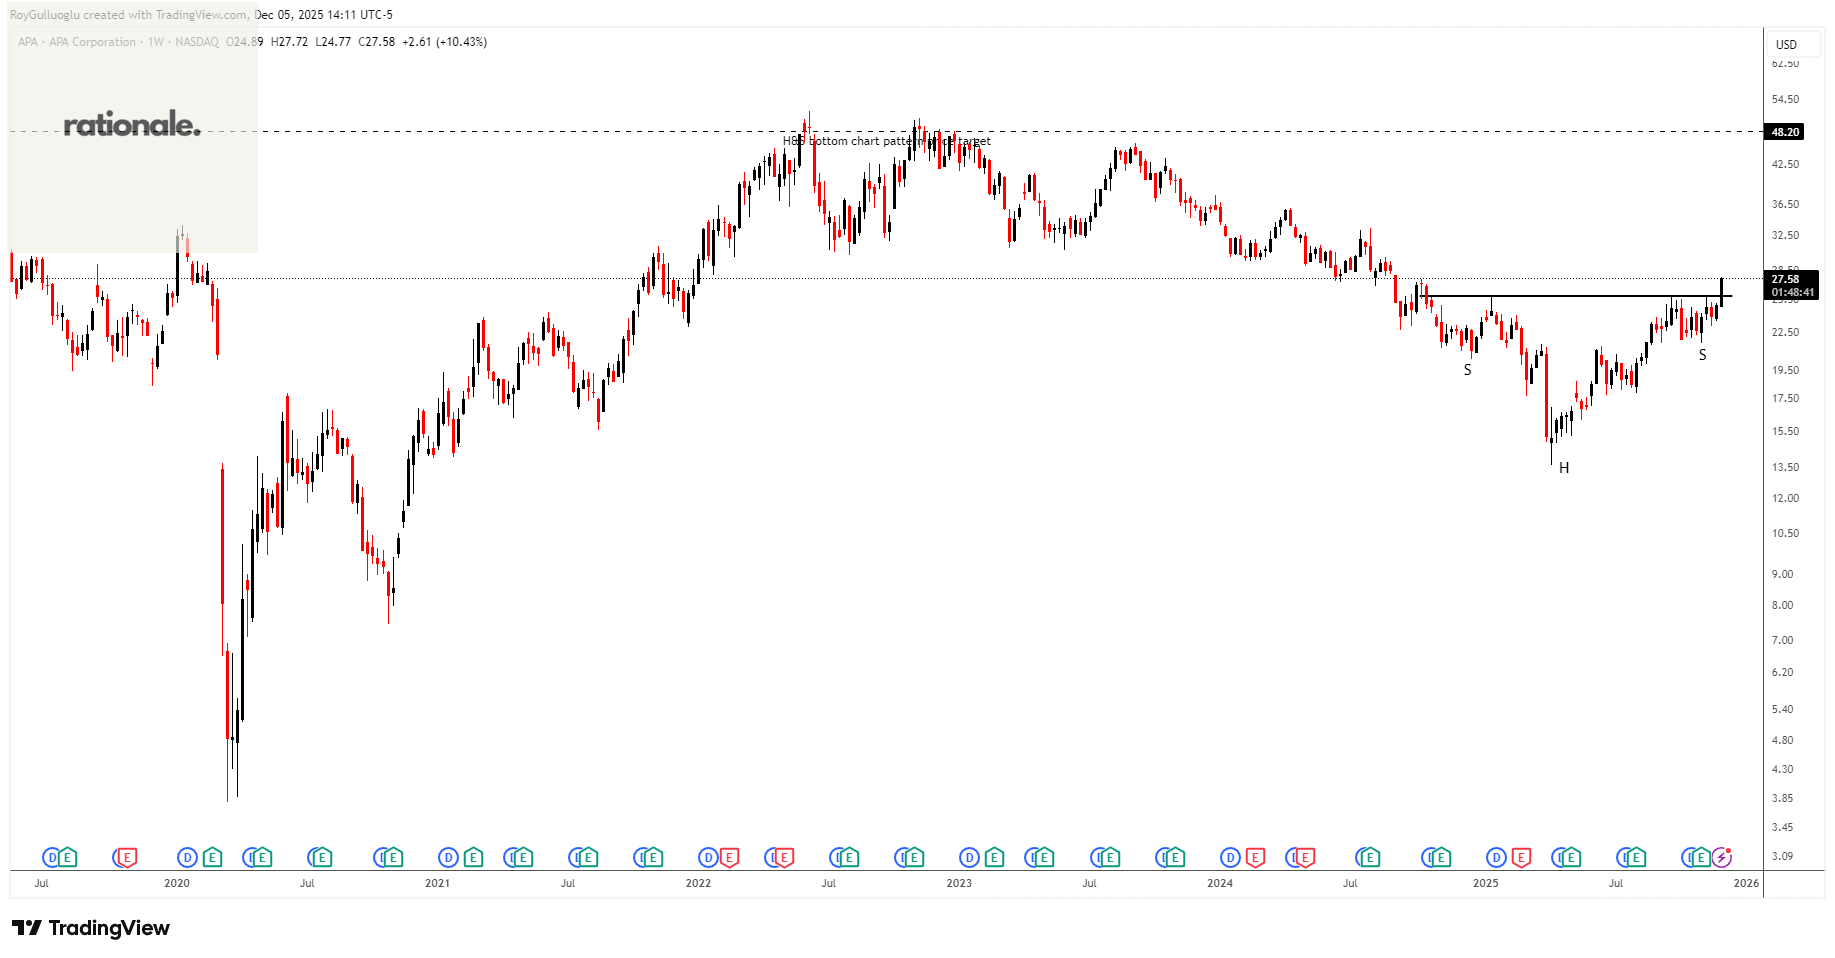
APA Corporation, an independent energy company, explores for, develops, and produces natural gas, crude oil, and natural gas liquids.
The above weekly chart formed an approximately 15-month-long H&S bottom chart pattern as a bullish reversal after a downtrend.
The horizontal boundary at 25.8 levels acted as a resistance within this pattern.
A daily close above 26.57 levels validated the breakout from the 15-month-long H&S bottom chart pattern.
Based on this chart pattern, the potential price target is 48.2 levels.
Talen Energy Corporation-(TLN/NASDAQ)-Short Idea
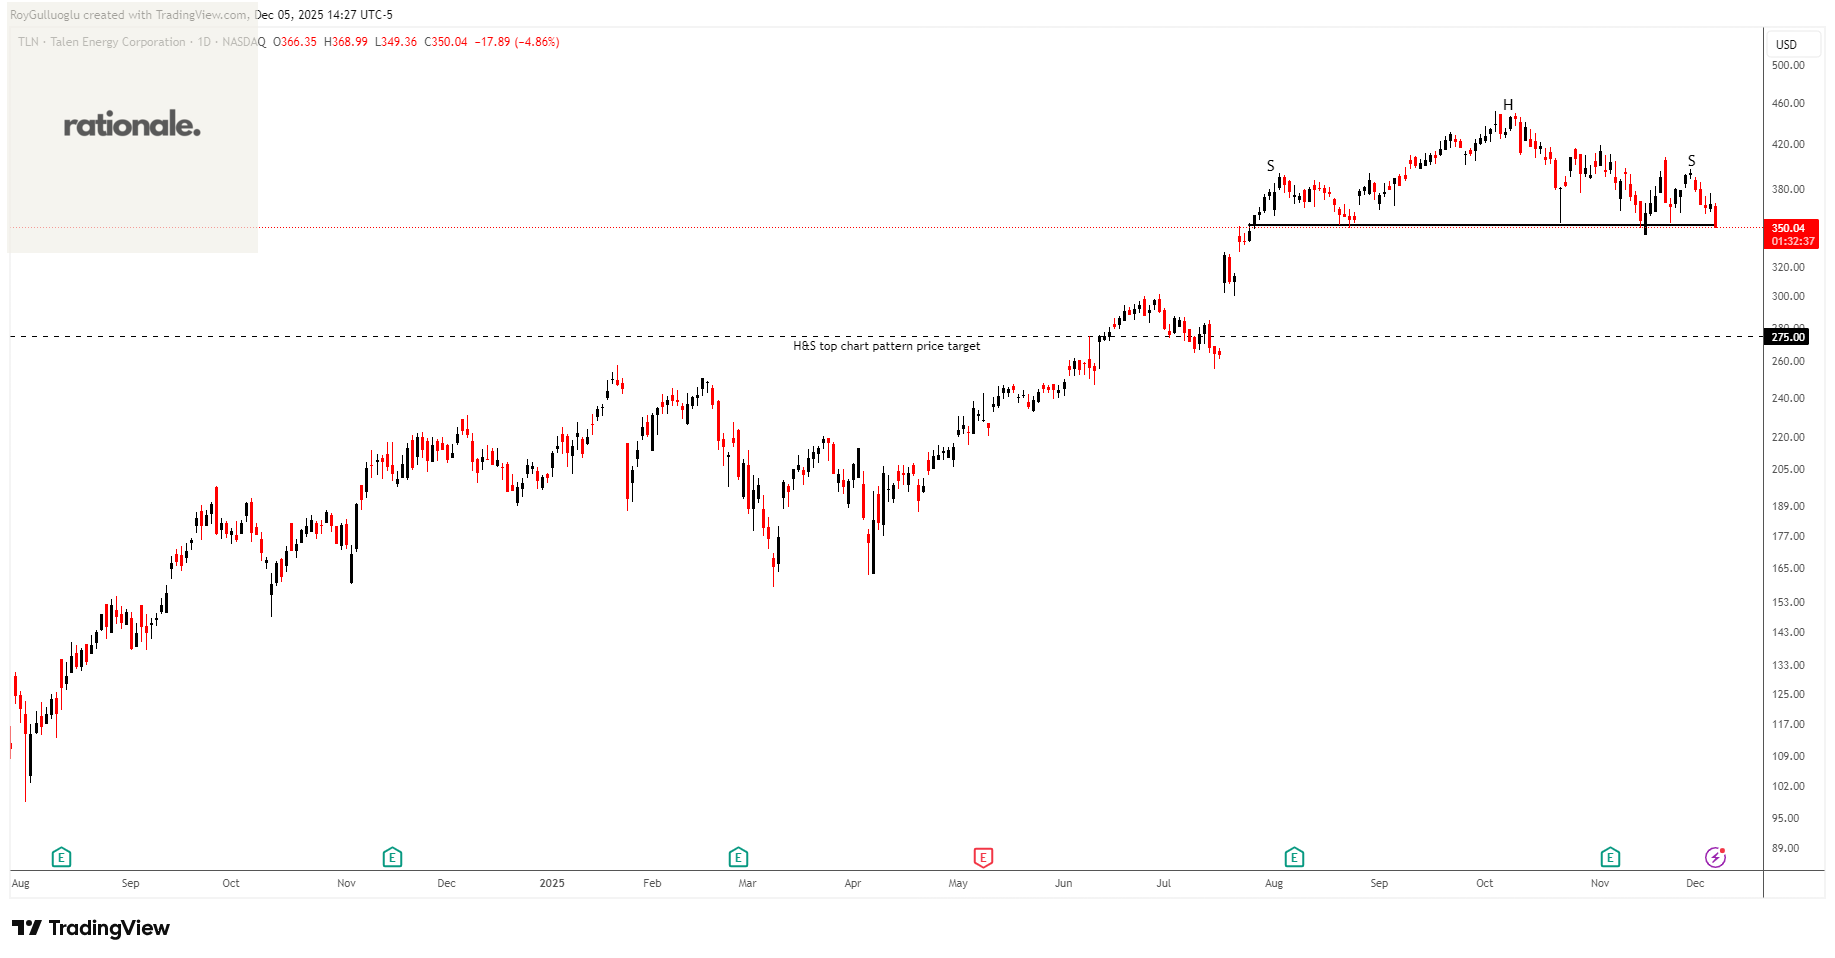
Talen Energy Corporation, an independent power producer and infrastructure company, produces and sells electricity, capacity, and ancillary services into wholesale power markets in the United States.
The above daily chart formed an approximately 3-month-long H&S top chart pattern as a bearish reversal after an uptrend.
The horizontal boundary at 351.46 levels acts as a support within this pattern.
A daily close below 340.9 levels would validate the breakout from the 3-month-long H&S top chart pattern.
Based on this chart pattern, the potential price target is 275 levels.
Waystar Holding Corp.-(WAY/NASDAQ)-Long Idea
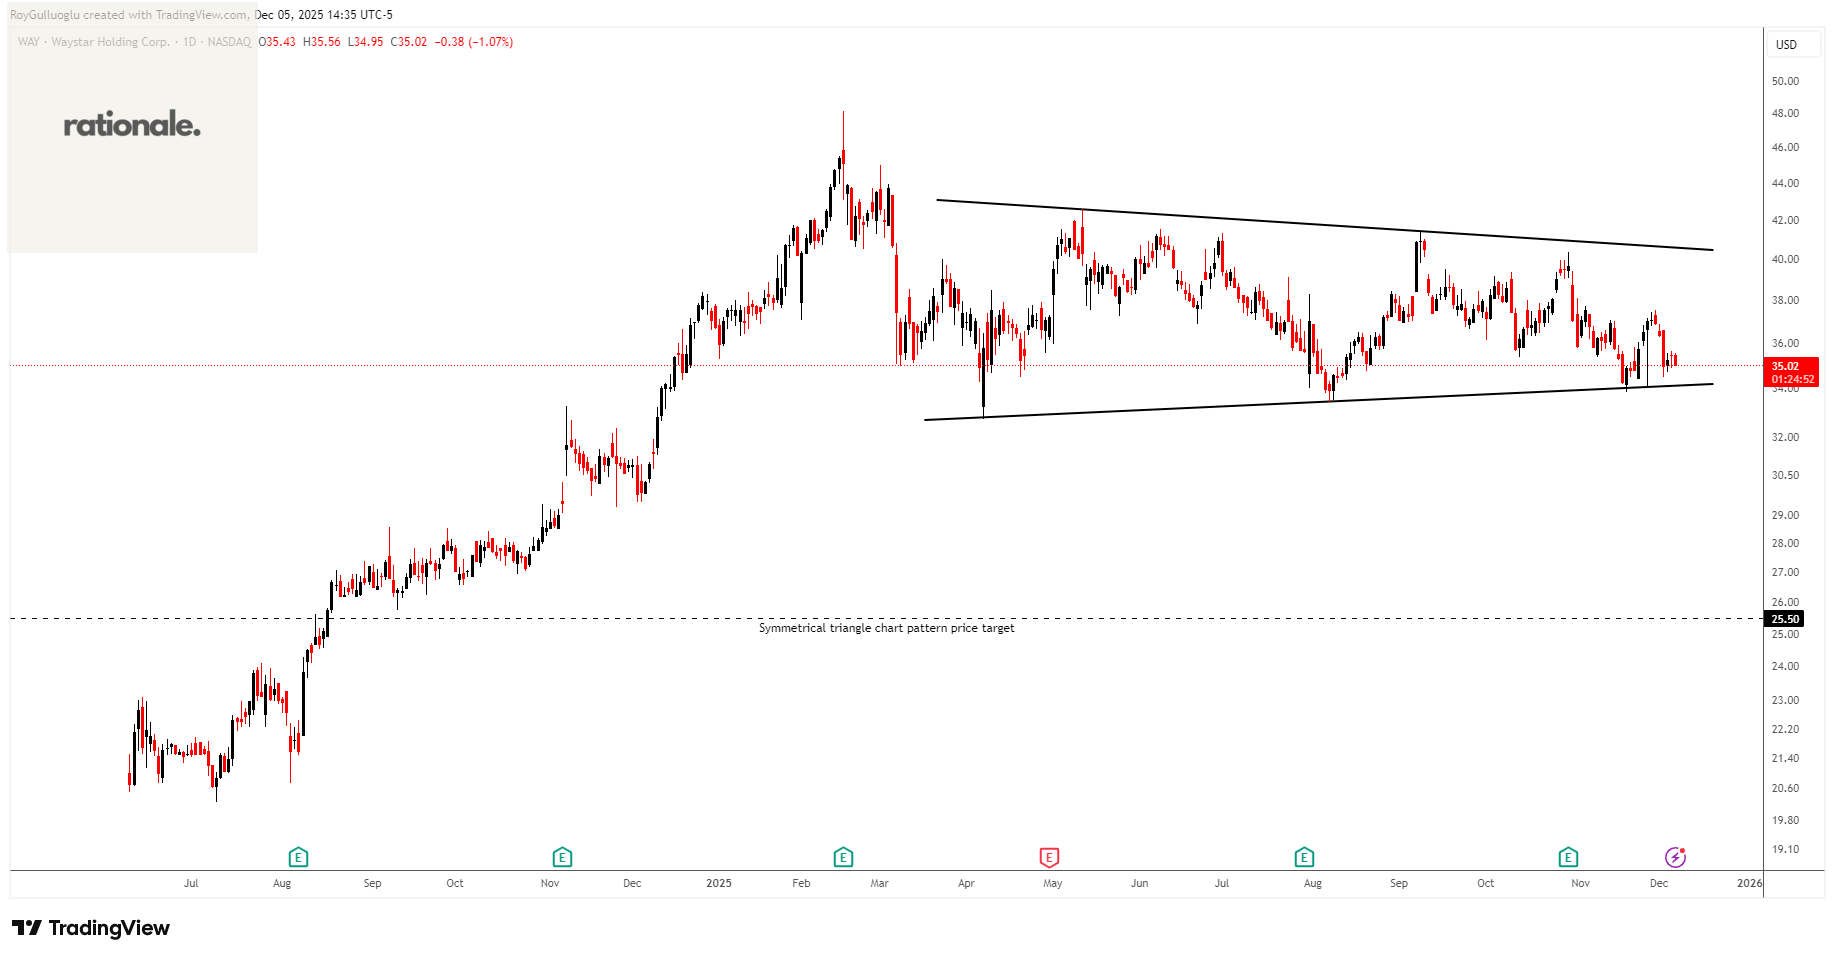
Waystar Holding Corp. develops a cloud-based software solution for healthcare payments.
The above daily chart formed an approximately 5-month-long symmetrical triangle chart pattern as a bearish reversal after an uptrend.
A daily close below 32.98 levels would validate the breakdown from the 5-month-long symmetrical triangle chart pattern.
Based on this chart pattern, the potential price target is 25.5 levels.
EQT Corporation-(EQT/NYSE)-Long Idea
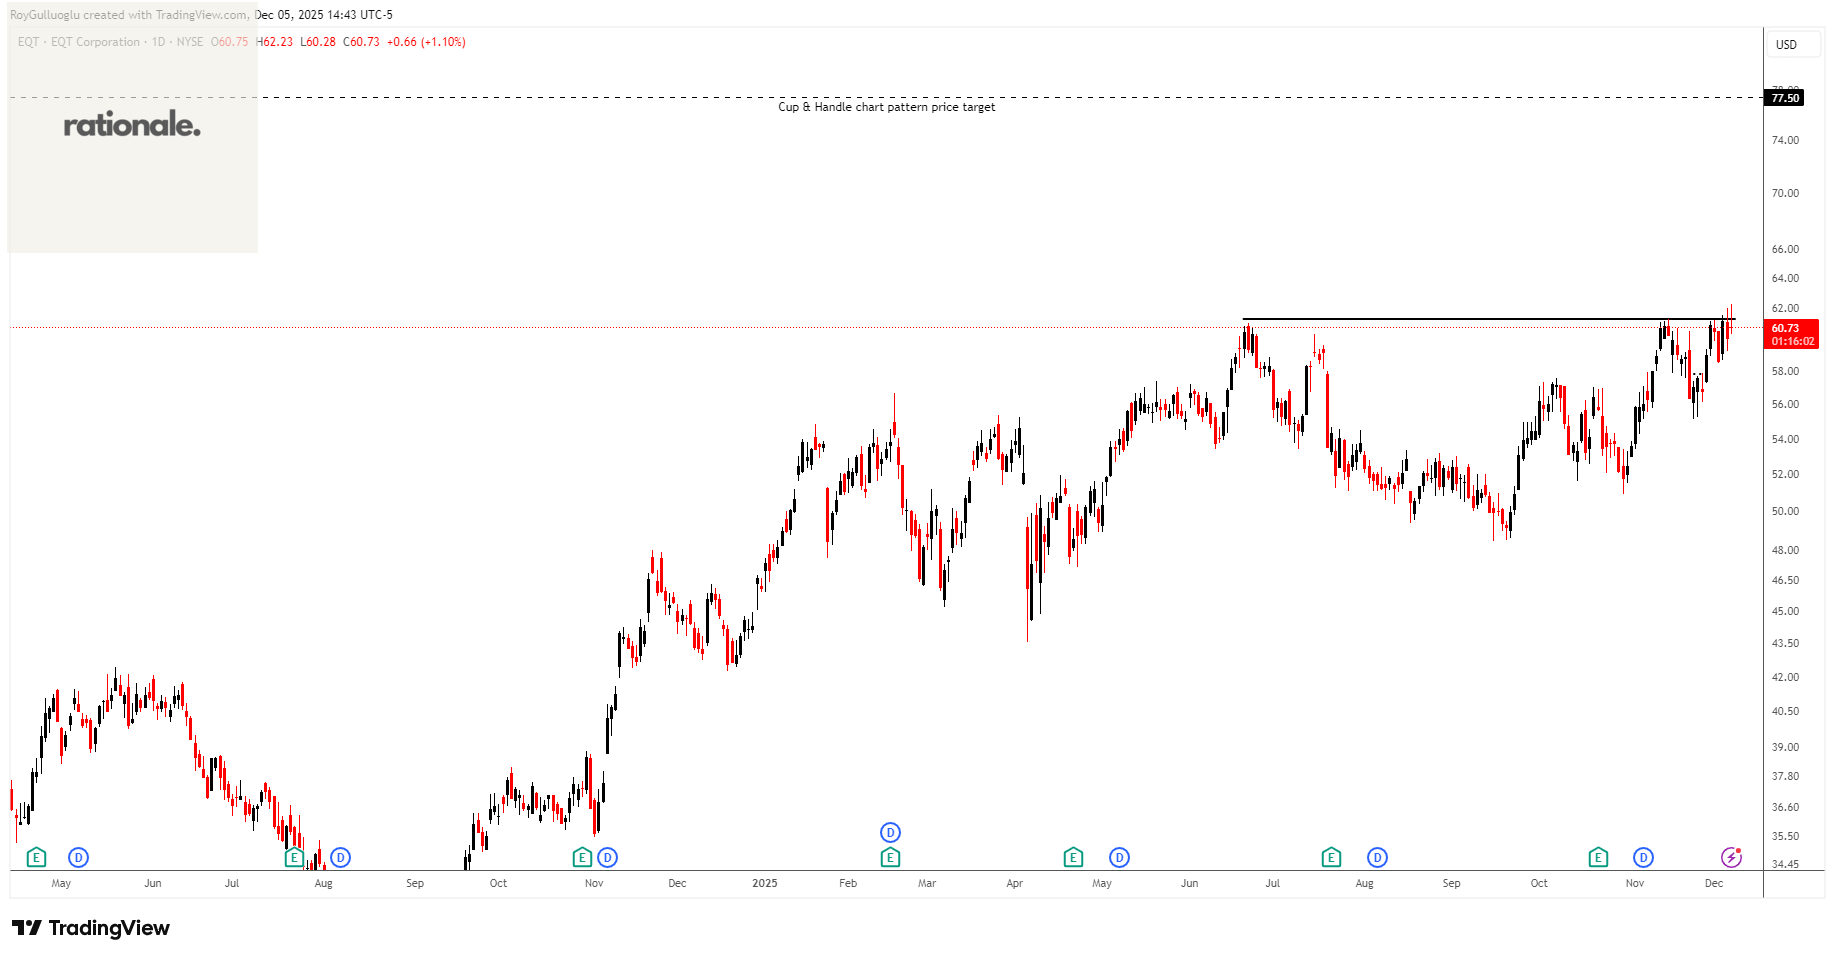
EQT Corporation engages in the production, gathering, and transmission of natural gas.
The above daily chart formed an approximately 4-month-long Cup & Handle continuation chart pattern as a bullish continuation after an uptrend.
The horizontal boundary at 61.26 levels acts as a resistance within this pattern.
A daily close above 63 levels would validate the breakout from the 4-month-long Cup & Handle continuation chart pattern.
Based on this chart pattern, the potential price target is 77.5 levels.
Teşekkürler Roy