

Trade Ideas Equities
RDDT(NYSE), OKLO(NYSE), MGRC(NYSE), GPOR(NYSE), CWEN(NYSE), MDA(TSX), KRDMB(BIST), VNA(XETR)

Reddit, Inc.-(RDDT/NYSE)-Long Idea

Reddit, Inc. operates a digital community in the United States and internationally. The company's platform enables user to engage in conversations, explore passions, research new hobbies, exchange goods and services, create new communities and experiences, share laughs, and find belonging.
The above daily chart formed an approximately 3-month-long H&S bottom chart pattern as a bullish reversal after a downtrend.
The horizontal boundary at 130 levels acted as a resistance within this pattern.
A daily close above 133.9 levels validated the breakout from the 3-month-long H&S bottom chart pattern.
Based on this chart pattern, the potential price target is 208 levels.
RDDT, classified under the "communication services" sector, falls under the “Large Cap - Growth” stock category.
Oklo Inc.-(OKLO/NYSE)-Long Idea
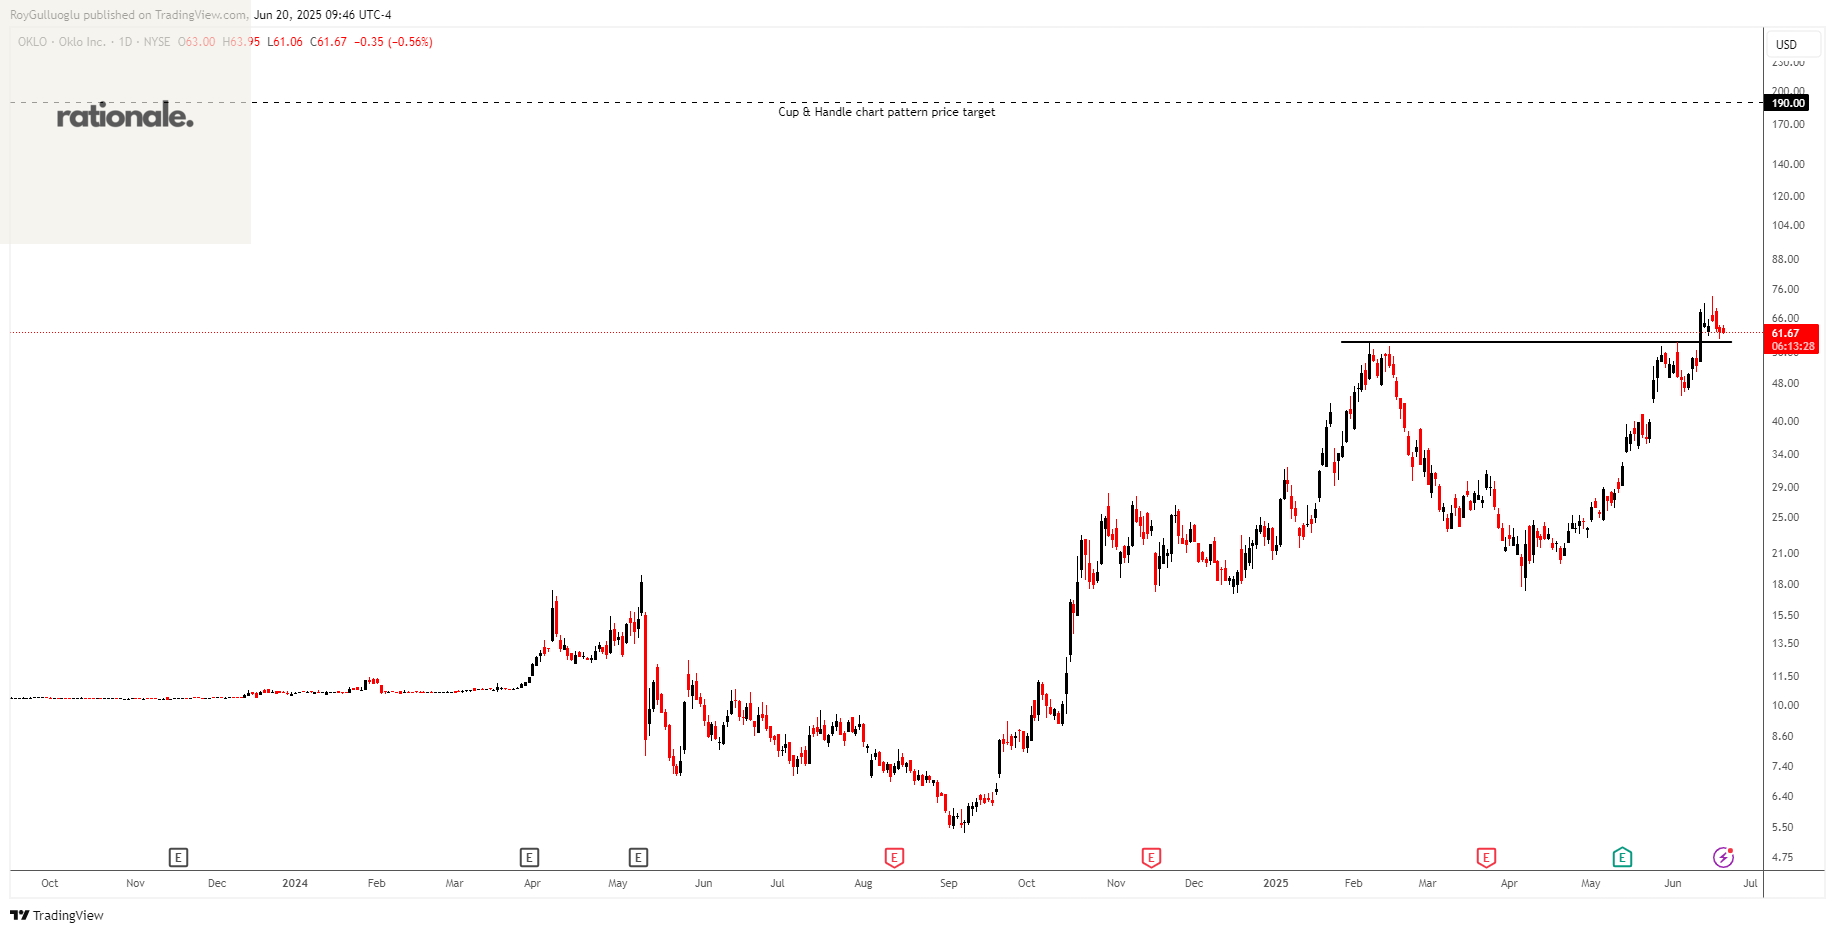
Oklo Inc. develops advanced fission power plants to provide clean, reliable, and affordable energy at scale to the customers in the United States.
The above daily chart formed an approximately 3-month-long Cup & Handle chart pattern as a bullish continuation after an uptrend.
The horizontal boundary at 58.7 levels acted as a resistance within this pattern.
A daily close above 60.45 levels validated the breakout from the 3-month-long Cup & Handle chart pattern.
Based on this chart pattern, the potential price target is 190 levels.
OKLO, classified under the "utilities" sector, falls under the “Mid Cap - Income” stock category.
McGrath RentCorp-(MGRC/NYSE)-Long Idea
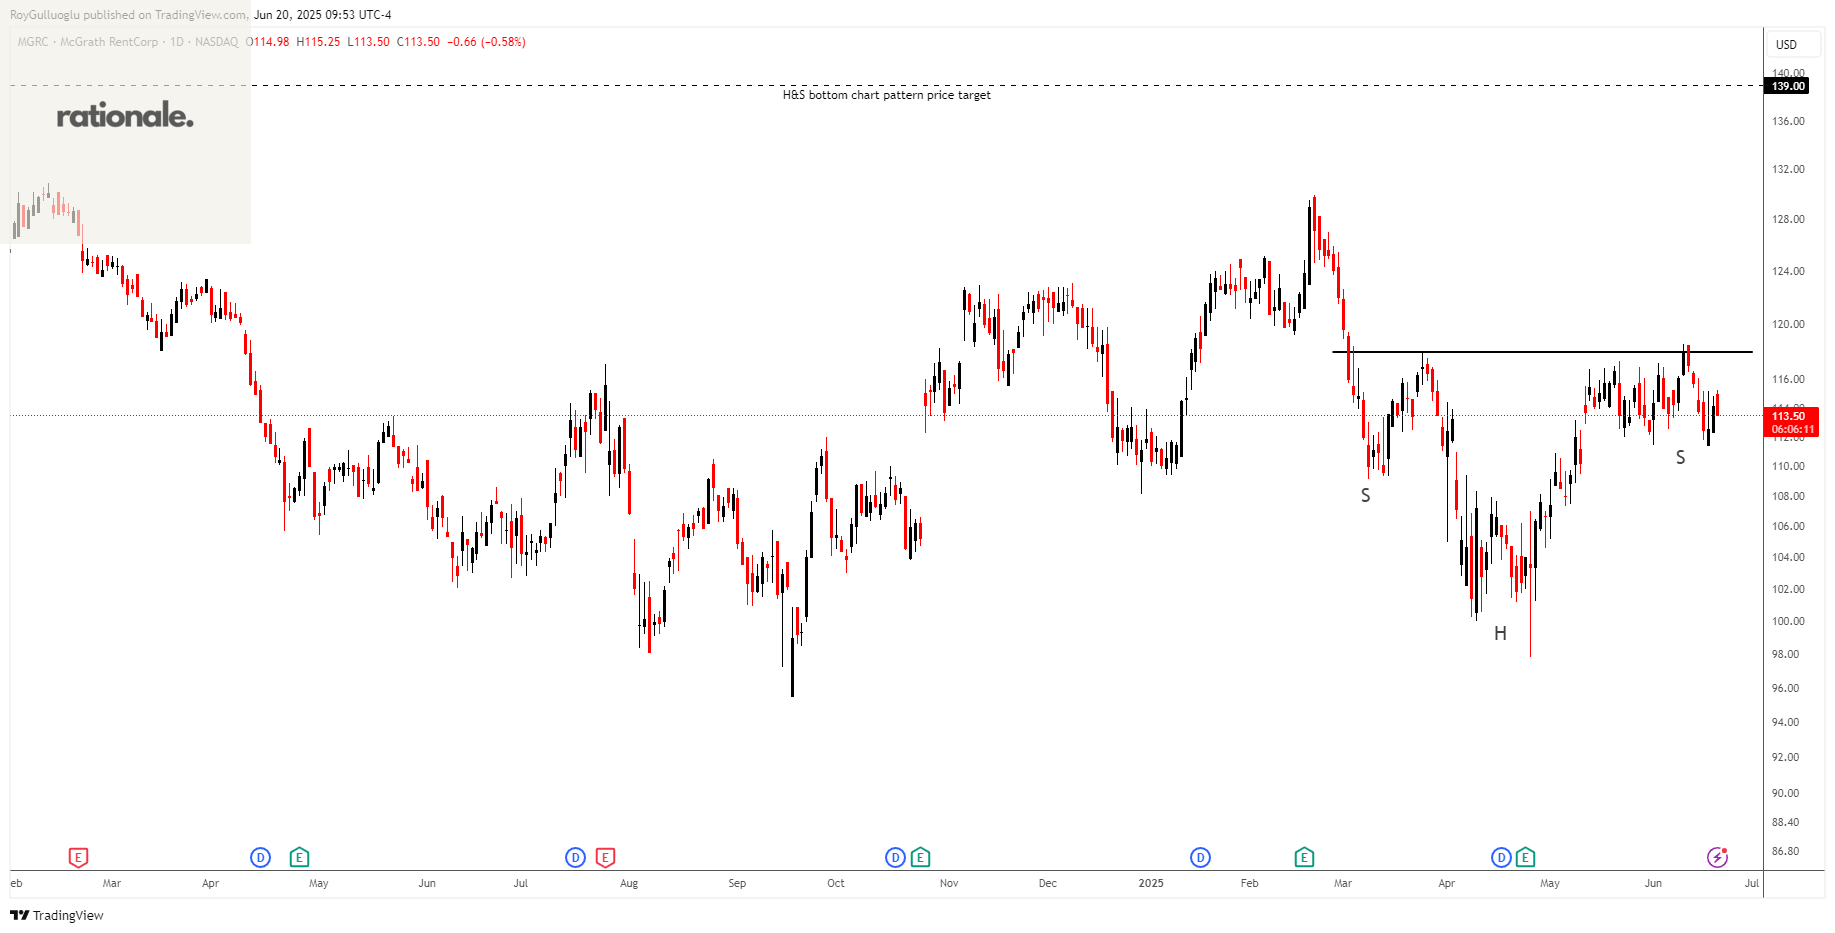
McGrath RentCorp operates as a business-to-business rental company in the United States and internationally.
The above daily chart formed an approximately 3-month-long H&S bottom chart pattern as a bullish reversal after a downtrend.
The horizontal boundary at 118 levels acts as a resistance within this pattern.
A daily close above 121.5 levels would validate the breakout from the 3-month-long H&S bottom chart pattern.
Based on this chart pattern, the potential price target is 139 levels.
MGRC, classified under the "utilities" sector, falls under the “Mid Cap - Income” stock category.
Gulfport Energy Corporation-(GPOR/NYSE)-Long Idea
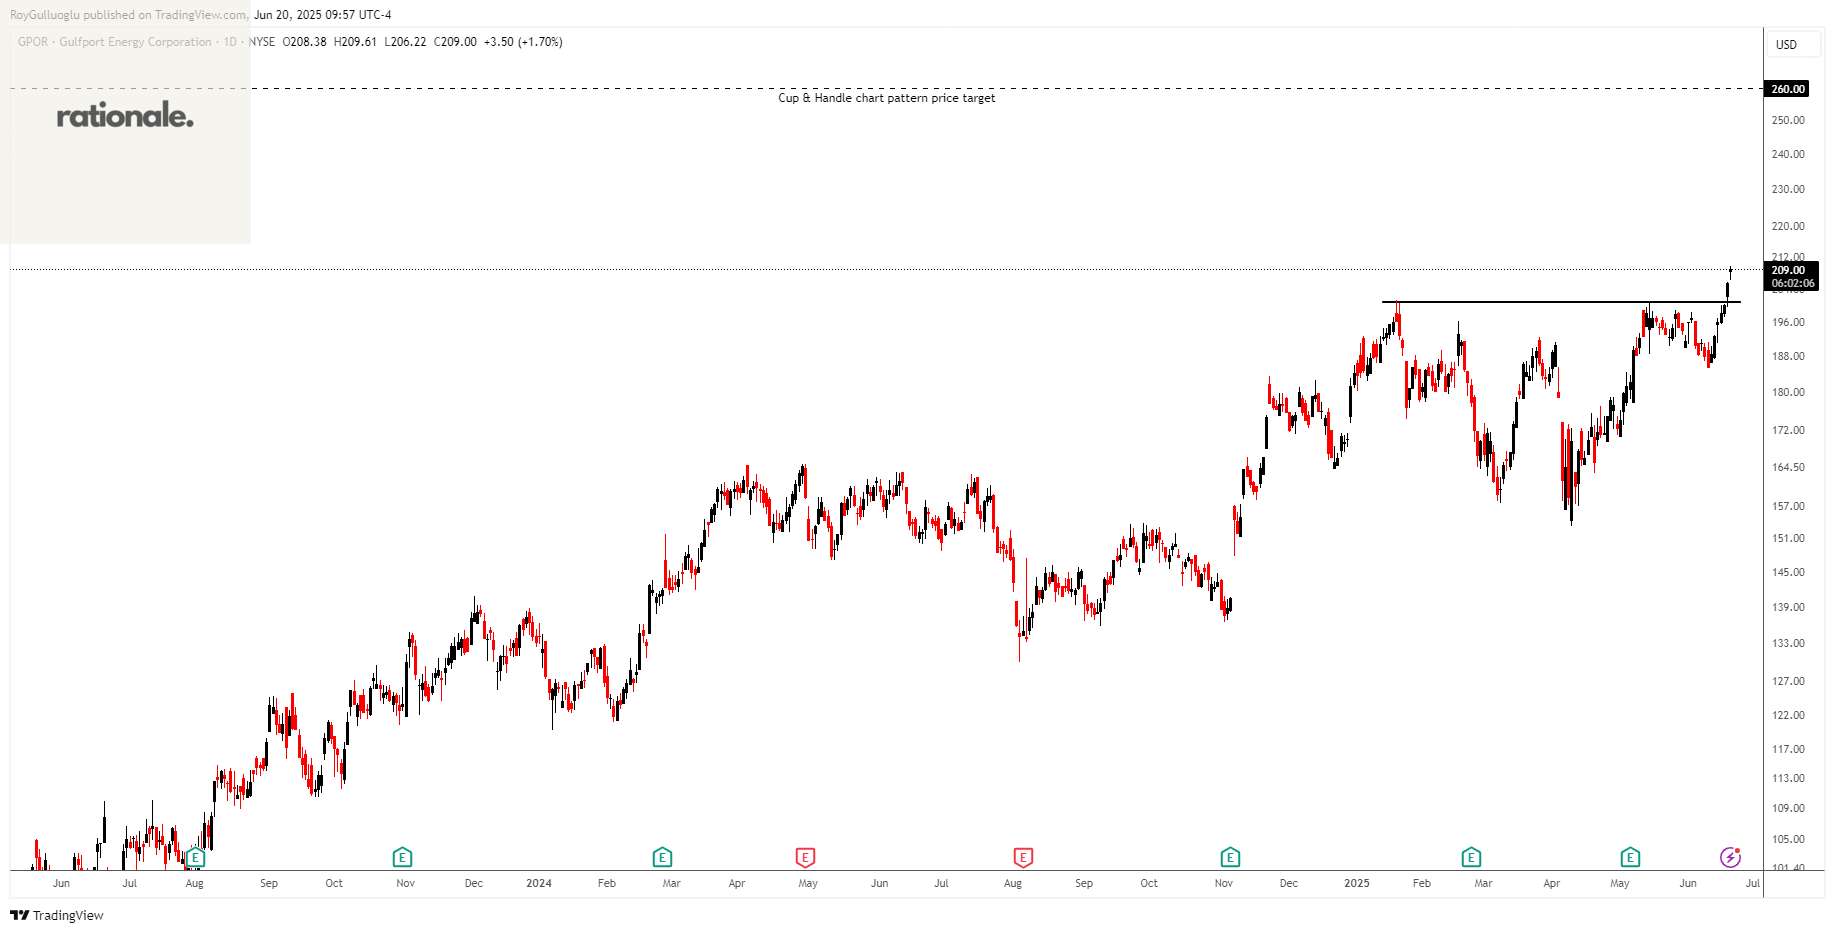
Gulfport Energy Corporation engages in the acquisition, exploration, and production of natural gas, crude oil, and natural gas liquids in the United States.
The above daily chart formed an approximately 3-month-long Cup & Handle chart pattern as a bullish continuation after an uptrend.
The horizontal boundary at 200.75 levels acted as a resistance within this pattern.
A daily close above 206.8 levels validated the breakout from the 3-month-long Cup & Handle chart pattern.
Based on this chart pattern, the potential price target is 260 levels.
GPOR, classified under the "energy" sector, falls under the “Mid Cap - Income” stock category.
Clearway Energy, Inc.-(CWEN/NYSE)-Long Idea
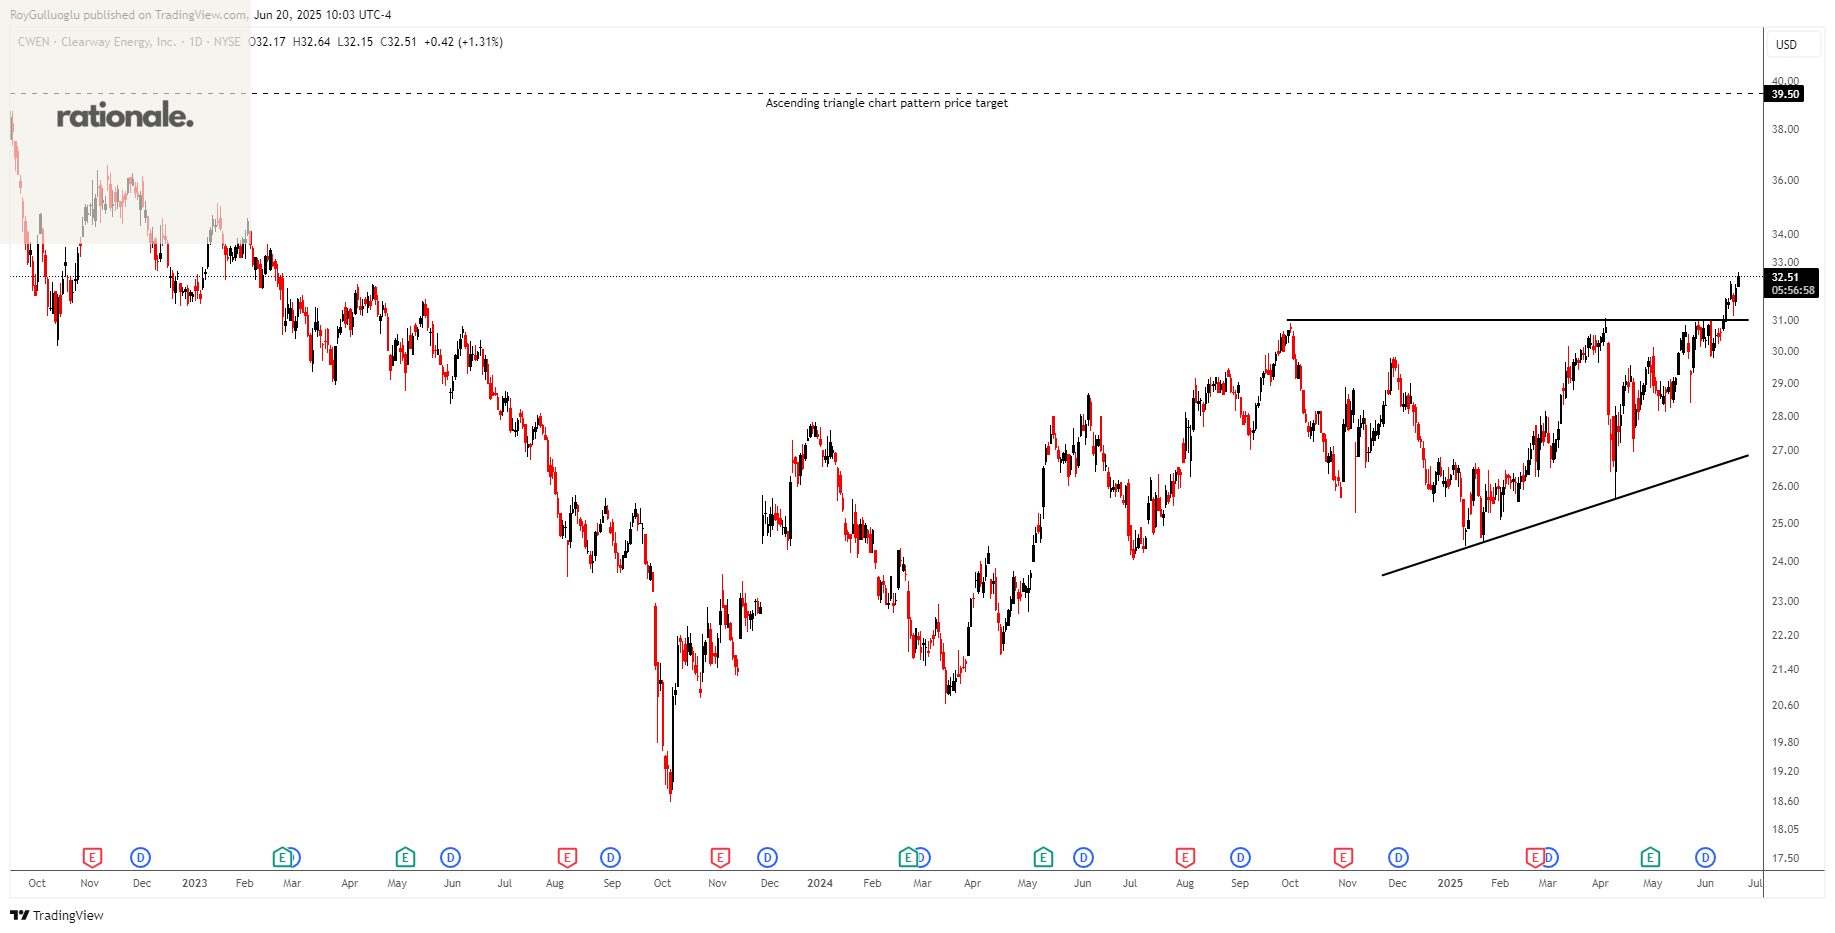
Clearway Energy, Inc. operates in the clean energy generation assets business in the United States. The company operates through Flexible Generation and Renewables segments.
The above daily chart formed an approximately 6-month-long ascending triangle chart pattern as a bullish continuation after an uptrend.
The horizontal boundary at 31 levels acted as a resistance within this pattern.
A daily close above 31.9 levels validated the breakout from the 6-month-long ascending triangle chart pattern.
Based on this chart pattern, the potential price target is 39.5 levels.
CWEN, classified under the "utilities" sector, falls under the “Mid Cap - Income” stock category.
MDA Space Ltd.-(MDA/TSX)-Long Idea
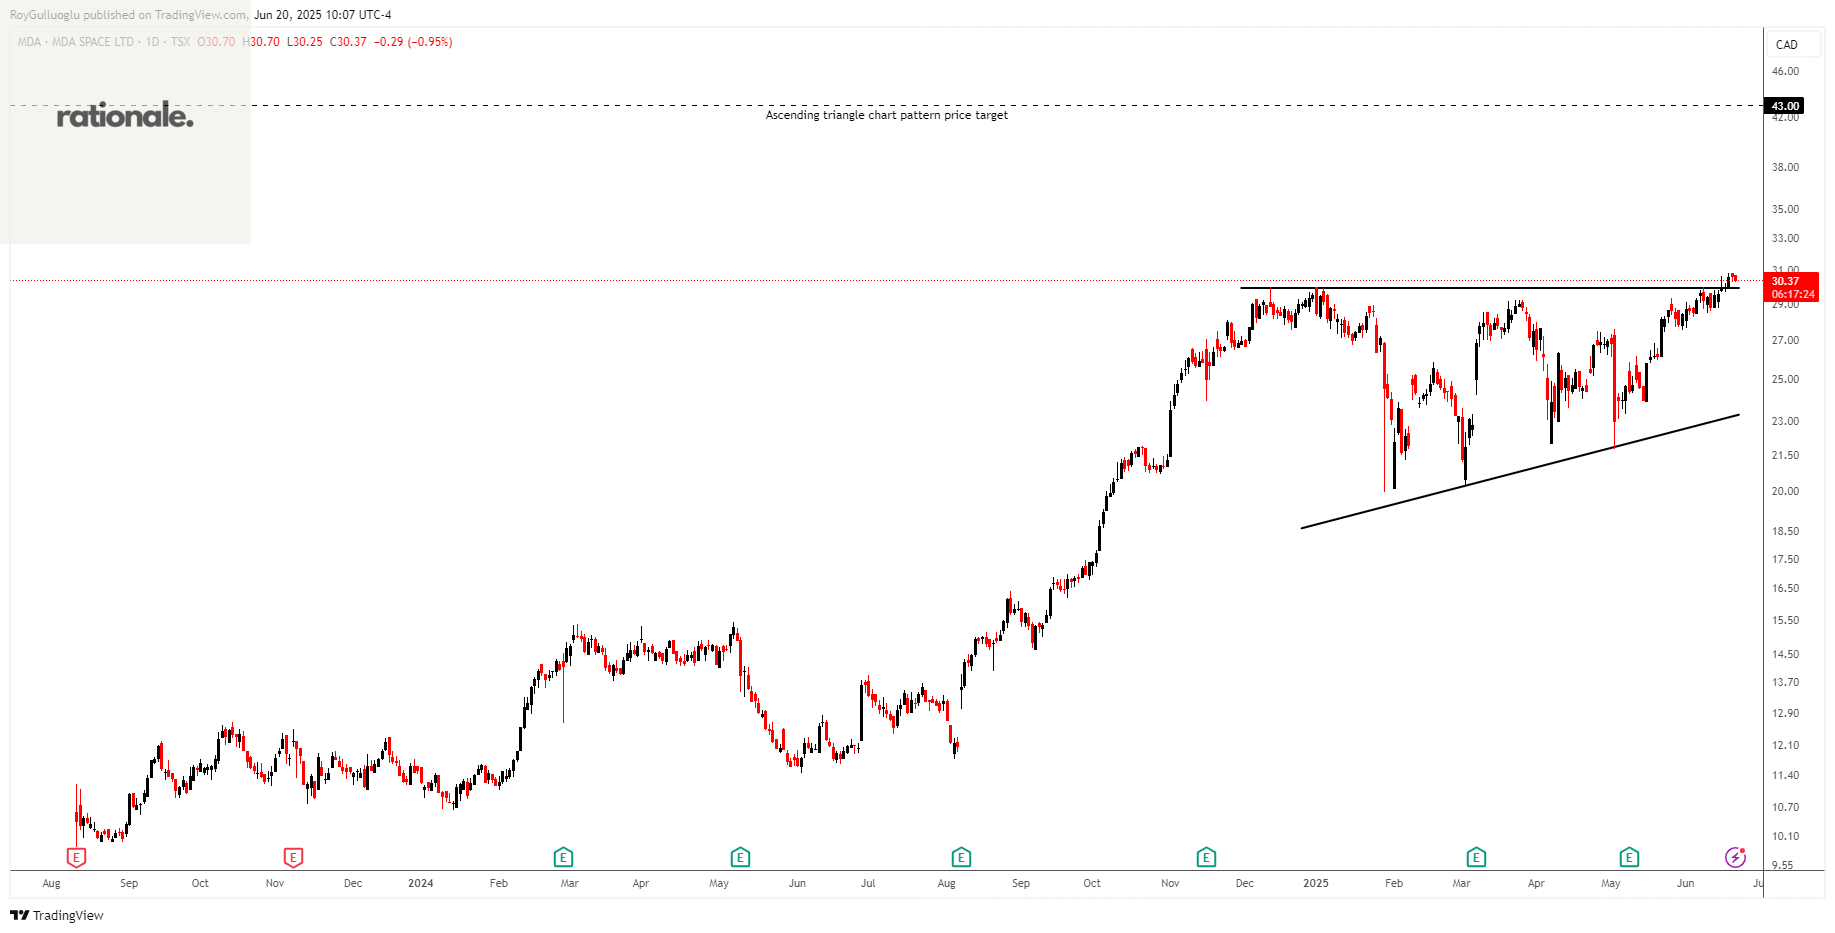
MDA Space Ltd. provides space technology solutions and in Canada, the United States, Europe, Asia, the Middle East, and internationally.
The above daily chart formed an approximately 4-month-long ascending triangle chart pattern as a bullish continuation after an uptrend.
The horizontal boundary at 29.94 levels acts as a resistance within this pattern.
A daily close above 30.83 levels would validate the breakout from the 4-month-long ascending triangle chart pattern.
Based on this chart pattern, the potential price target is 43 levels.
MDA, classified under the "industrials" sector, falls under the “Mid Cap - Value” stock category.
Kardemir Karabük Demir Çelik Sanayi Ve Ticaret A.S.-(KRDMB/BIST)-Long Idea
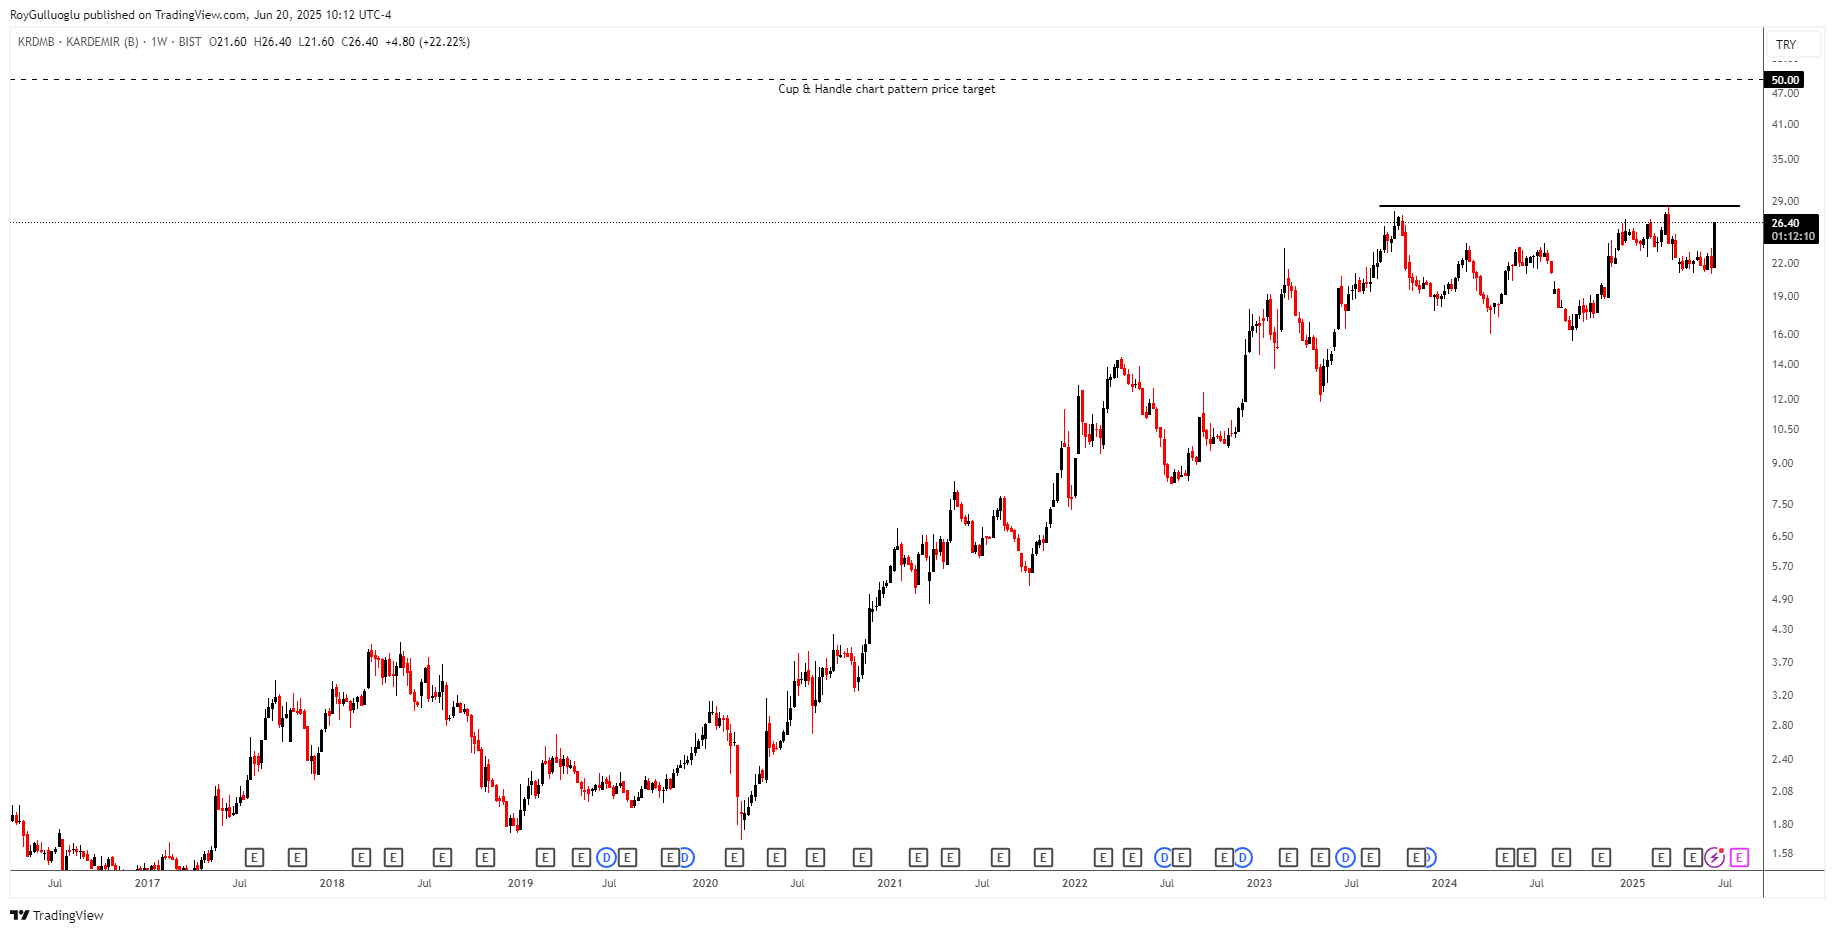
Kardemir Karabük Demir Çelik Sanayi Ve Ticaret A.S. produces and sells iron and steel products in Turkey.
The above daily chart formed an approximately 3-month-long Cup & Handle chart pattern as a bullish continuation after an uptrend.
The horizontal boundary at 28.4 levels acted as a resistance within this pattern.
A daily close above 29.25 levels would validate the breakout from the 3-month-long Cup & Handle chart pattern.
Based on this chart pattern, the potential price target is 50 levels.
KRDMB, classified under the "energy" sector, falls under the “Mid Cap - Income” stock category.
Vonovia SE-(VNA/XETR)-Long Idea
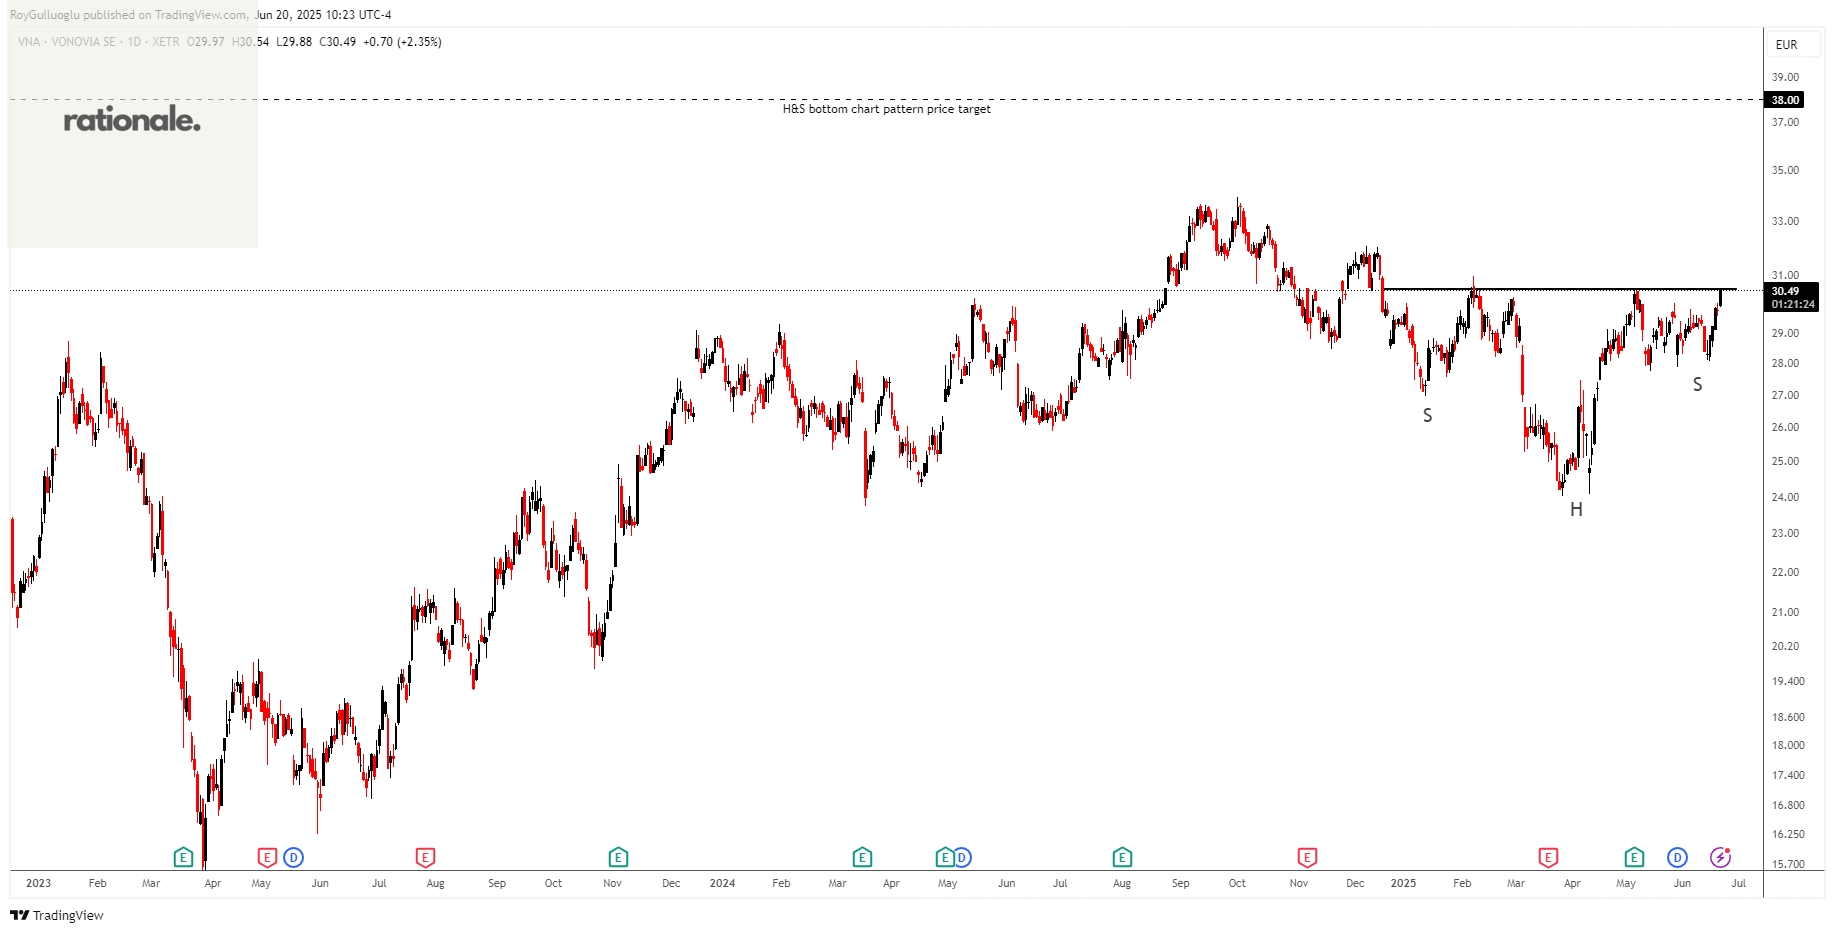
Vonovia SE operates as an integrated residential real estate company in Europe.
The above daily chart formed an approximately 4-month-long H&S bottom chart pattern as a bullish reversal after a downtrend.
The horizontal boundary at 30.5 levels acts as a resistance within this pattern.
A daily close above 31.41 levels would validate the breakout from the 4-month-long H&S bottom chart pattern.
Based on this chart pattern, the potential price target is 38 levels.
VNA, classified under the "utilities" sector, falls under the “Mid Cap - Income” stock category.
Teşekkürler Roy