

New setups
Alamos Gold Inc-(AGI/NYSE)-Long Idea
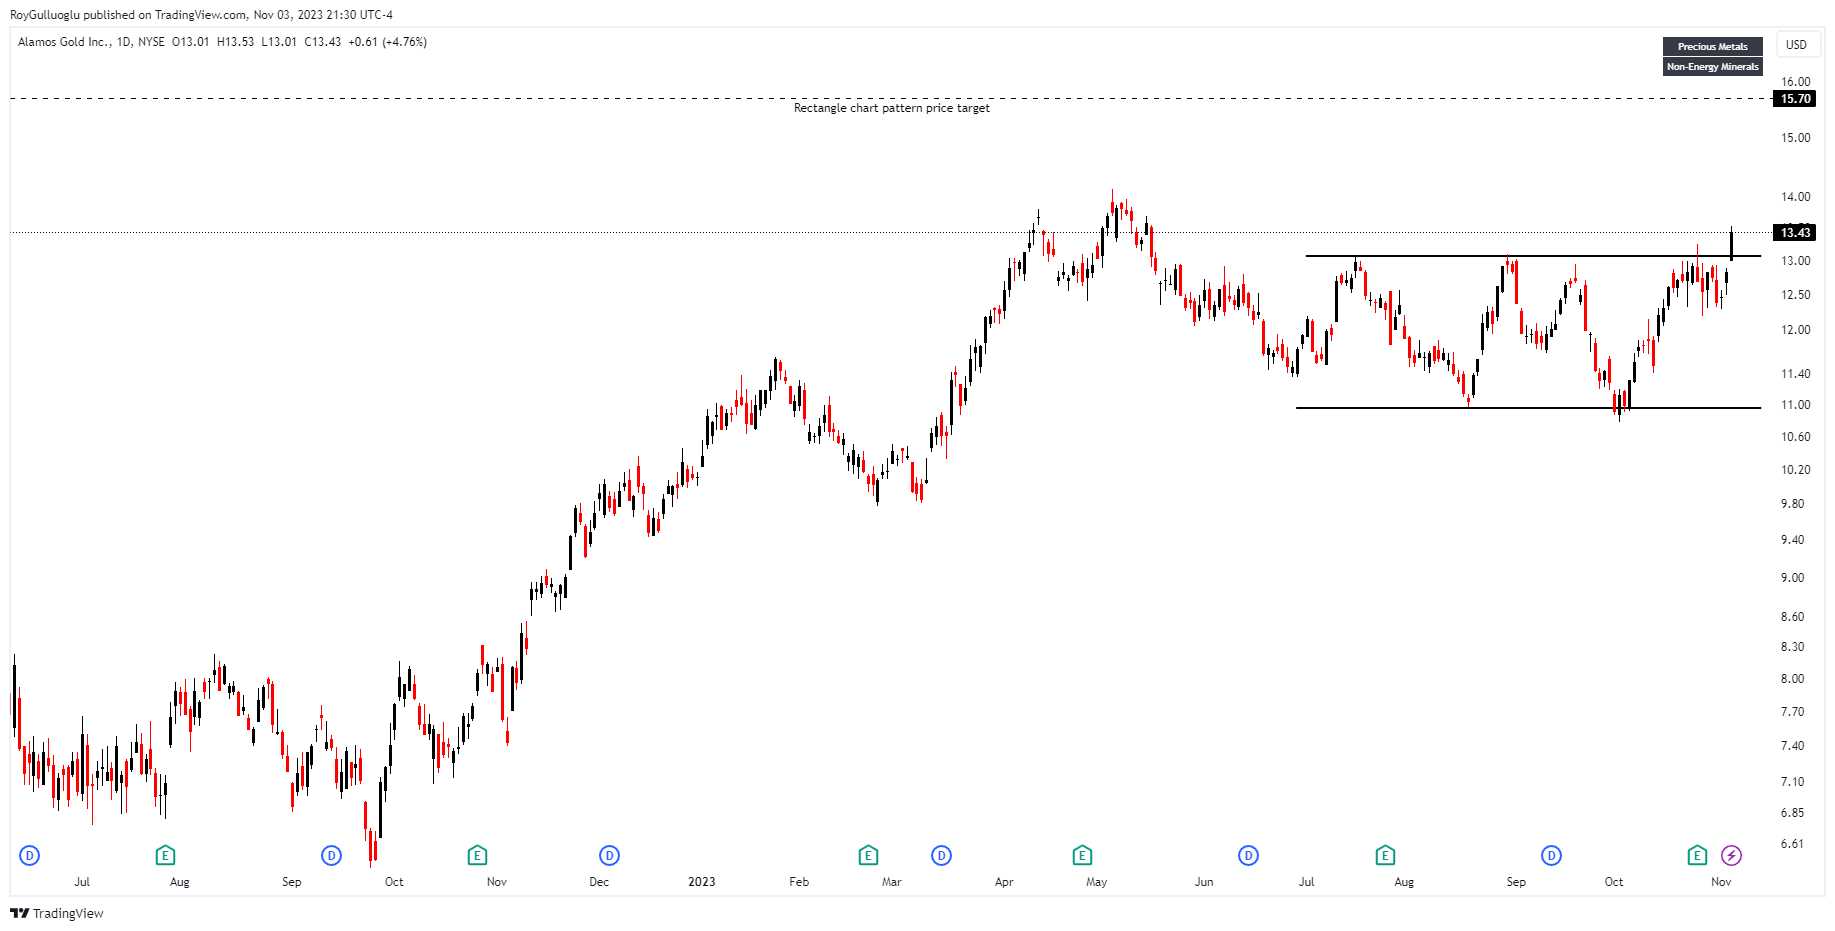
Alamos Gold Inc. is involved in exploring, developing, and extracting precious metals. The company possesses and operates the Mulatos mine and has mineral rights to the Salamandra group of concessions in the State of Sonora, Mexico.
The above daily chart formed an approximately 2.5-month-long rectangle chart pattern.
Within this pattern, the horizontal boundary at 13 levels acted as strong resistance.
A daily close above 13.4 levels validated the breakout from the 2.5-month-long rectangle chart pattern.
The potential price target, based on this chart pattern, is 15.7 levels.
AGI, classified under the "basic materials" sector, falls under the “Mid Cap - Value” stock category.
Halliburton Company-(HAL/NYSE)-Long Idea
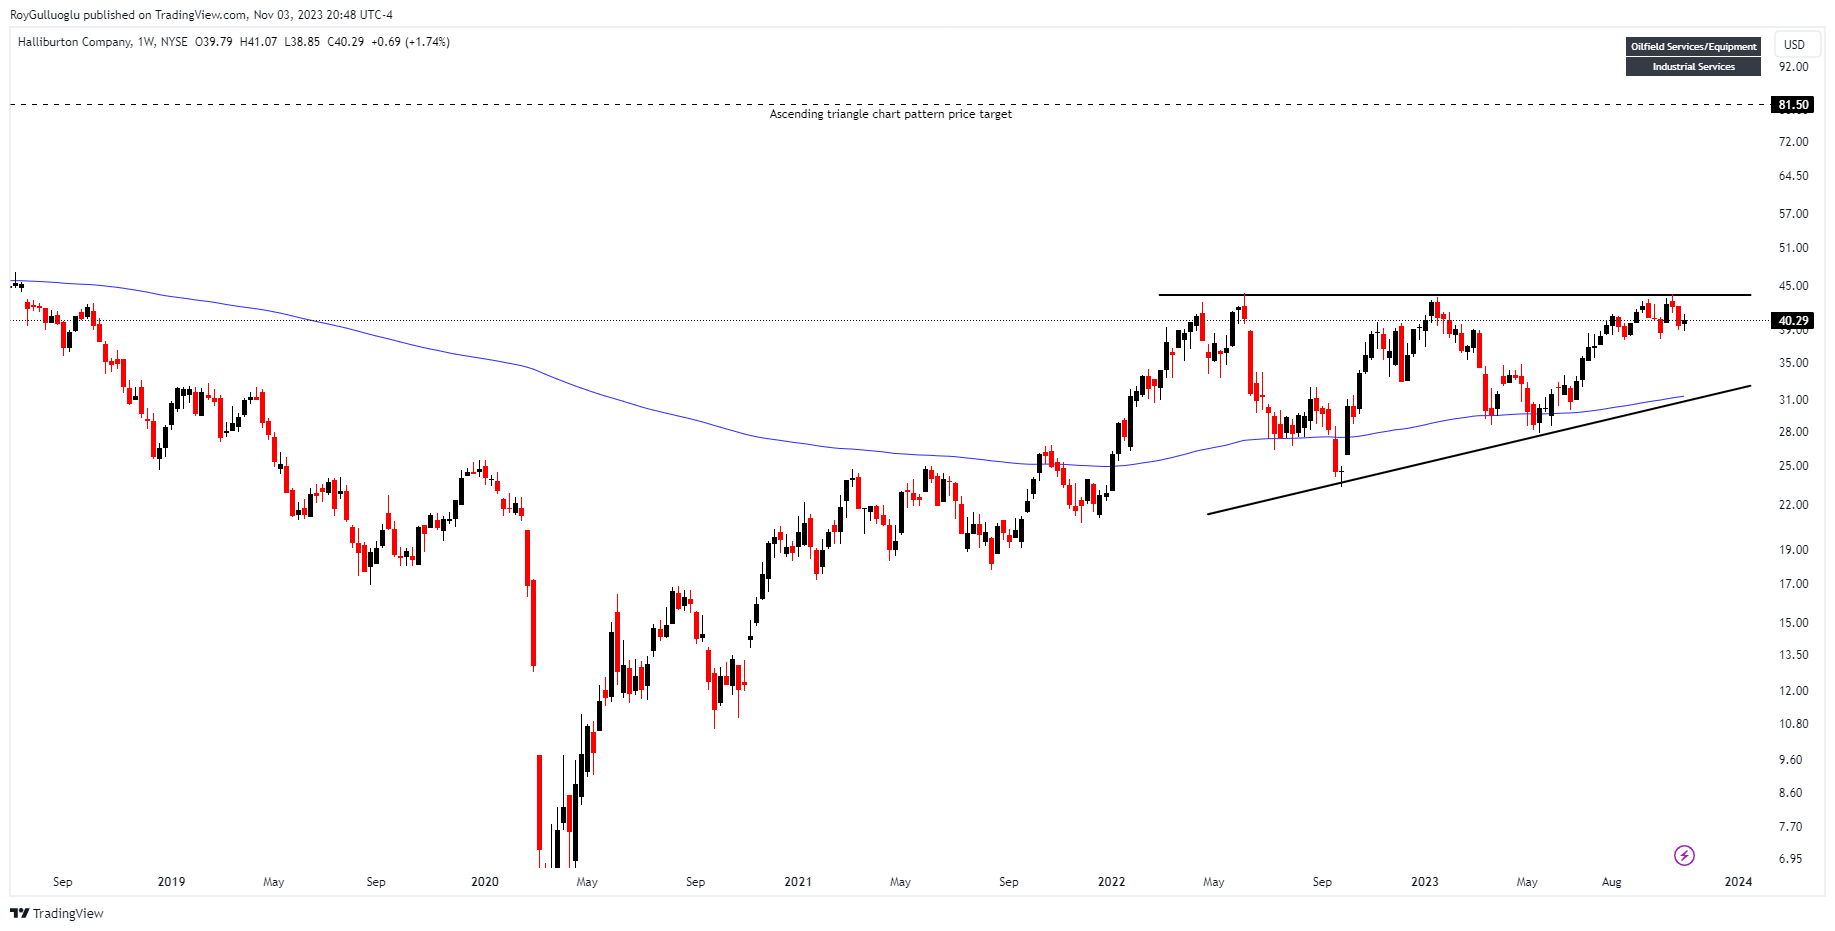
Halliburton Co. provides full-cycle services and products for the upstream oil and gas industry, spanning hydrocarbon discovery, geological data management, drilling, and formation evaluation.
The above weekly chart formed an approximately 18-month-long ascending triangle chart pattern as a bullish continuation after an uptrend.
Within this pattern, the horizontal boundary at 43.6 levels acts as strong resistance.
A daily close above 44.9 levels would validate the breakout from the 18-month-long ascending triangle chart pattern.
The potential price target, based on this chart pattern, is 81.5 levels.
HAL, classified under the "energy" sector, falls under the “Large Cap - Income” stock category.
UiPath Inc-(PATH/NYSE)-Long Idea
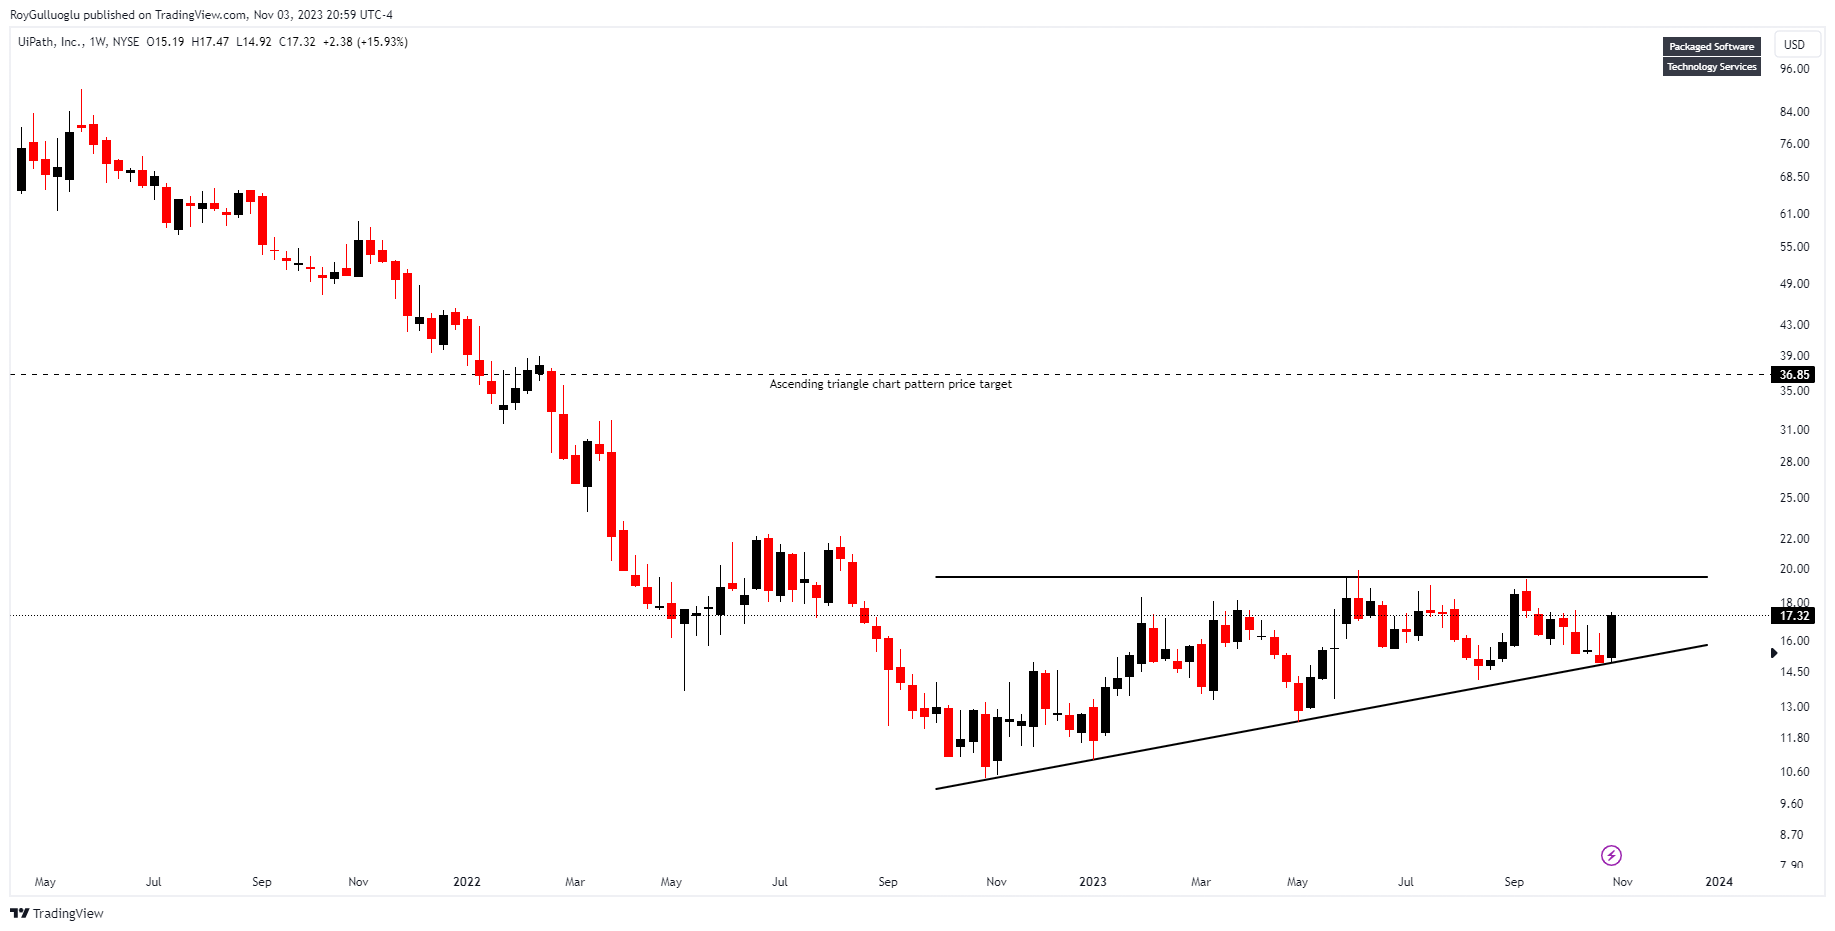
UiPath creates a versatile automation platform used across a wide range of tasks, generating revenue from software licenses, maintenance, support, and services.
The above weekly chart formed an approximately 13-month-long ascending triangle chart pattern as a bullish reversal after a downtrend.
Within this pattern, the horizontal boundary at 19.5 levels acts as strong resistance.
A daily close above 20.08 levels would validate the breakout from the 13-month-long ascending triangle chart pattern.
The potential price target, based on this chart pattern, is 36.85 levels.
PATH, classified under the "technology" sector, falls under the “Mid Cap - Growth” stock category.
Microsoft Corp-(MSFT/NASDAQ)-Long Idea
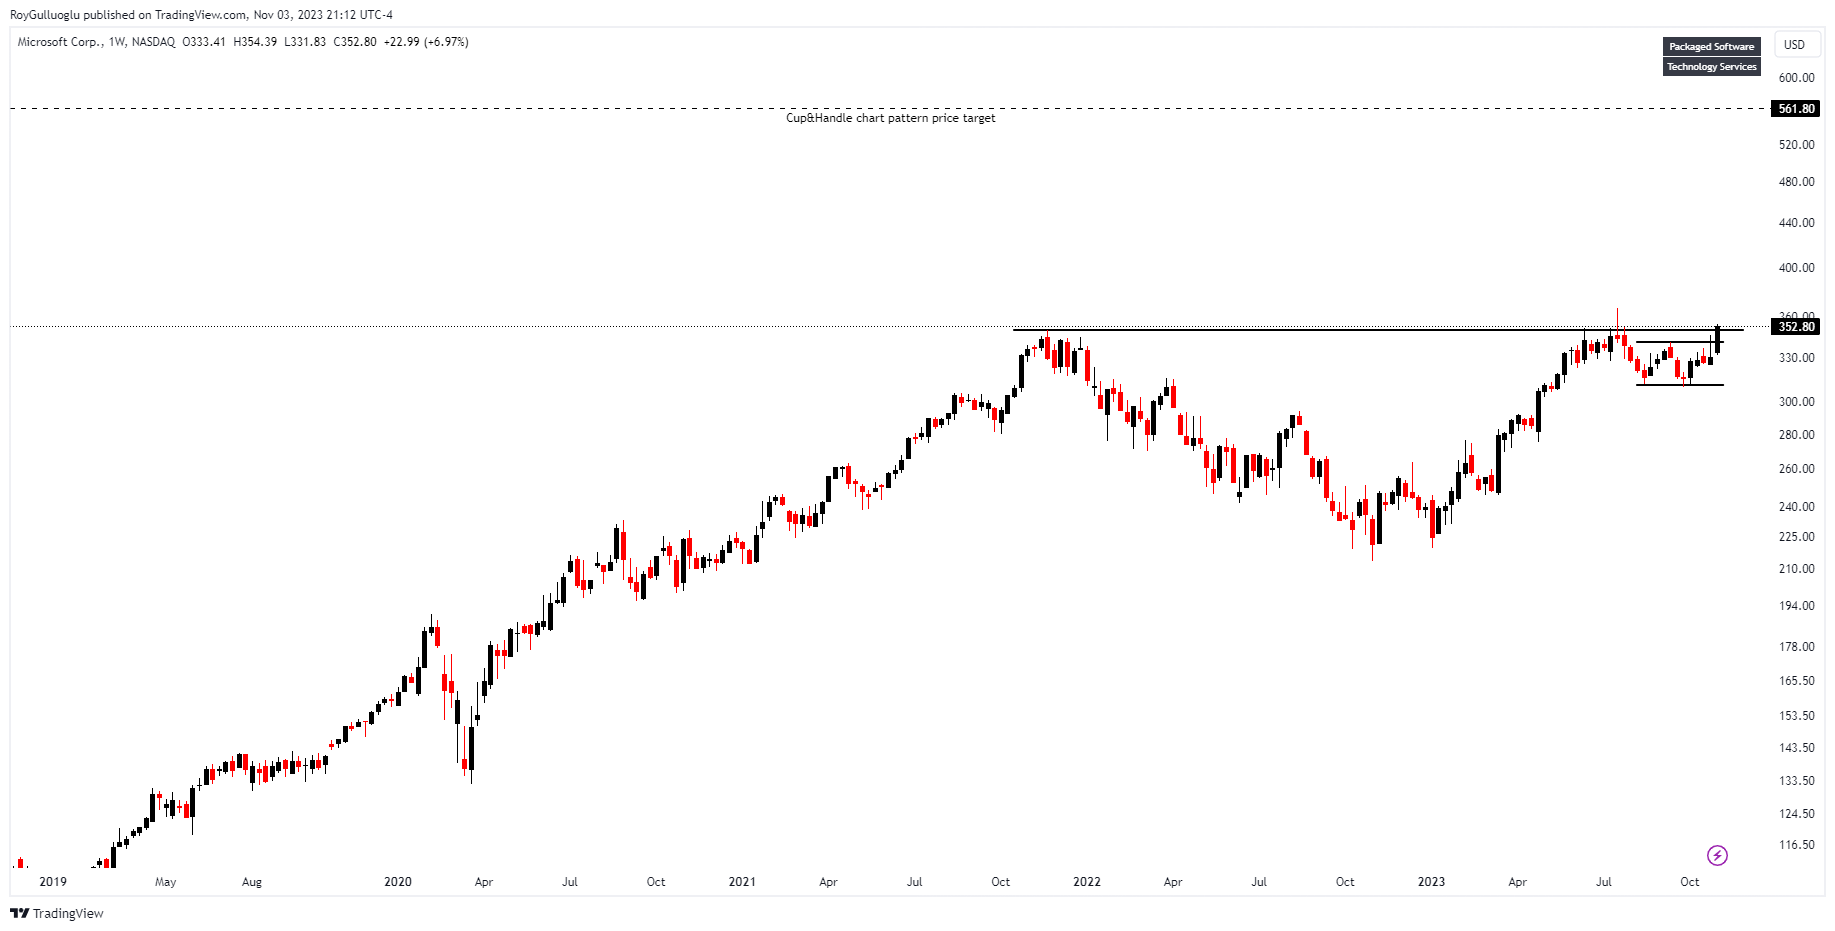
Microsoft Corp is a tech company that develops, licenses, and provides support for a diverse array of software products and services.
The above weekly chart formed an approximately 25-month-long cup & handle chart pattern as a bullish continuation after an uptrend.
Within this pattern, the horizontal boundary at 350 levels acts as strong resistance.
A daily close above 360 levels would validate the breakout from the 25-month-long cup & handle chart pattern.
The potential price target, based on this chart pattern, is 561.8 levels.
MSFT, classified under the "technology" sector, falls under the “Large Cap - Growth” stock category.
Walt Disney Company-(DIS/NYSE)-Long Idea
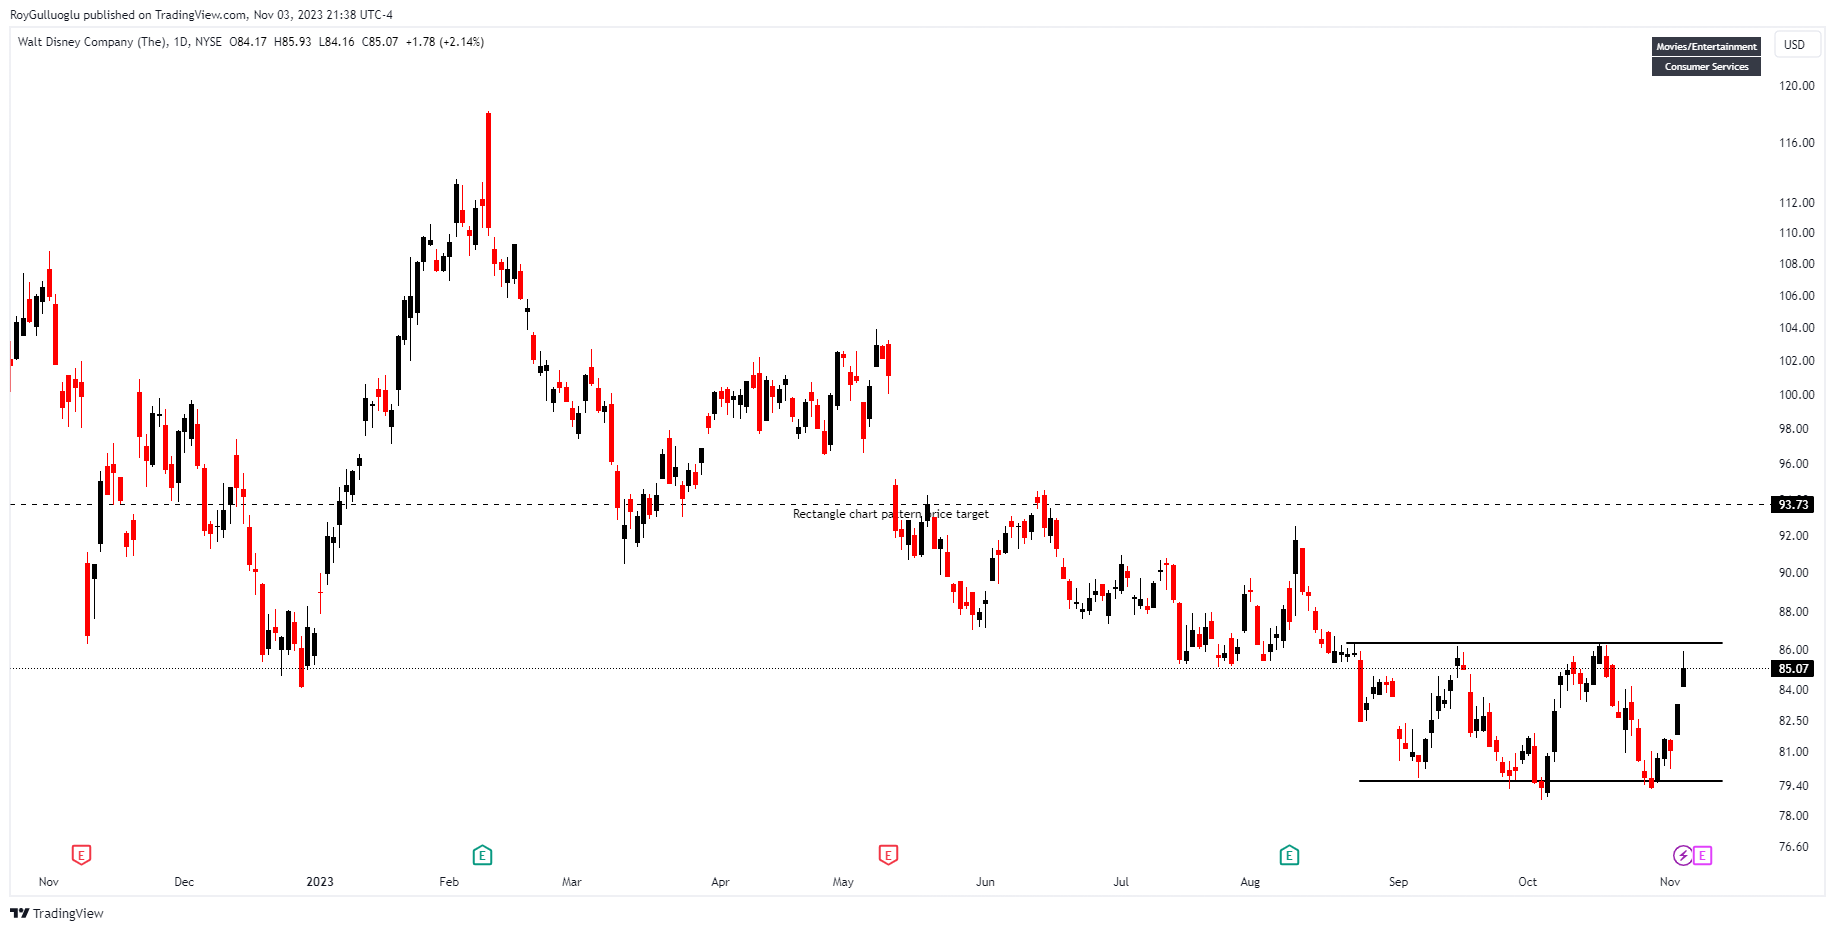
Walt Disney Co., along with its affiliated companies, is a globally diversified entertainment enterprise encompassing four key business segments: Media Networks, Parks and Resorts, Studio Entertainment, and Consumer Products & Interactive Media.
The above daily chart formed an approximately 1.5-month-long rectangle chart pattern as a bullish reversal after a downtrend.
Within this pattern, the horizontal boundary at 86.35 levels acts as strong resistance.
A daily close above 88.9 levels would validate the breakout from the 1.5-month-long rectangle chart pattern.
The potential price target, based on this chart pattern, is 93.7 levels.
MSFT, classified under the "communication services" sector, falls under the “Large Cap - Growth” stock category.
Jbs s.a.-(JBSS3/NYSE)-Long Idea
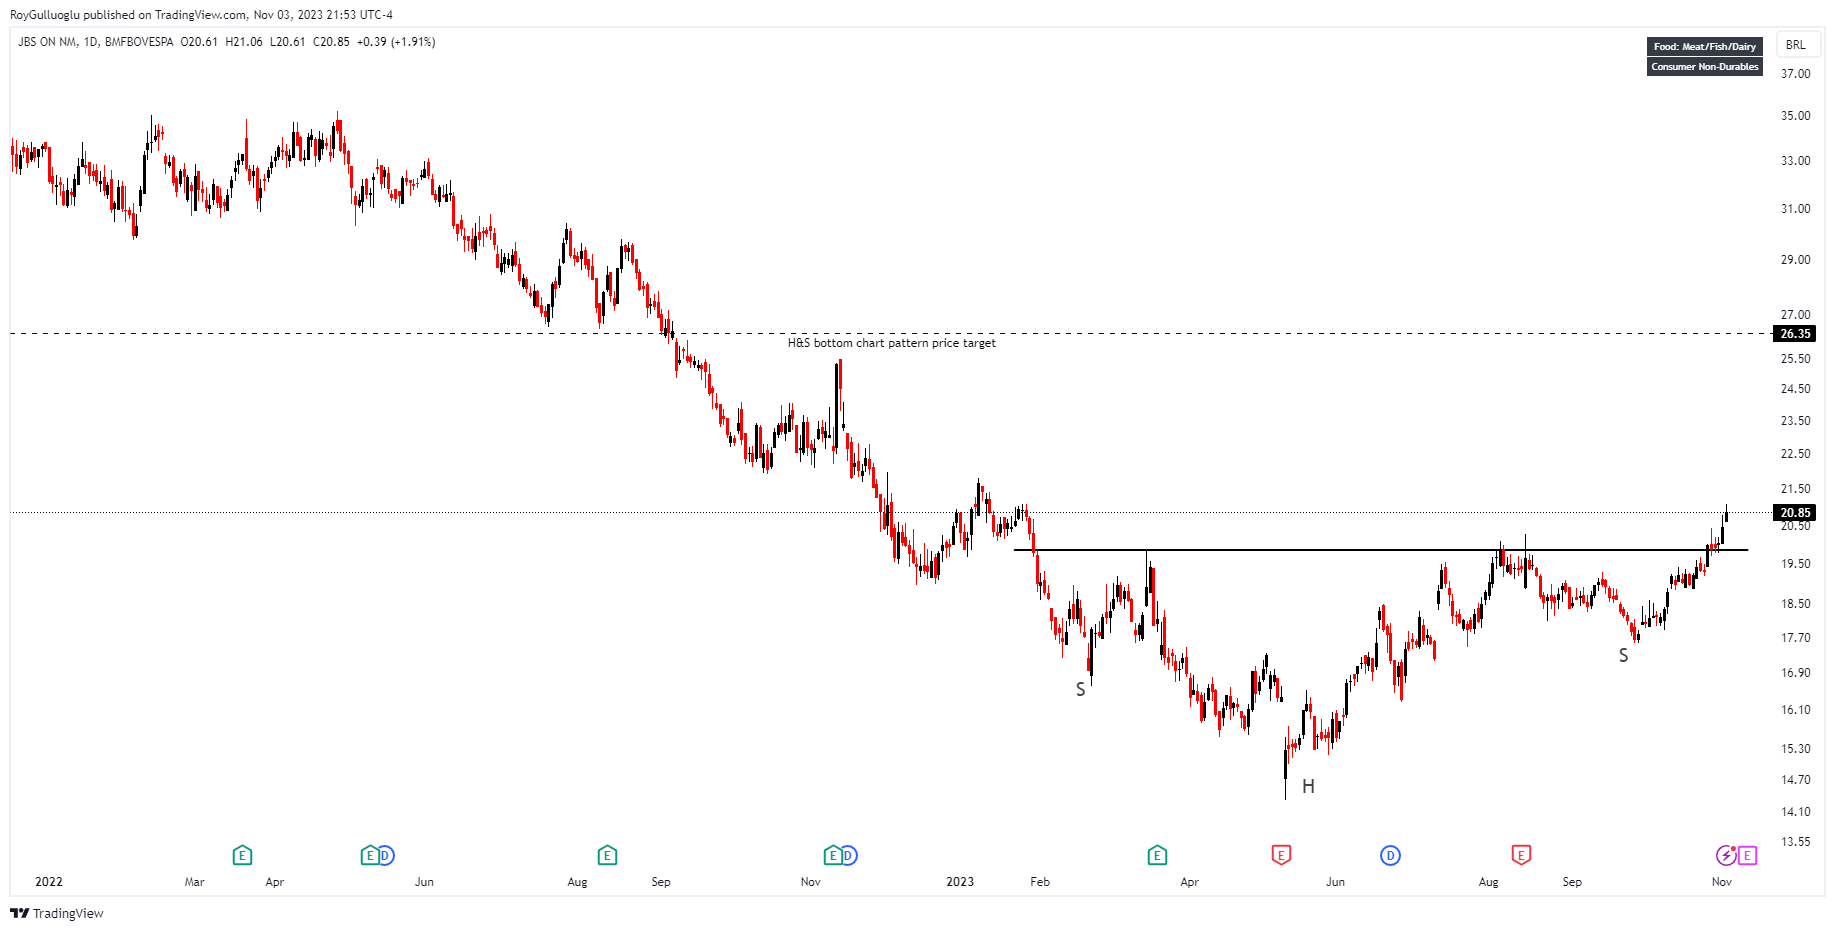
JBS S.A. is a Brazilian firm that holds the title of being the world's largest meat processing company. It specializes in the production of factory-processed beef, chicken, and pork, as well as marketing by-products derived from the meat processing operations.
The above daily chart formed an approximately 6-month-long H&S bottom chart pattern as a bullish reversal after a downtrend.
Within this pattern, the horizontal boundary at 19.84 levels acts as strong resistance.
A daily close above 20.45 levels validated the breakout from the 6-month-long H&S bottom chart pattern.
The potential price target, based on this chart pattern, is 26.35 levels.
Follow-ups
Hilton Worldwide Holdings-(HLT/NYSE)-Long/Short Idea
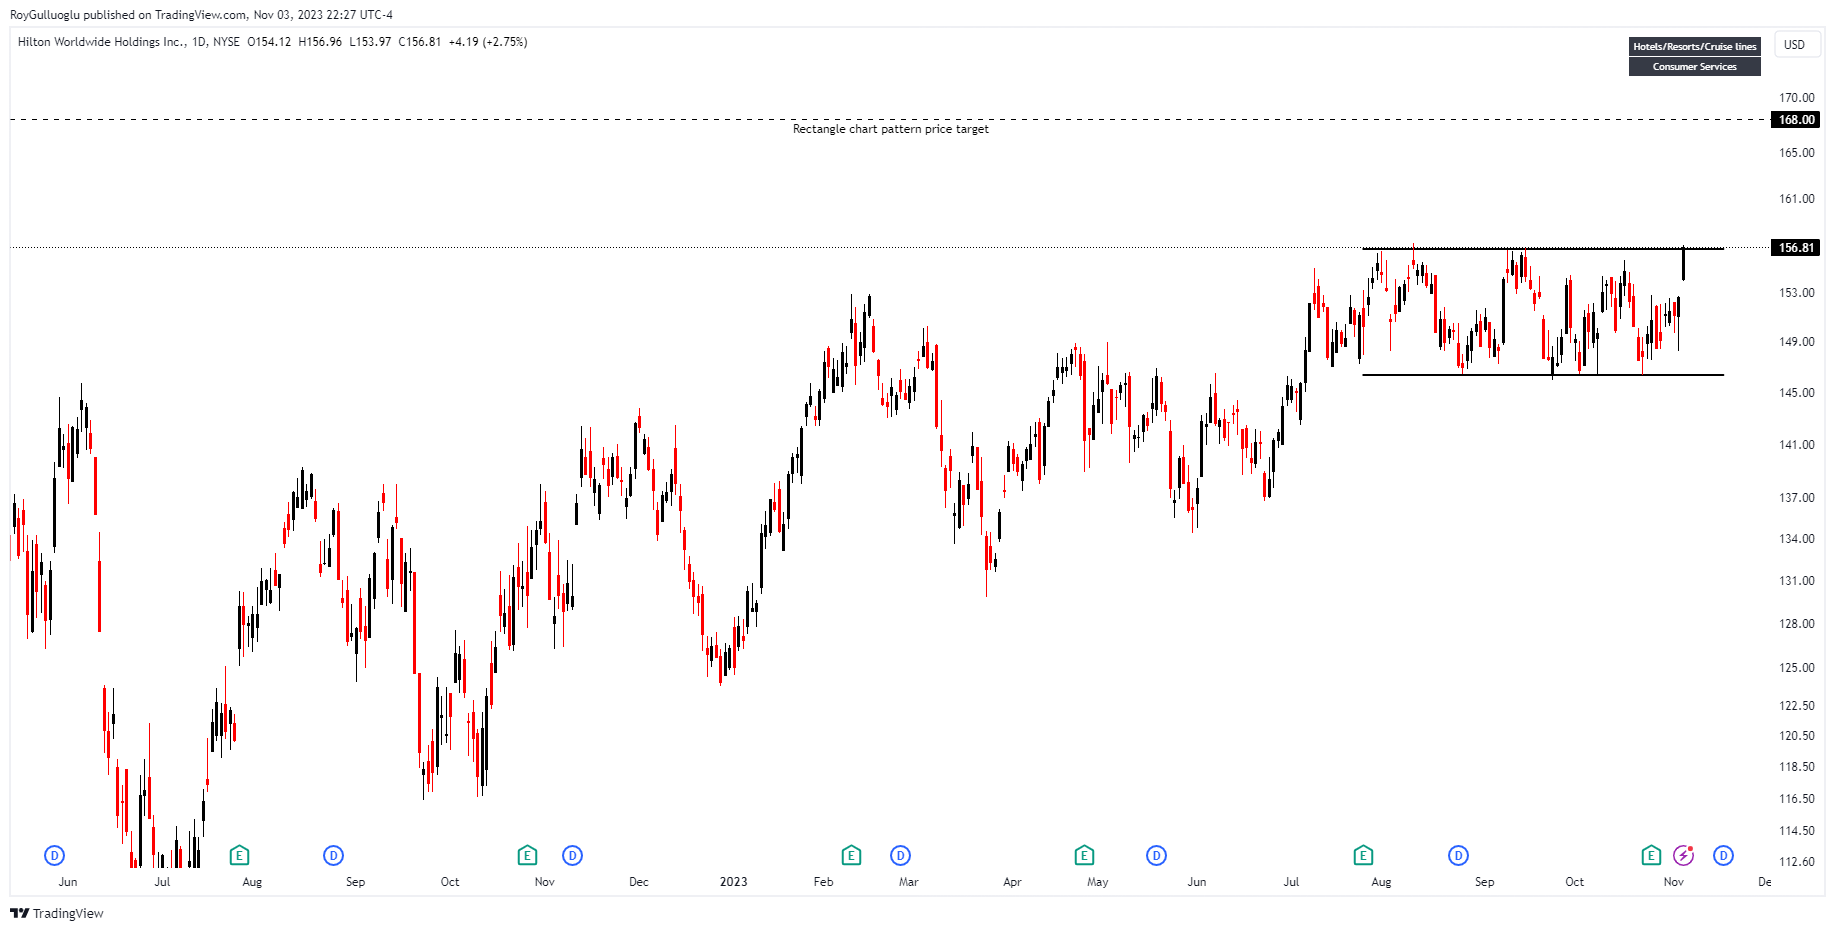
You can click the HLT ticker above to access the first report explaining the RATIONALE behind the trade idea.
Innoviva Inc-(INVA/NASDAQ)-Long Idea
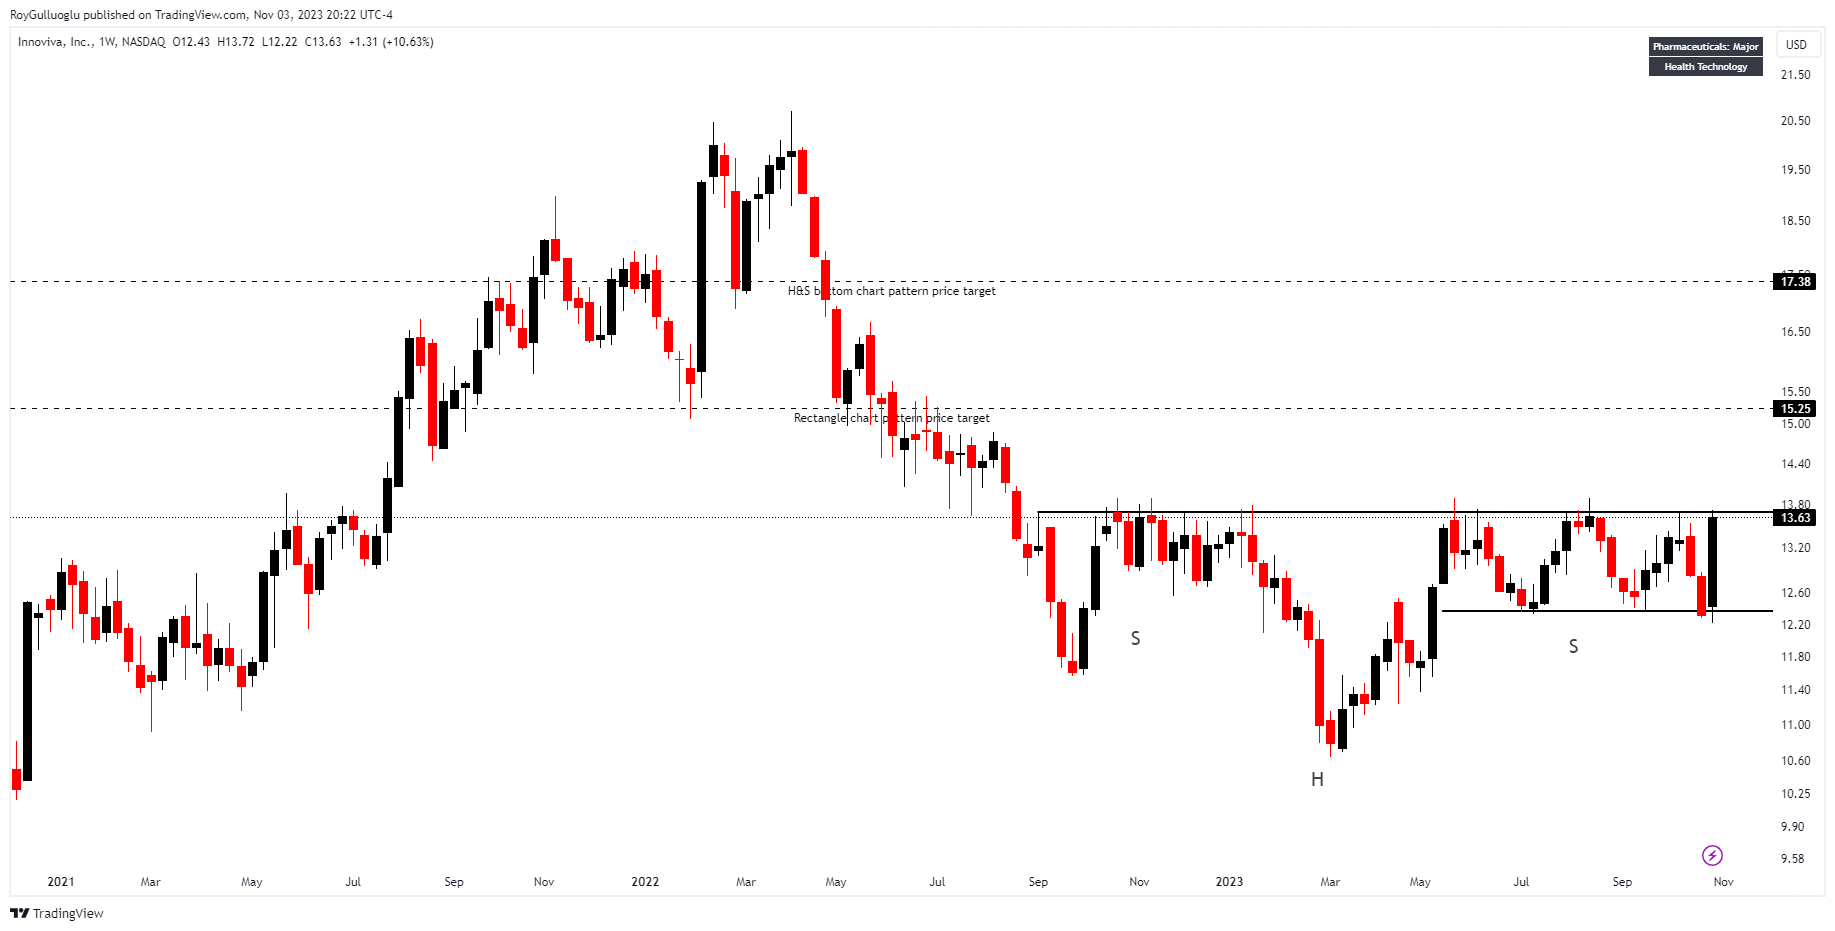
You can click the INVA ticker above to access the first report explaining the RATIONALE behind the trade idea.
In the previous report, INVA was evaluated on a daily basis. Here I also would like to add a broader outlook by adding the weekly chart.
Motorola Solutions Inc-(MSI/NYSE)-Long Idea
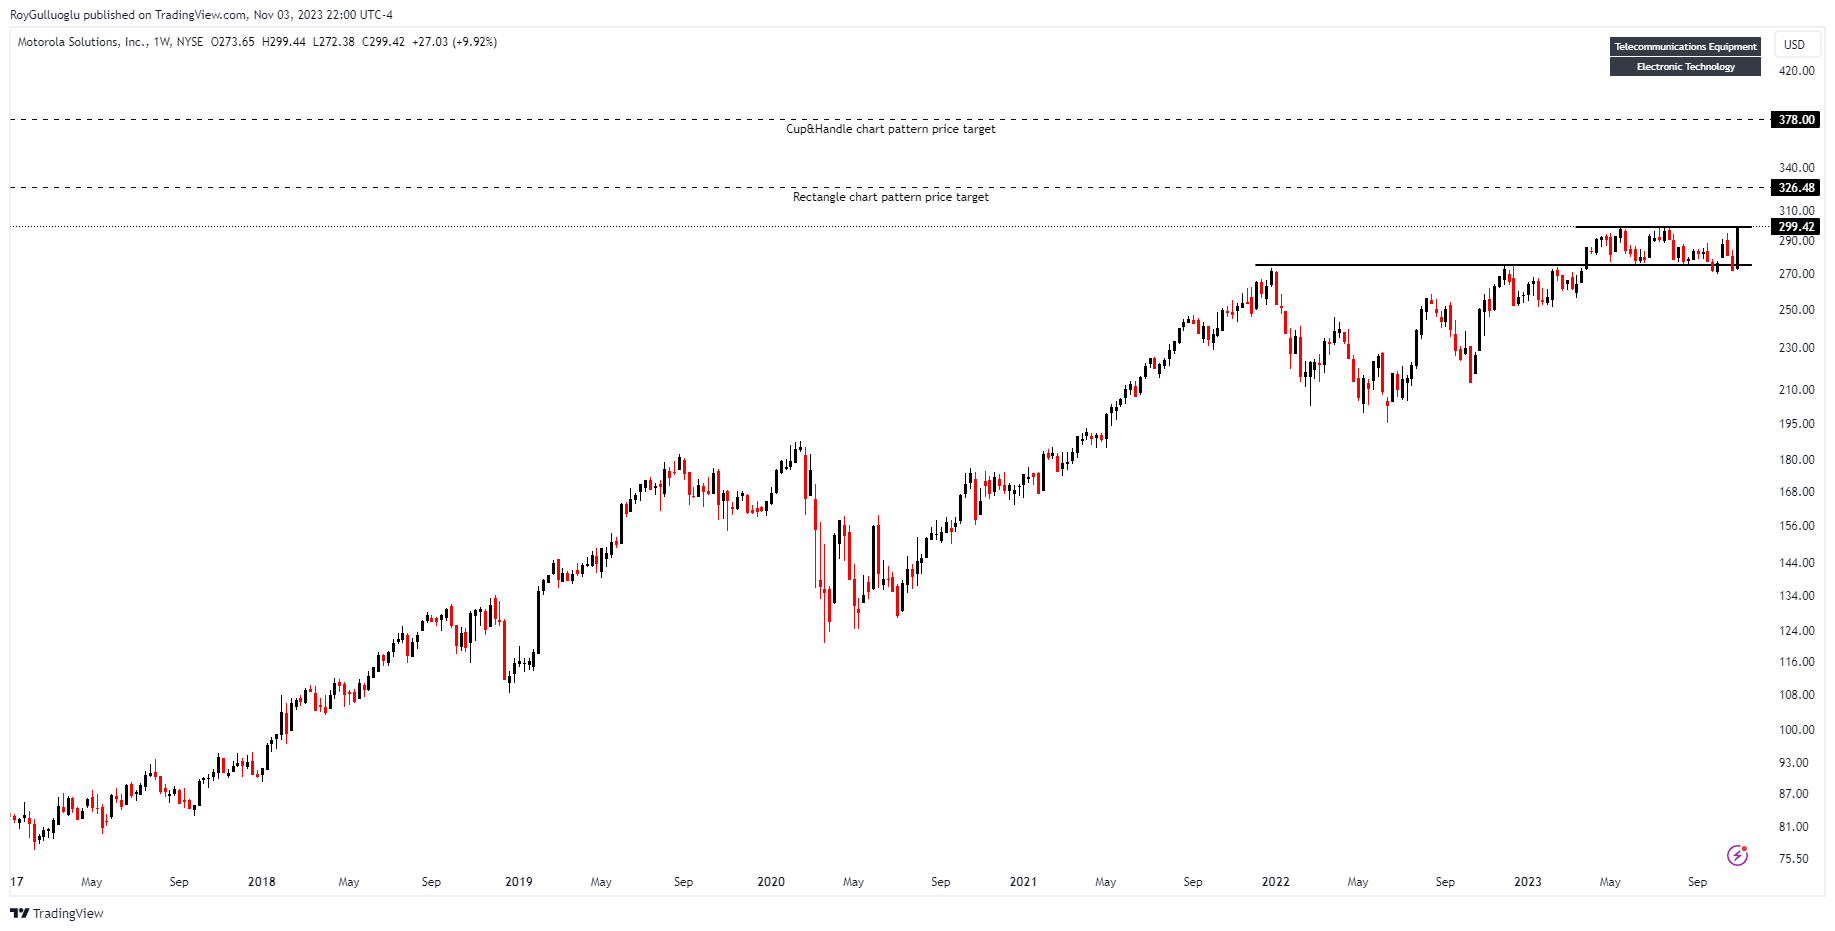
You can click the MSI ticker above to access the first report explaining the RATIONALE behind the trade idea.
Alkami Technology Inc-(ALKT/NYSE)-Long Idea
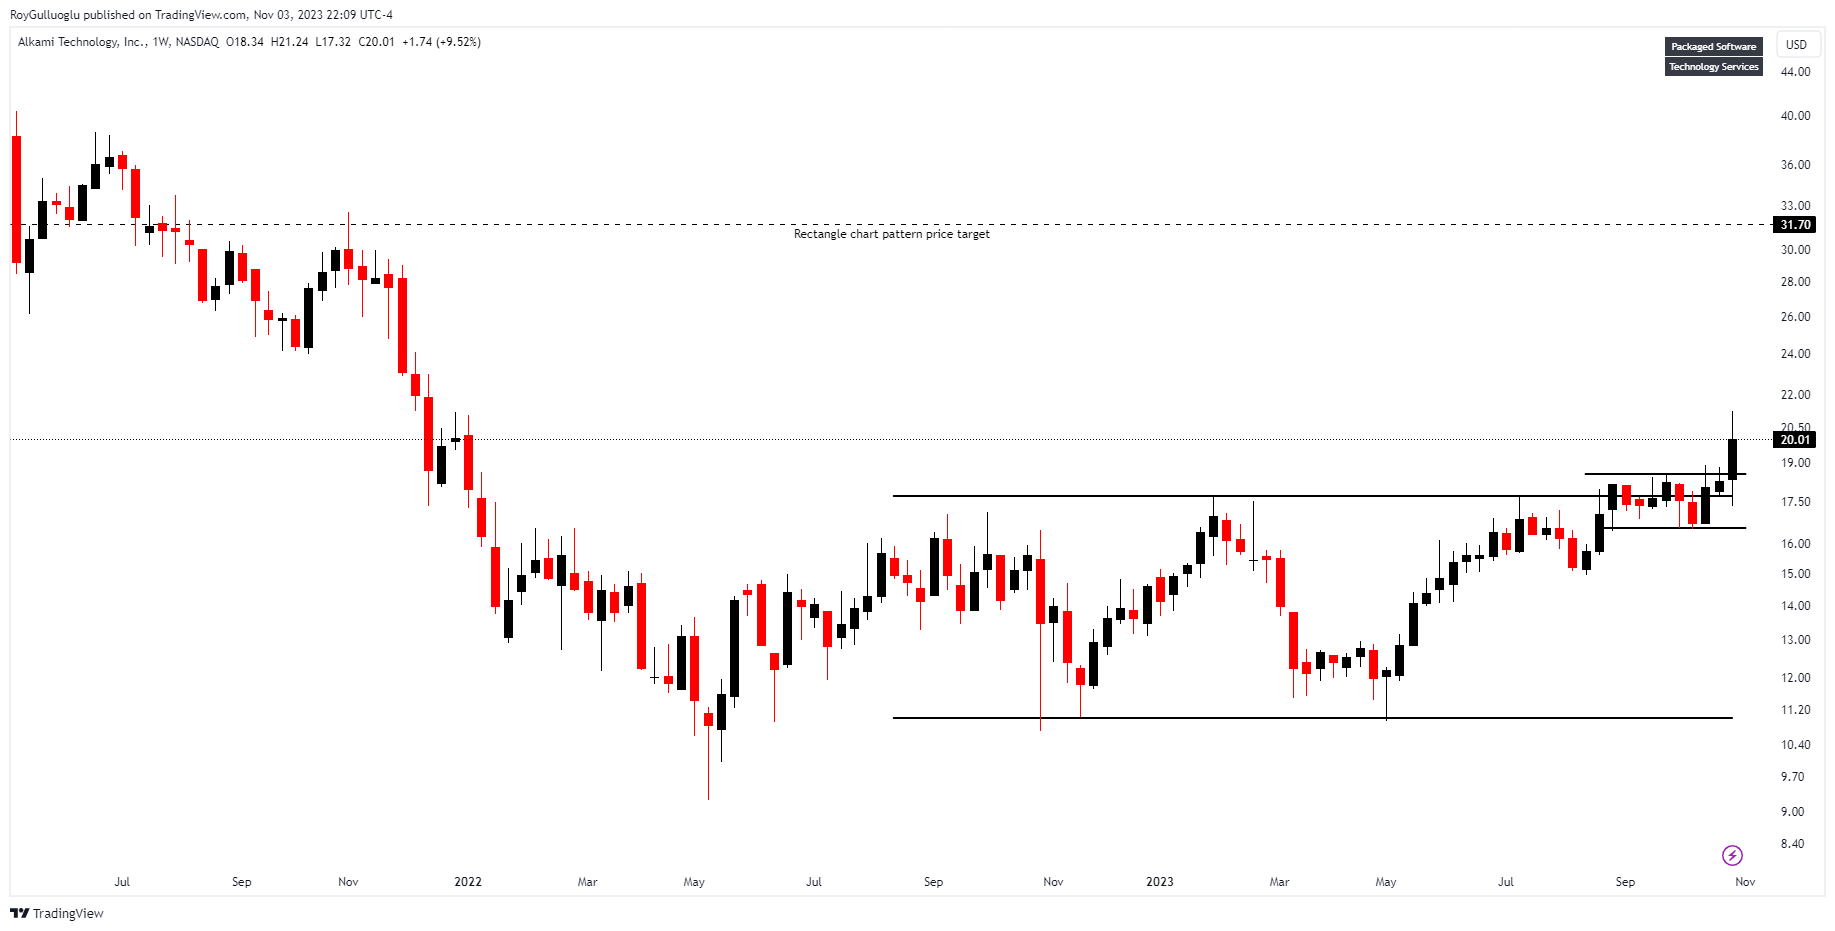
You can click the ALKT ticker above to access the first report explaining the RATIONALE behind the trade idea.
Empire Co Ltd-(EMP.A/TSX) - Long Idea
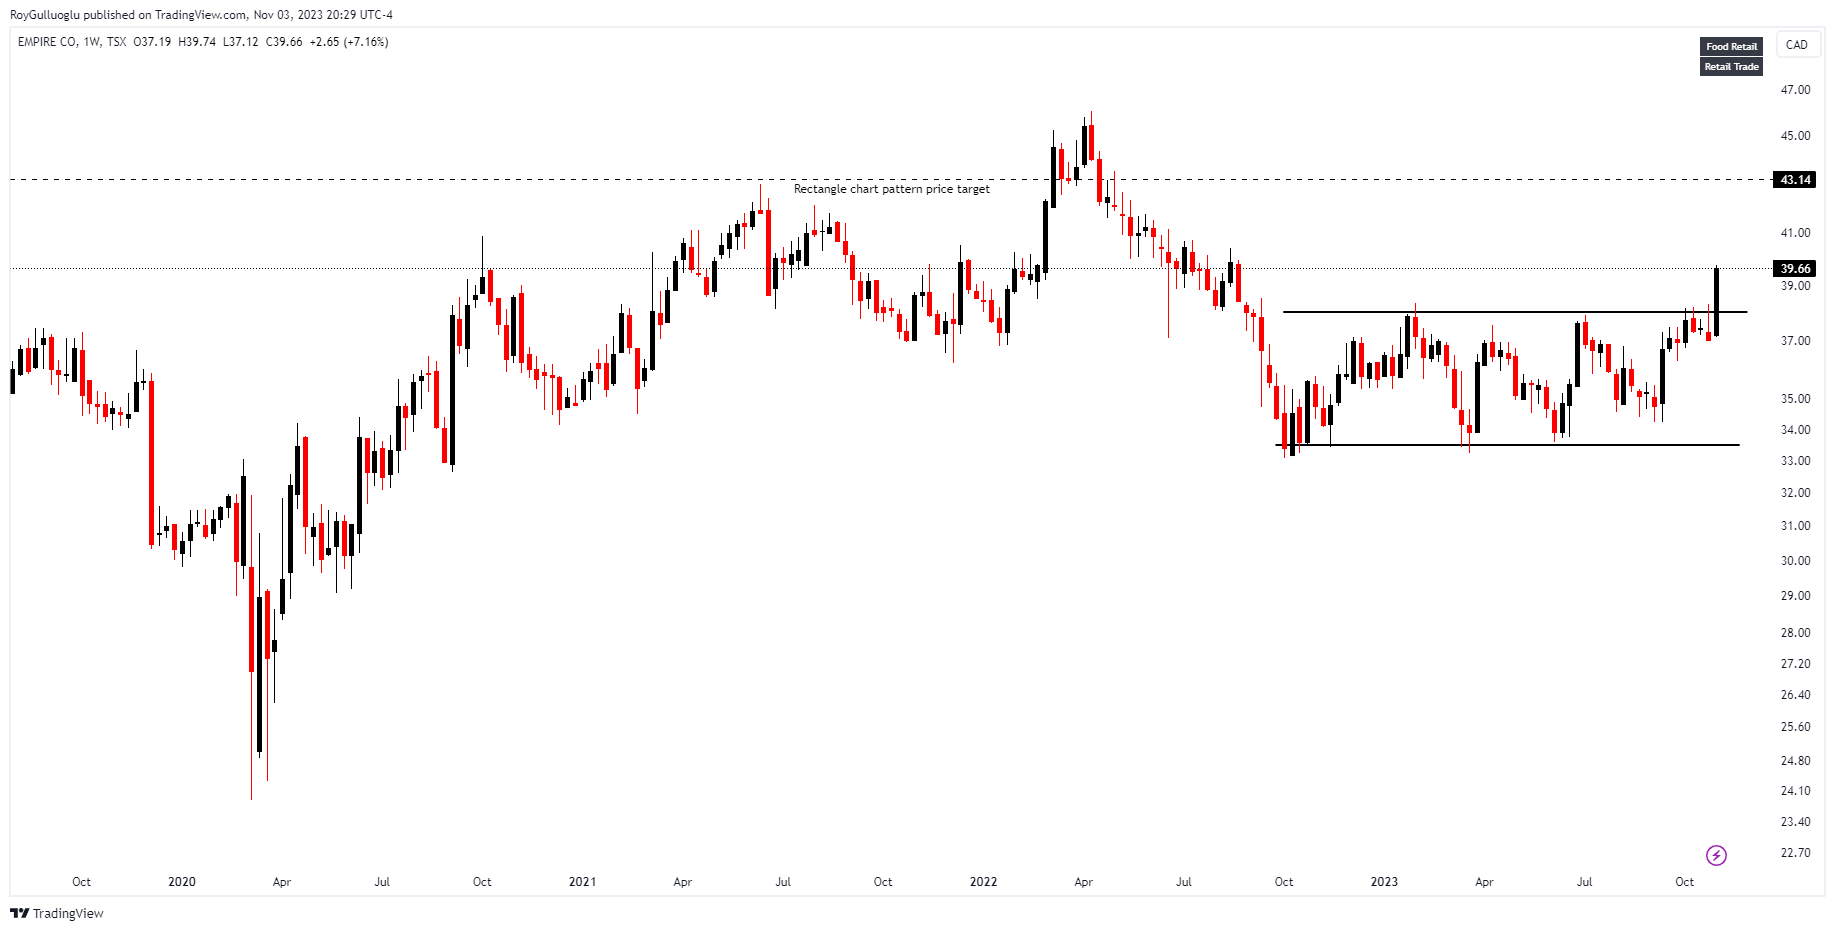
You can click the EMP.A ticker above to access the first report explaining the RATIONALE behind the trade idea.
Aeon Hokkaido Corp-(7512/TSE)-Long/Short Idea
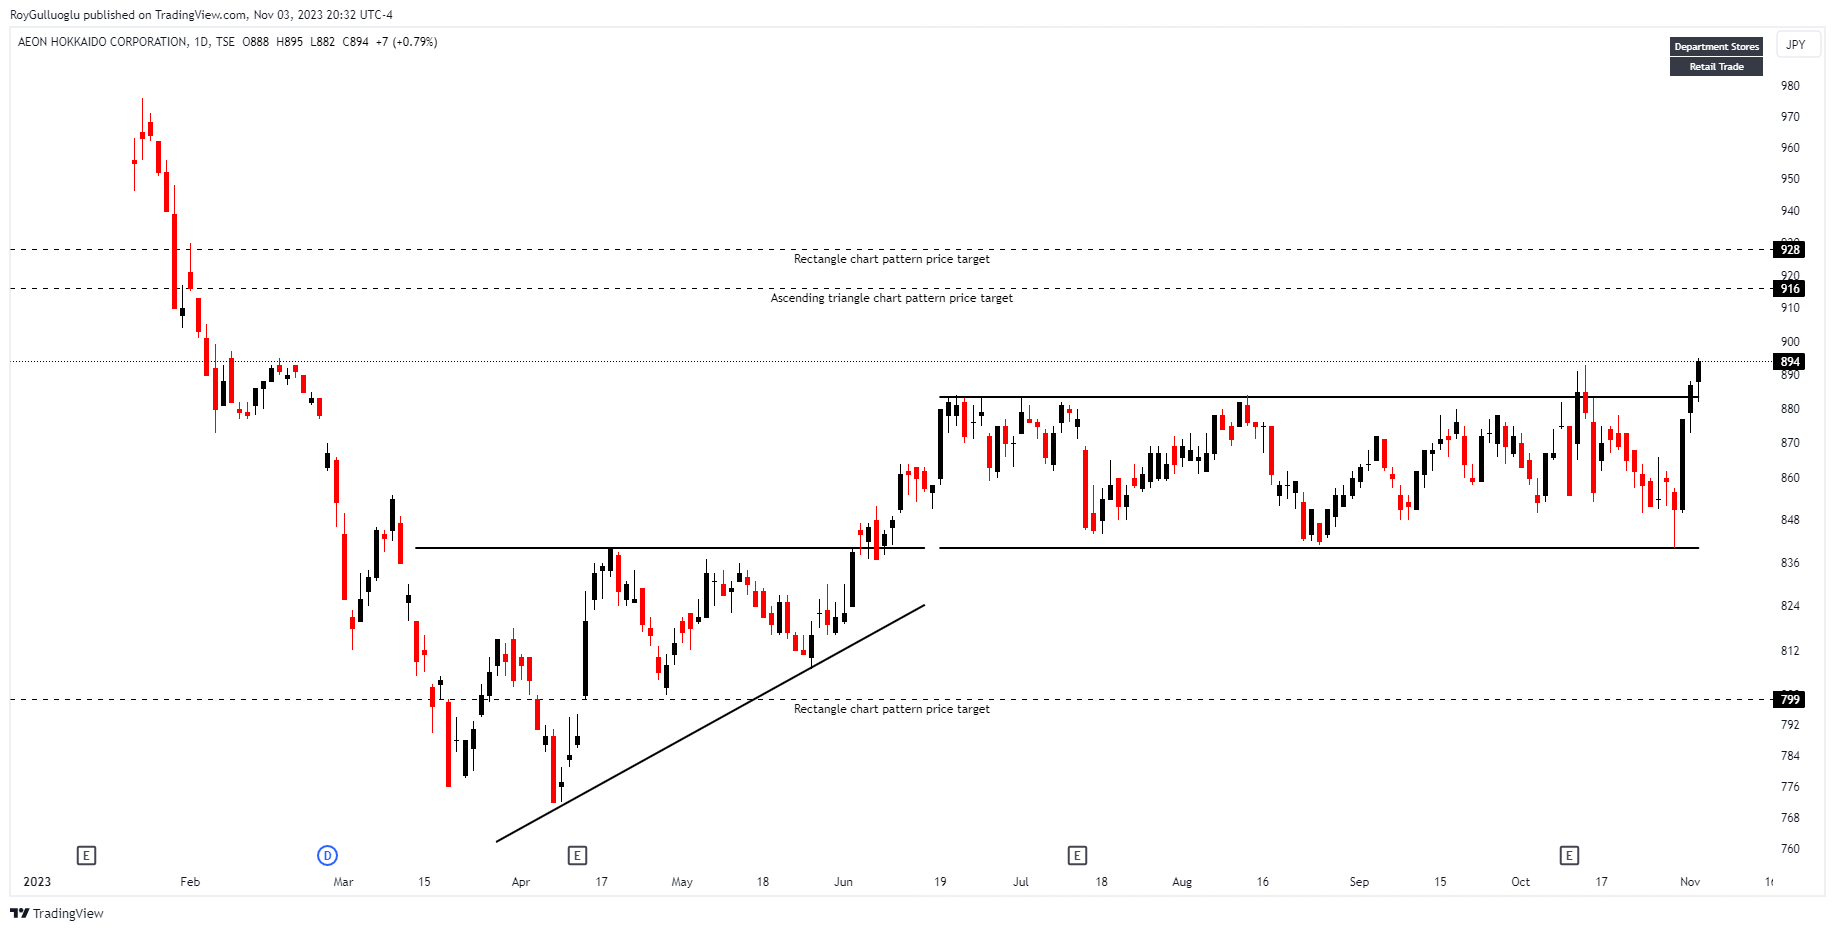
You can click the 7512 ticker above to access the first report explaining the RATIONALE behind the trade idea.
Share India Securities Ltd-(SHAREINDIA/NSE)-Long Idea
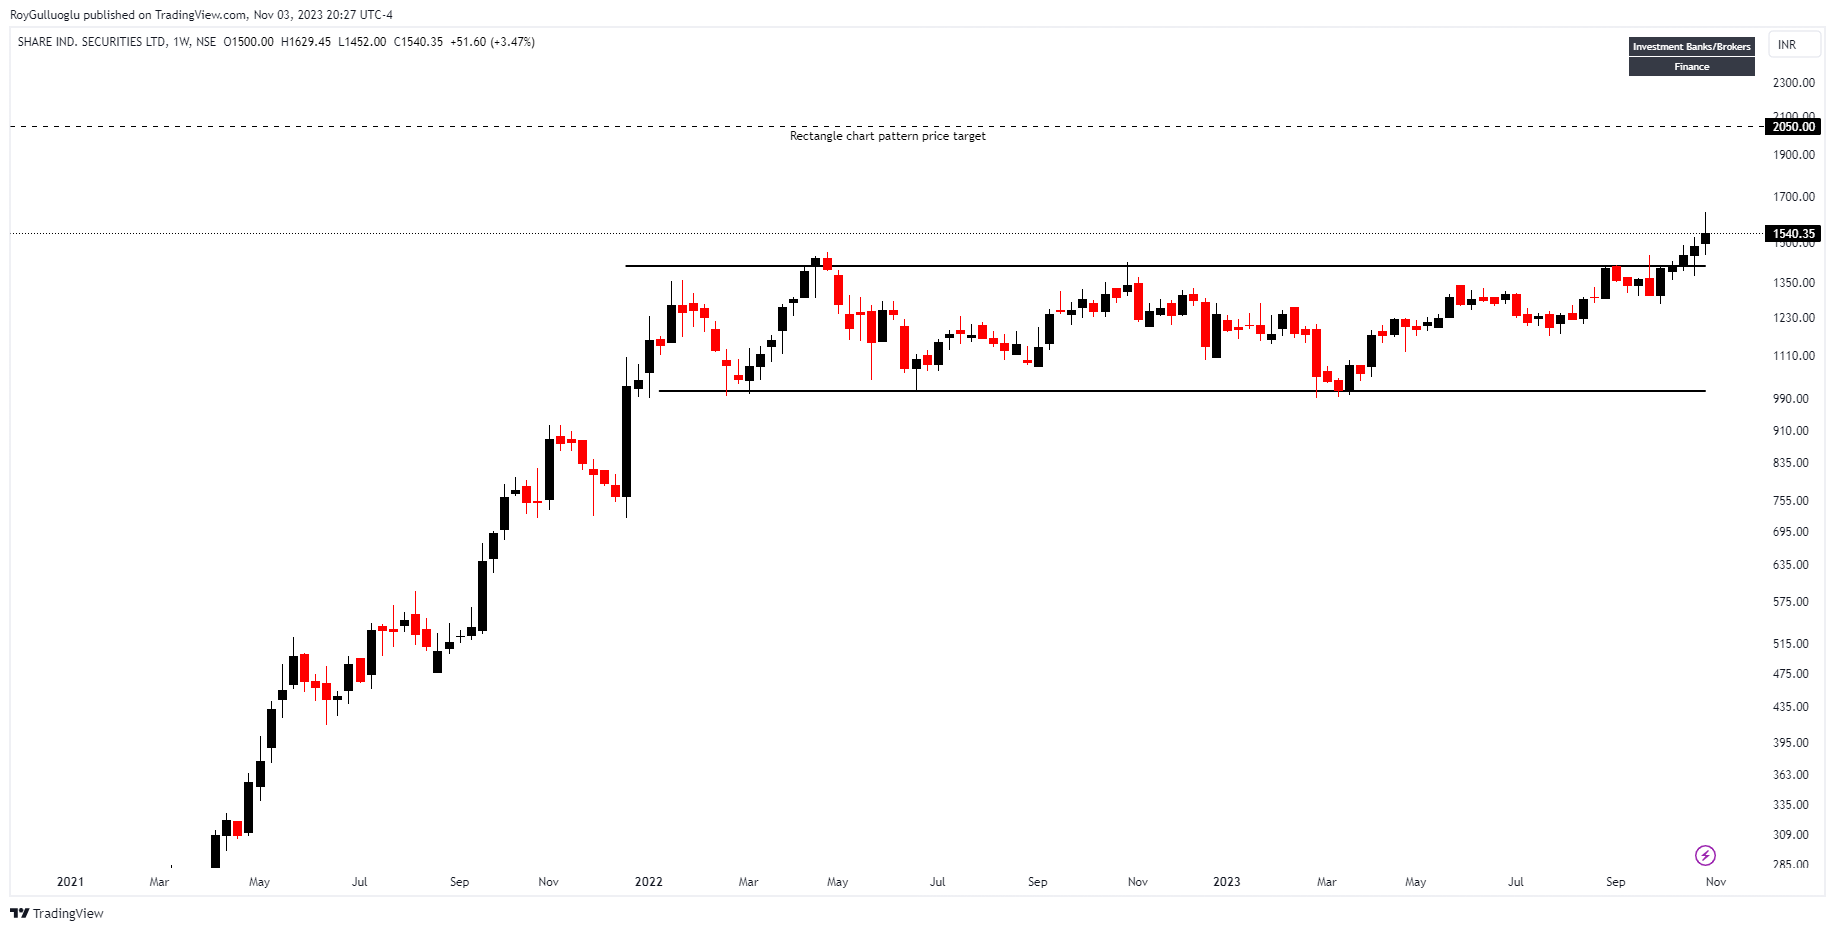
You can click the SHAREINDIA ticker above to access the first report explaining the RATIONALE behind the trade idea.
Anadolu Efes-(AEFES/BIST)-Long Idea
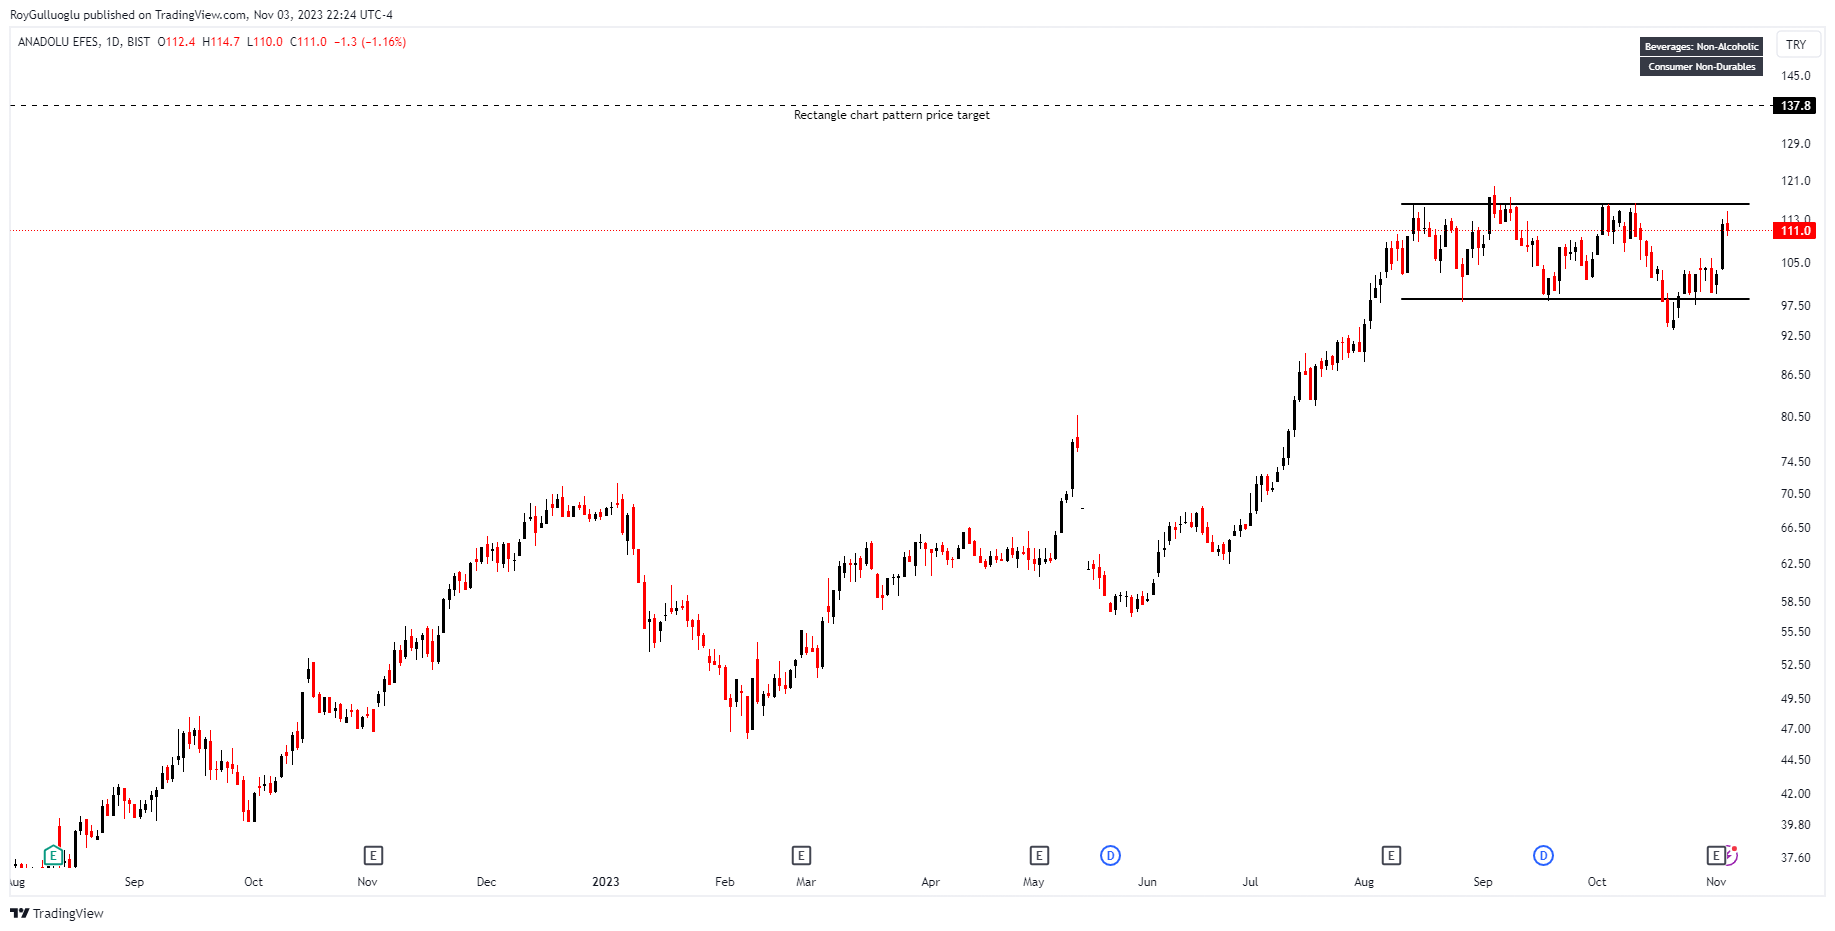
You can click the AEFES ticker above to access the first report explaining the RATIONALE behind the trade idea.