


TE Connectivity plc-(TEL/NYSE)-Long Idea
TE Connectivity plc, together with its subsidiaries, manufactures and sells connectivity and sensor solutions in Europe, the Middle East, Africa, the Asia&Pacific, and the Americas.
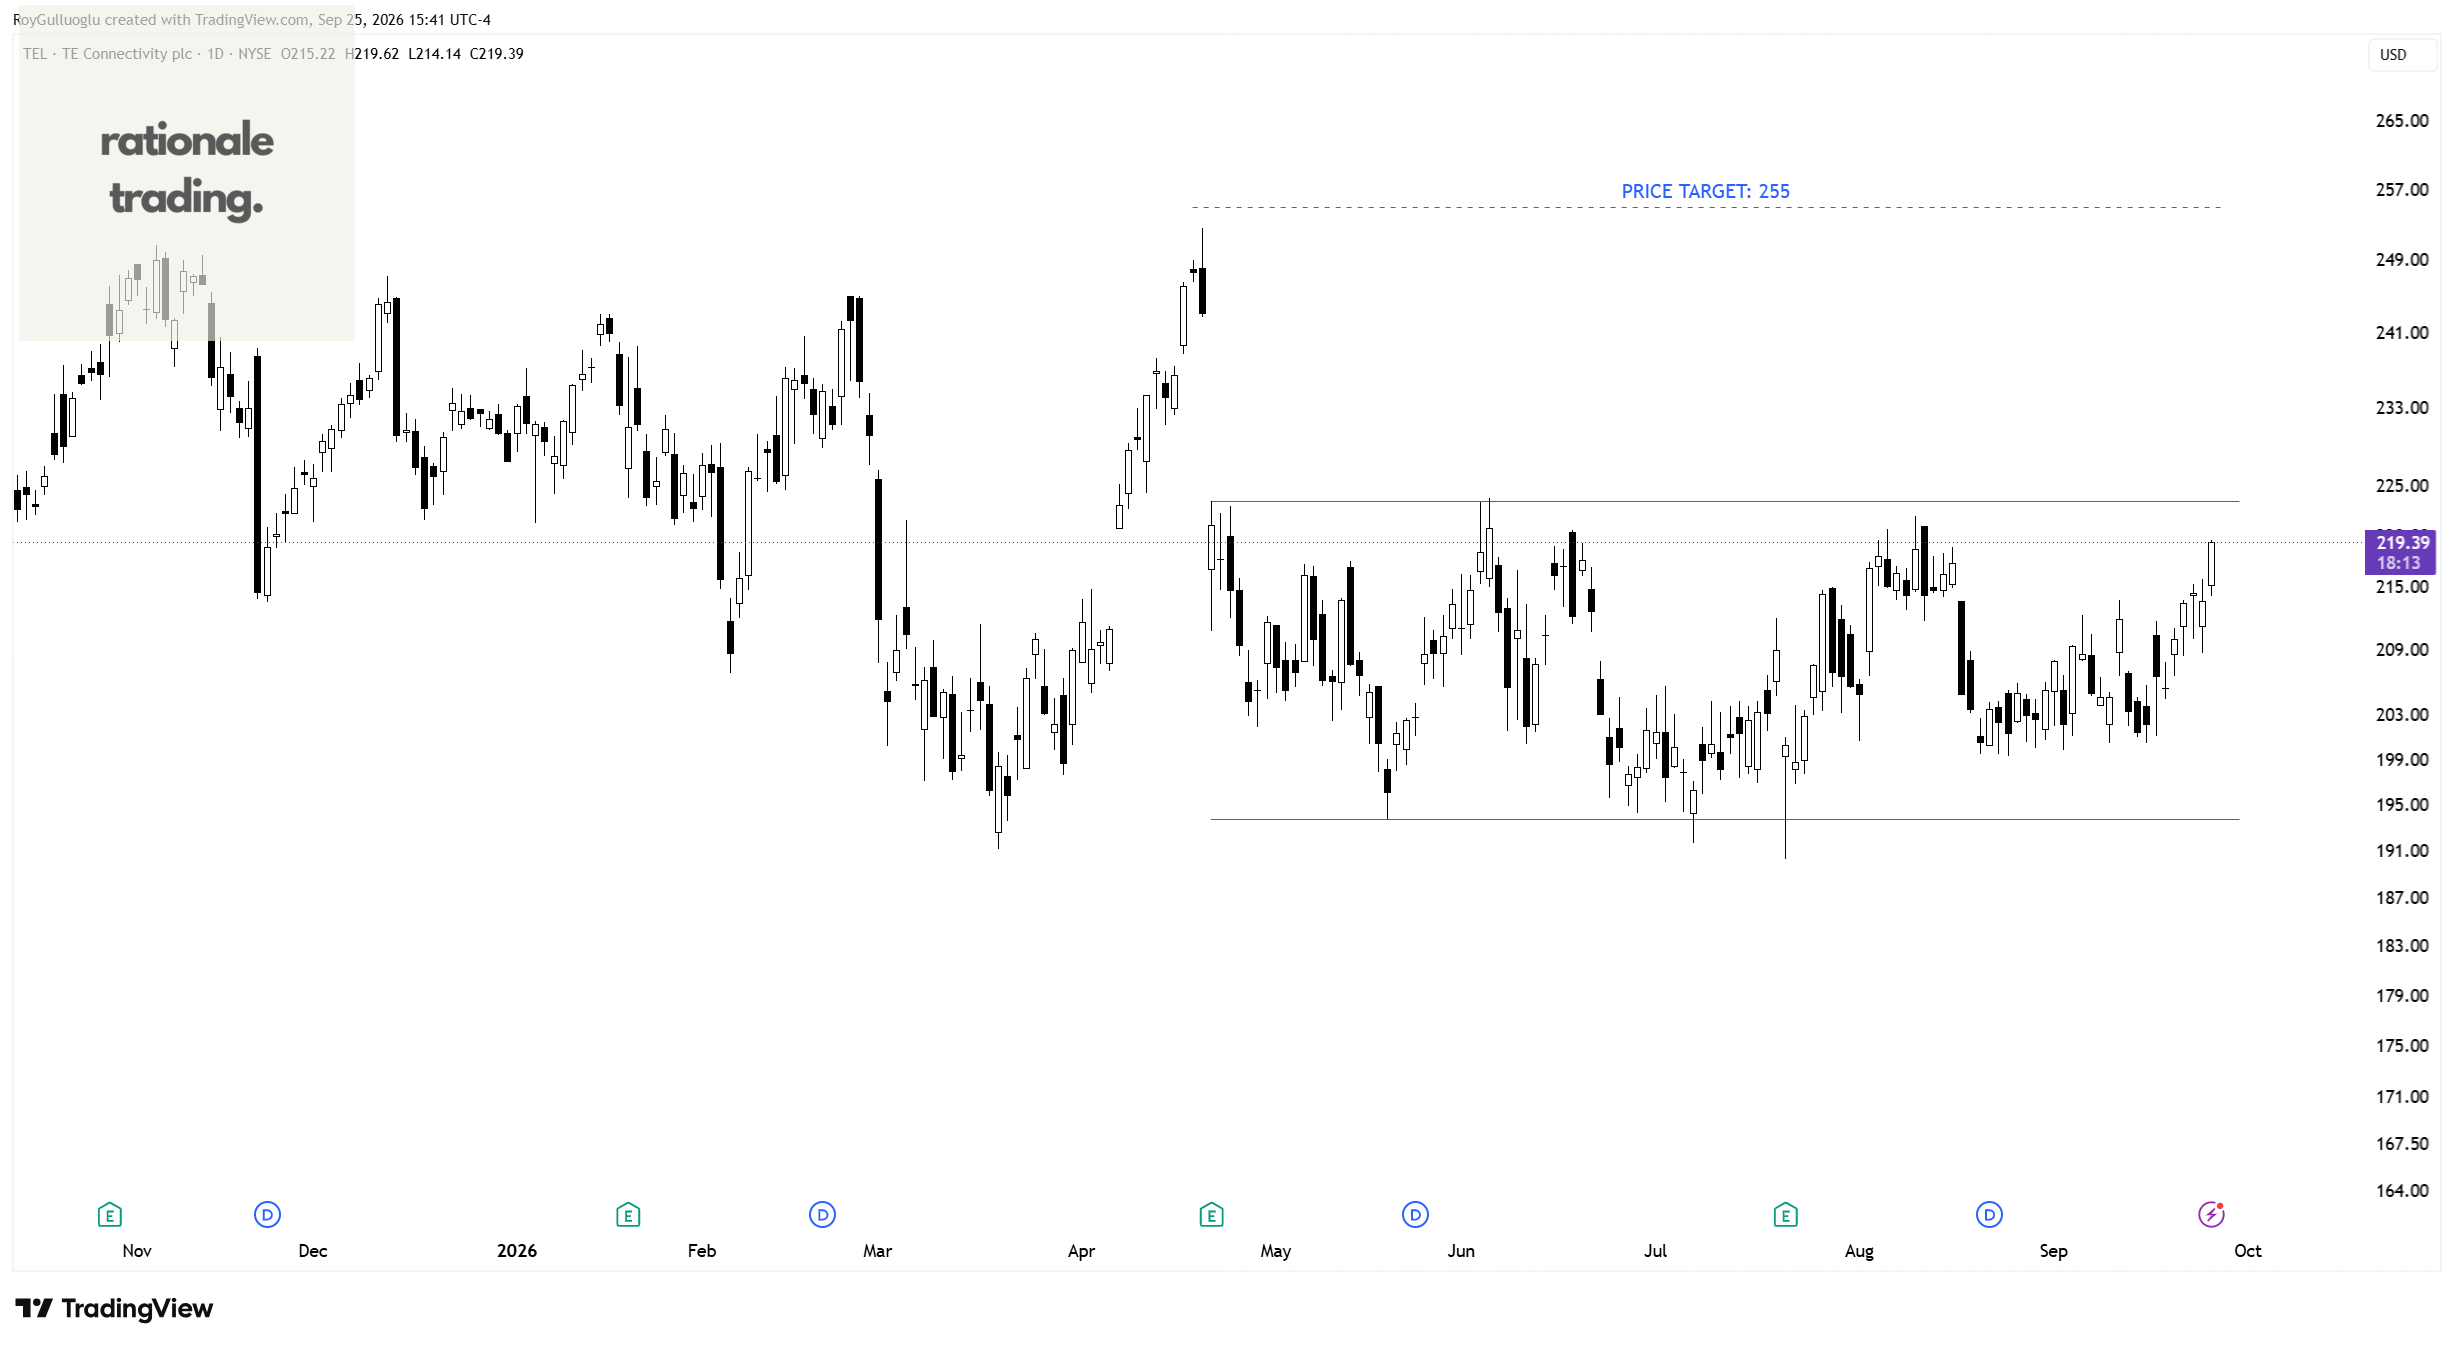
The above daily chart formed an approximately 4-month-long rectangle chart pattern as a bullish reversal after a downtrend.
Within this pattern, the horizontal boundary at 223.5 levels acts as a resistance.
A daily close above 230 levels would validate the breakout from the 4-month-long rectangle chart pattern.
Based on this chart pattern, the potential price target is 255 levels.
Silicom Ltd.-(SILC/NASDAQ)-Long Idea
Silicom Ltd. designs, manufactures, markets, and supports networking and data infrastructure solutions in the United States, North America, Israel, Europe, and the Asia Pacific.
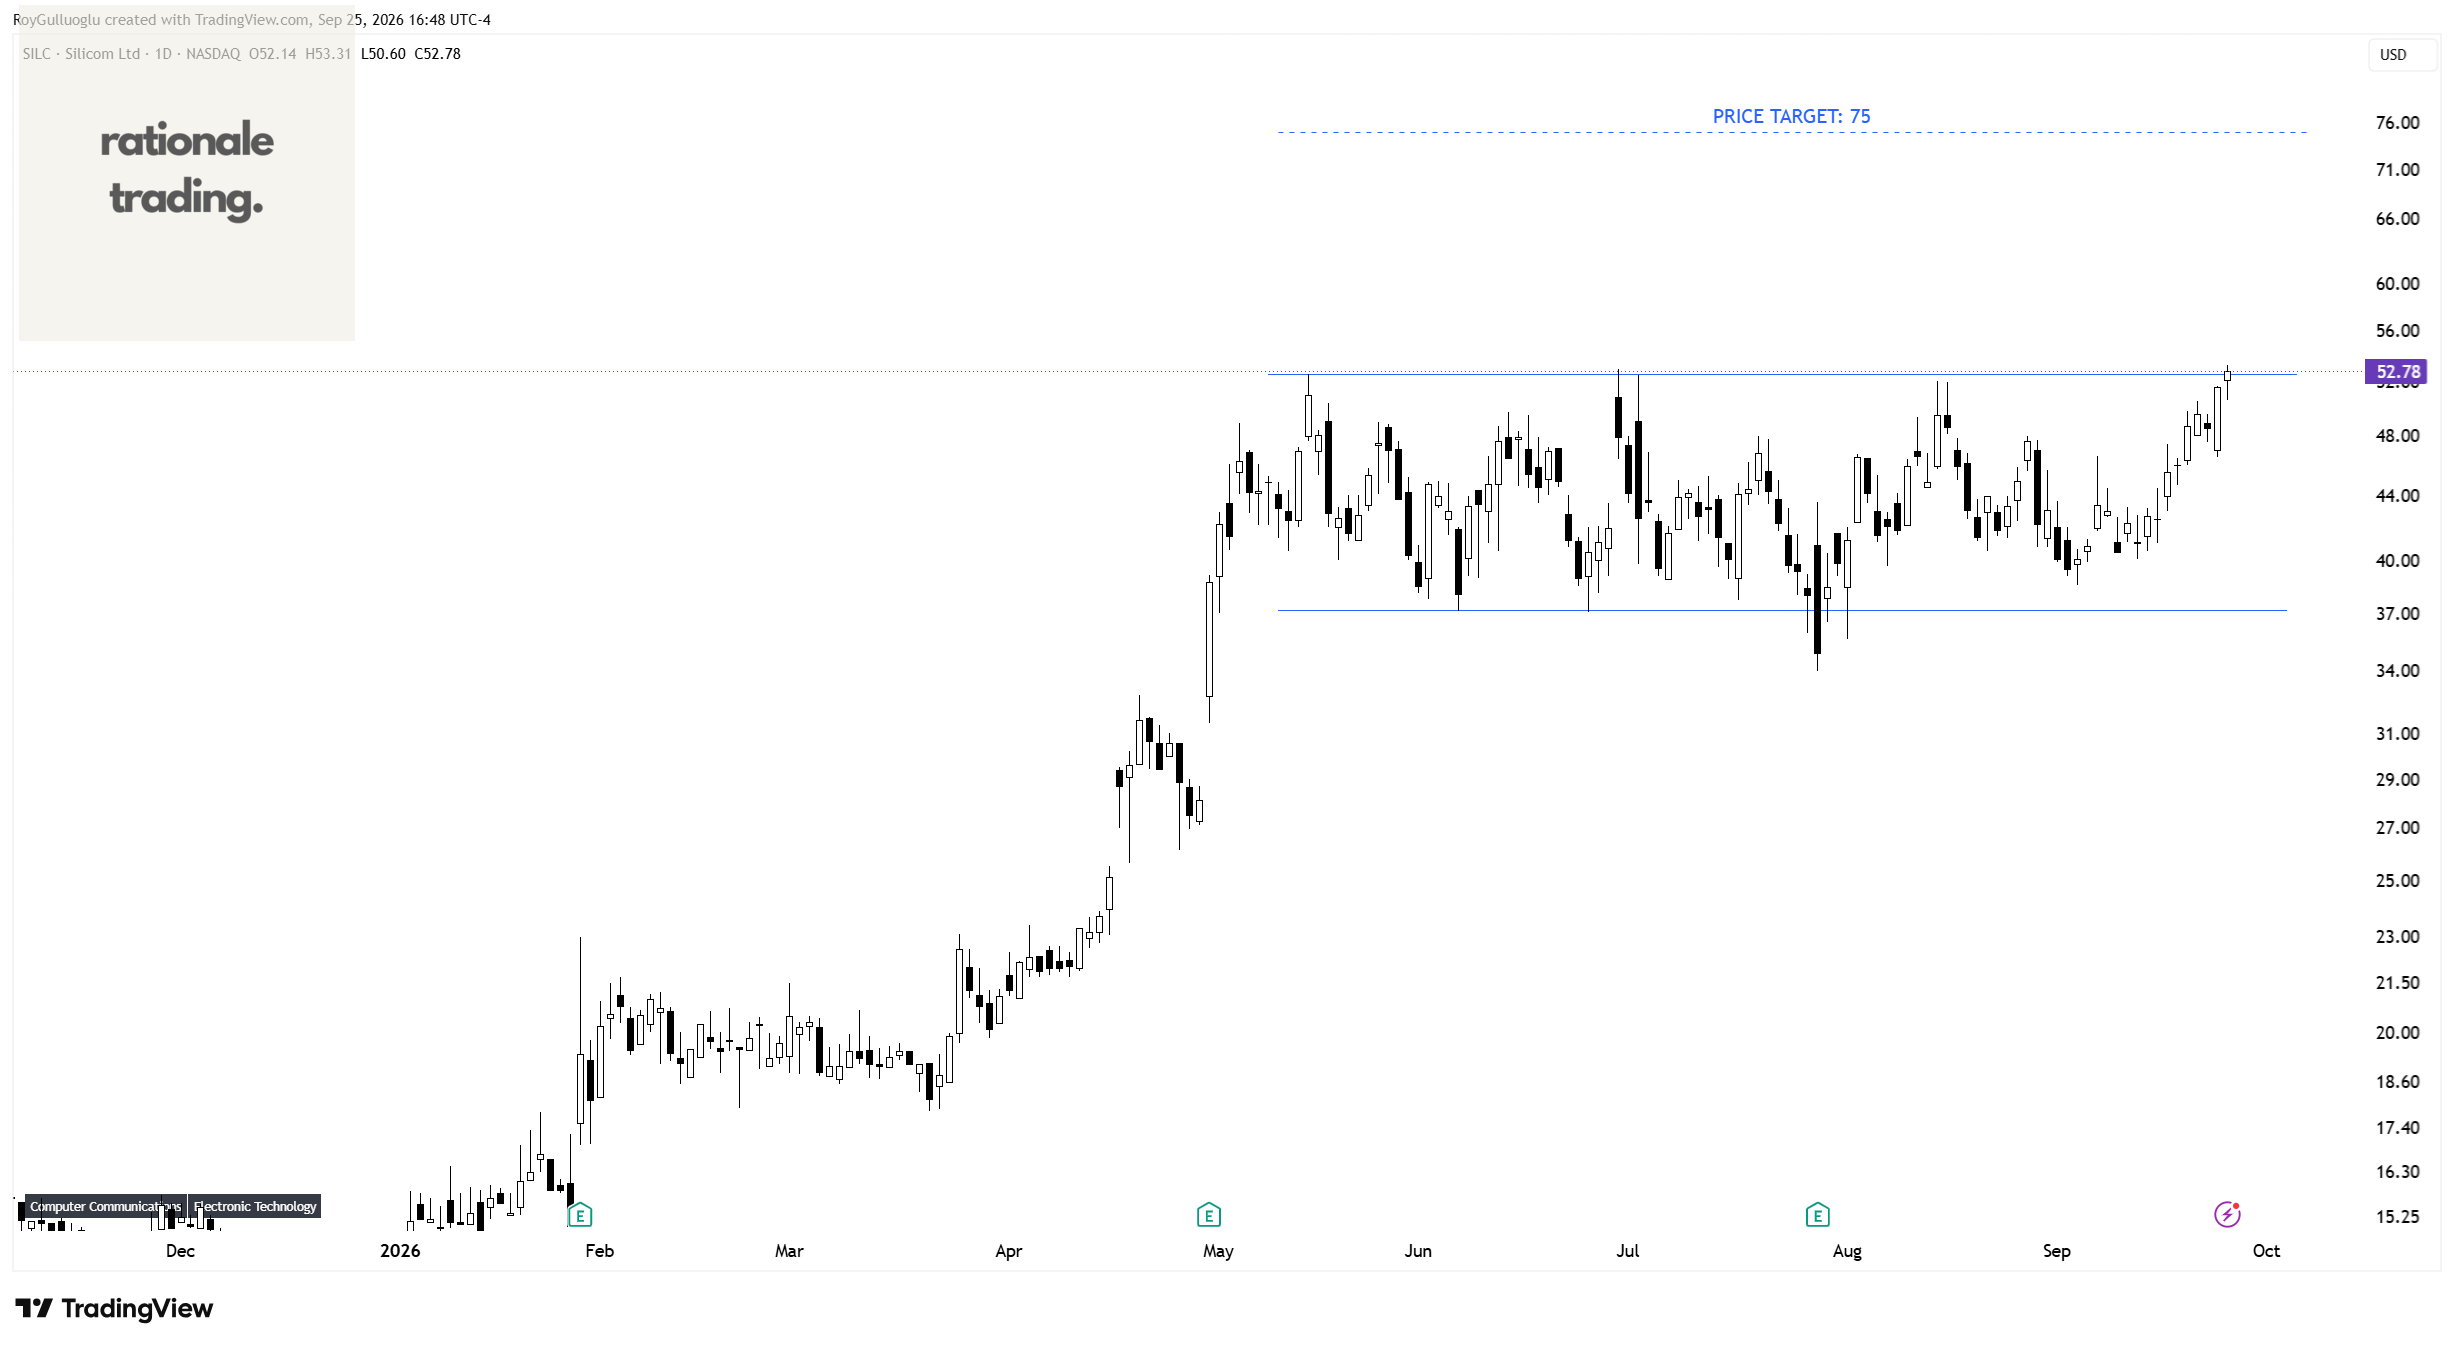
The above daily chart formed an approximately 3-month-long rectangle chart pattern as a bullish continuation after an uptrend.
Within this pattern, the horizontal boundary at 52.58 levels acts as a resistance.
A daily close above 54.15 levels would validate the breakout from the 3-month-long rectangle chart pattern.
Based on this chart pattern, the potential price target is 75 levels.
Embraer S.A.-(EMBJ/NYSE)-Long Idea
Embraer S.A., together with its subsidiaries, engages in the design, development, manufacture, and sale of aircraft and systems worldwide.
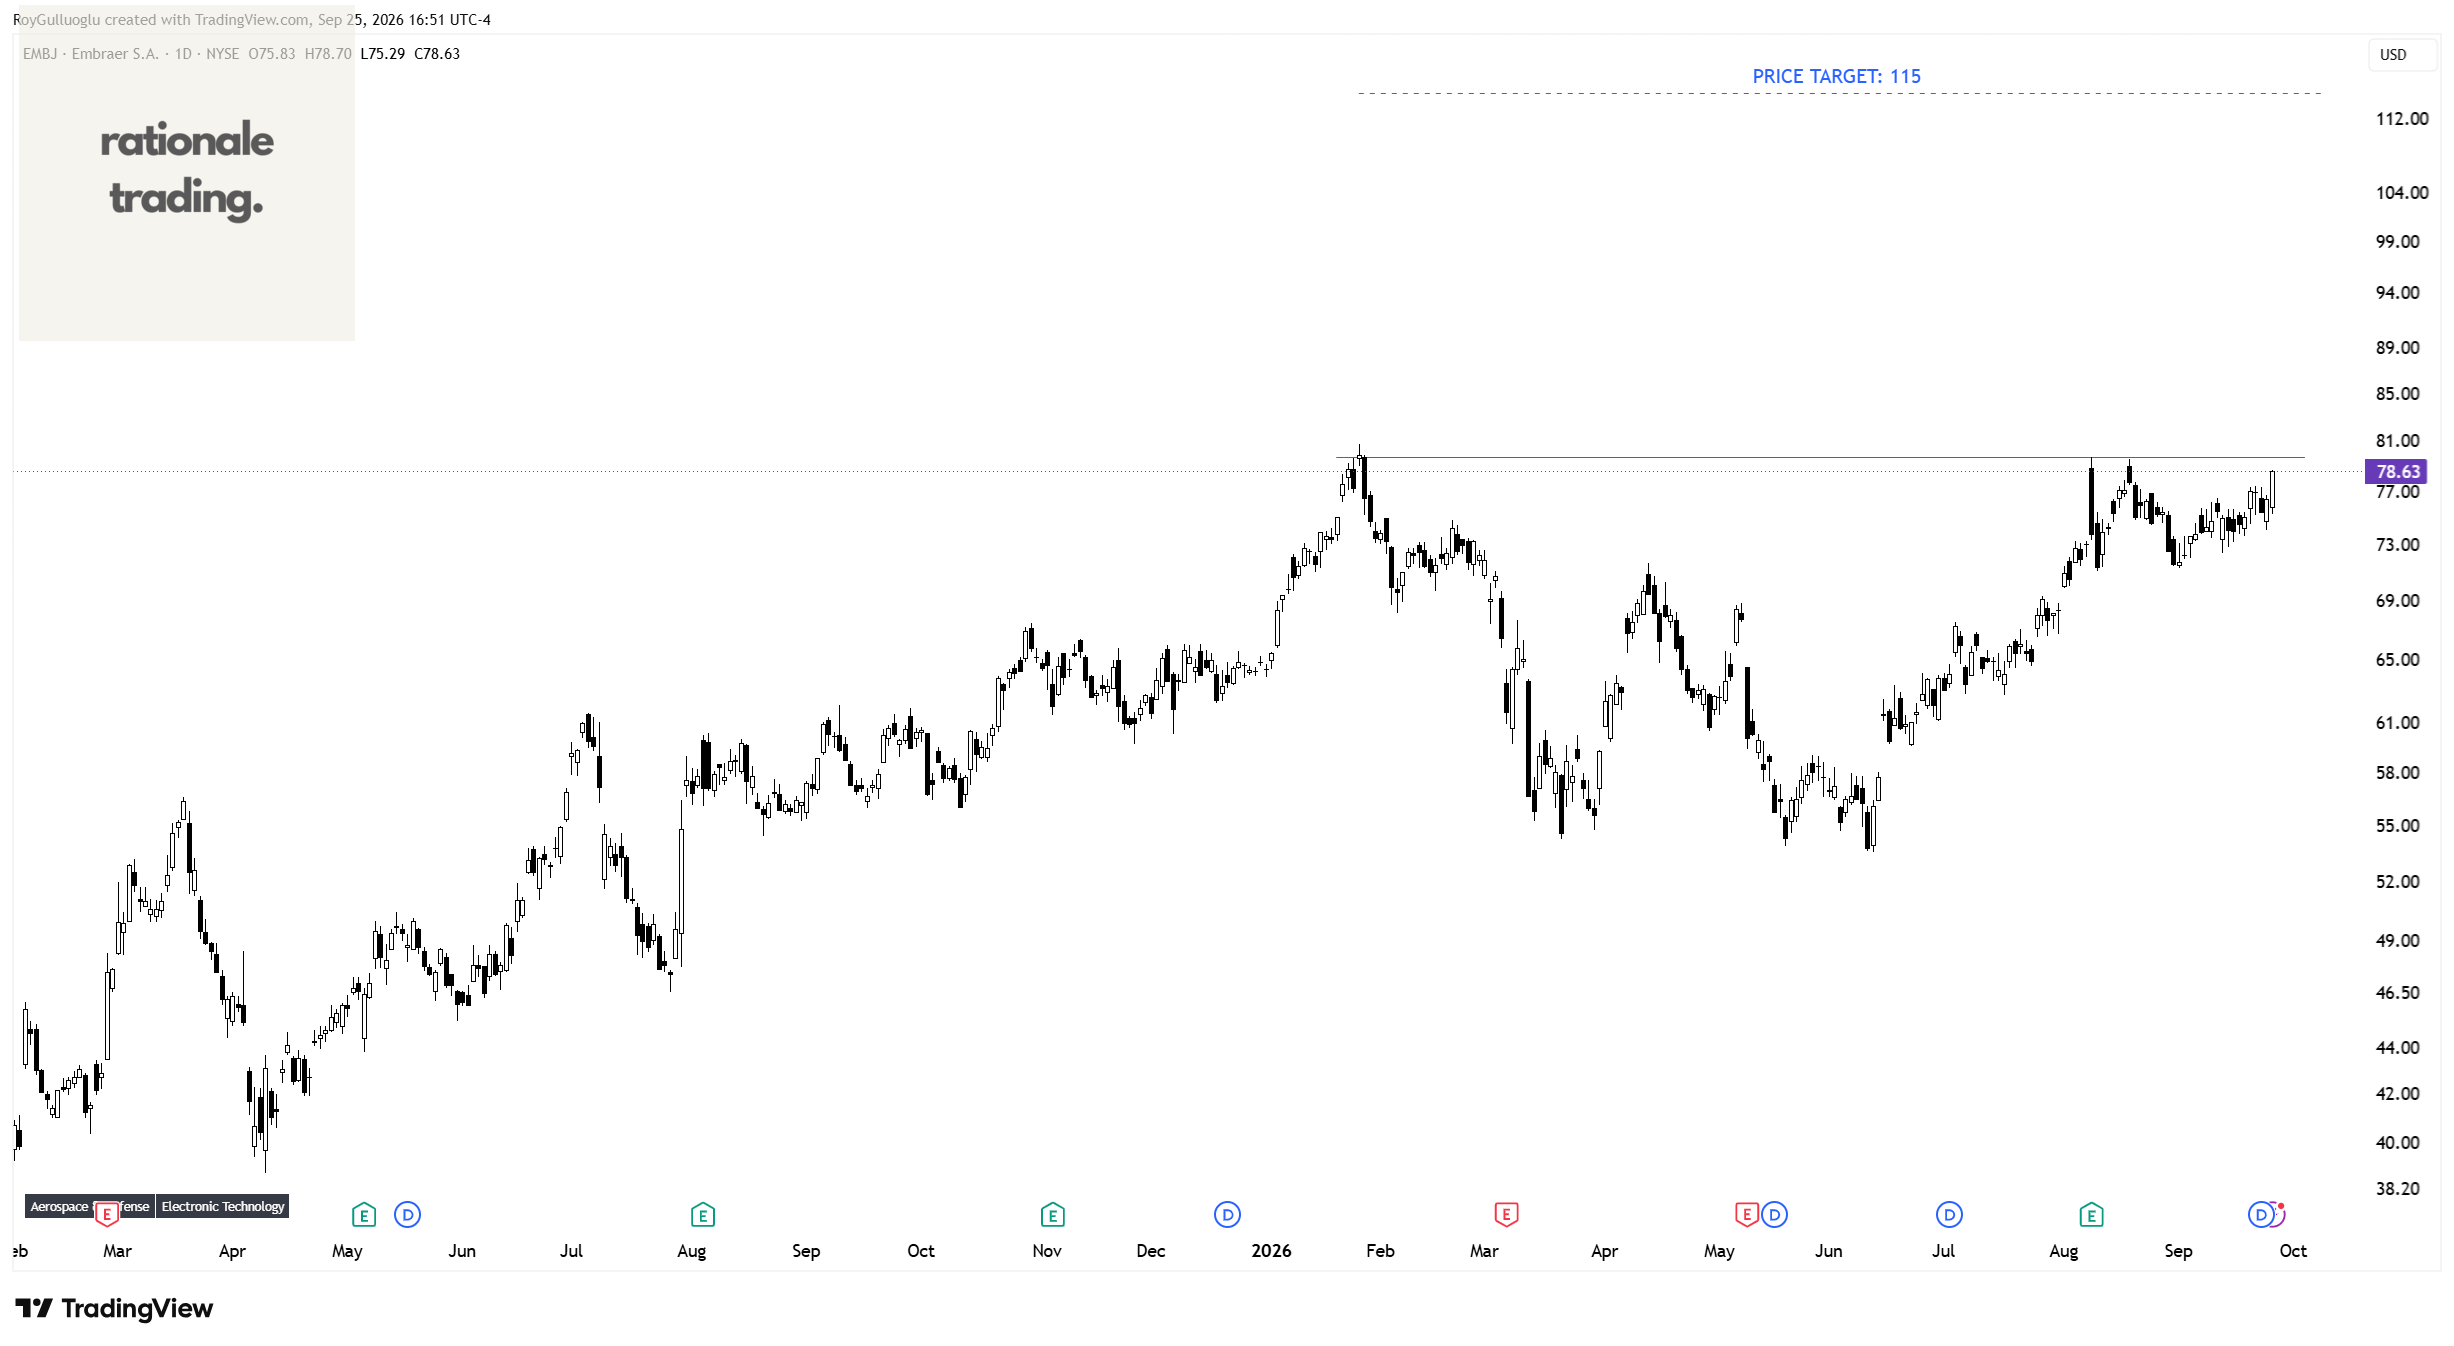
The above daily chart formed an approximately 5-month-long cup & handle chart pattern as a bullish continuation after an uptrend.
Within this pattern, the horizontal boundary at 79.76 levels acts as a resistance.
A daily close above 82.15 levels would validate the breakout from the 5-month-long cup & handle chart pattern.
Based on this chart pattern, the potential price target is 115 levels.
Enerflex Ltd.-(EFXT/NYSE)-Long Idea
Enerflex Ltd. offers modular natural gas, power technology, and treated water solutions in North America, Latin America, and the Eastern Hemisphere.
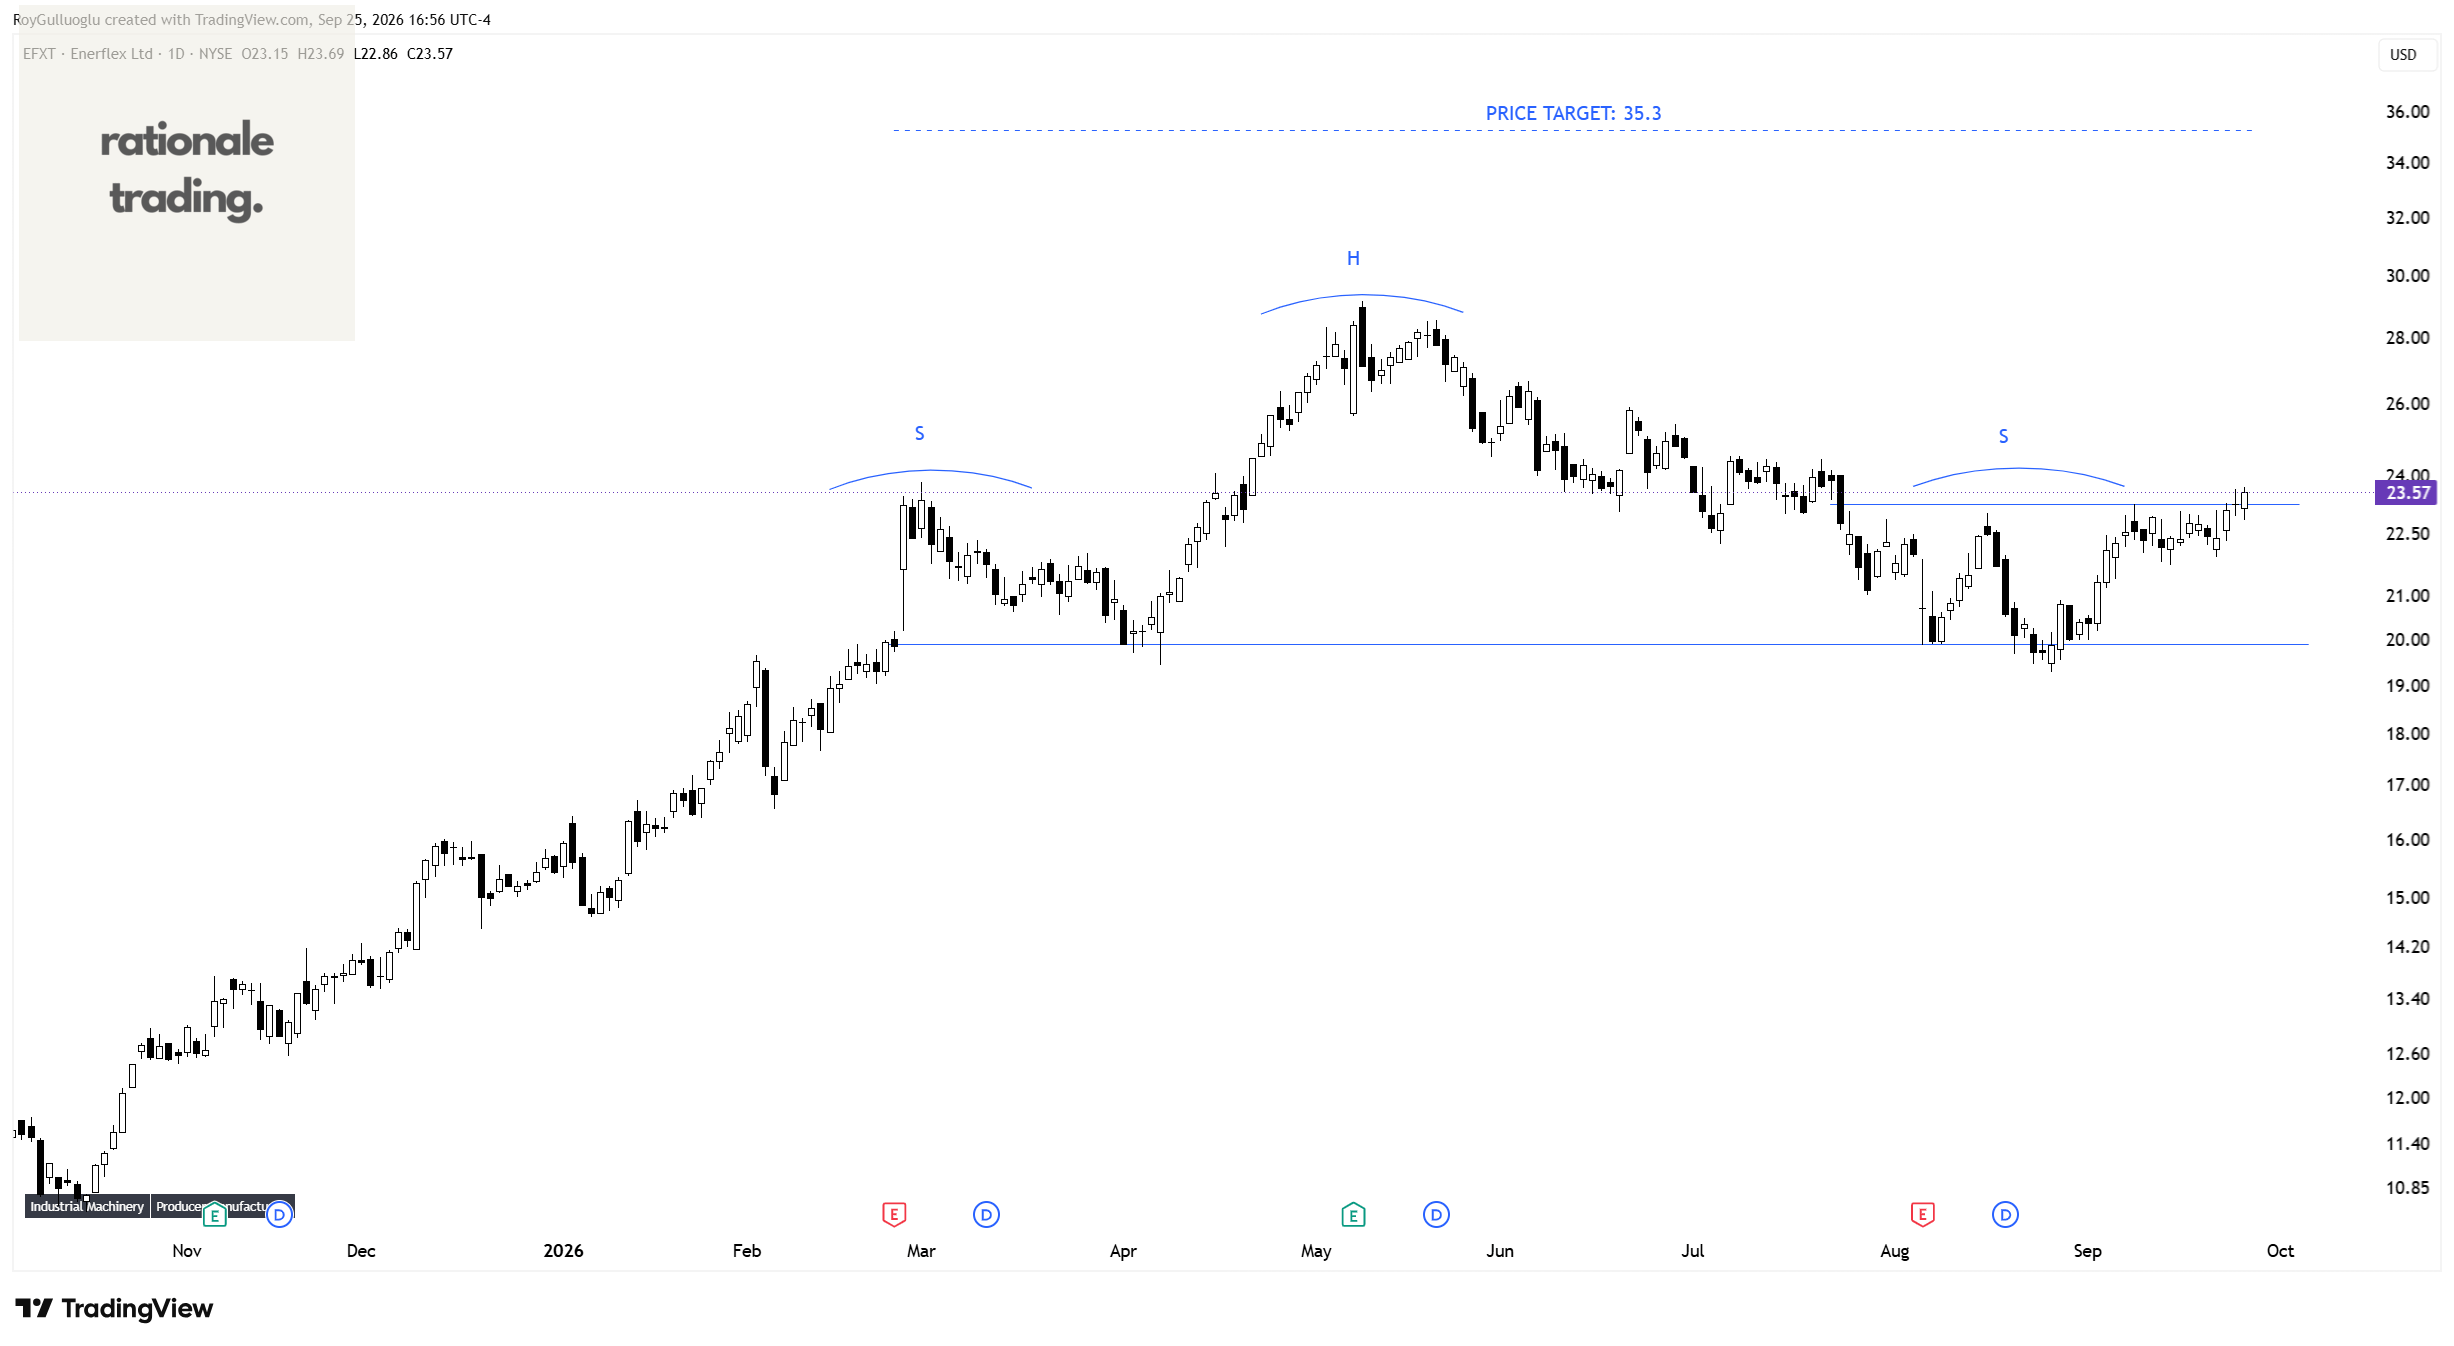
The above daily chart formed an approximately 5-month-long H&S top failure chart pattern as a bullish continuation after an uptrend.
Within this pattern, the horizontal boundary at 23.26 levels acts as a resistance.
A daily close above 23.95 levels would validate the breakout from the 5-month-long H&S top failure chart pattern.
Based on this chart pattern, the potential price target is 35.3 levels.
Medpace Holdings, Inc.-(MEDP/NASDAQ)-Long Idea
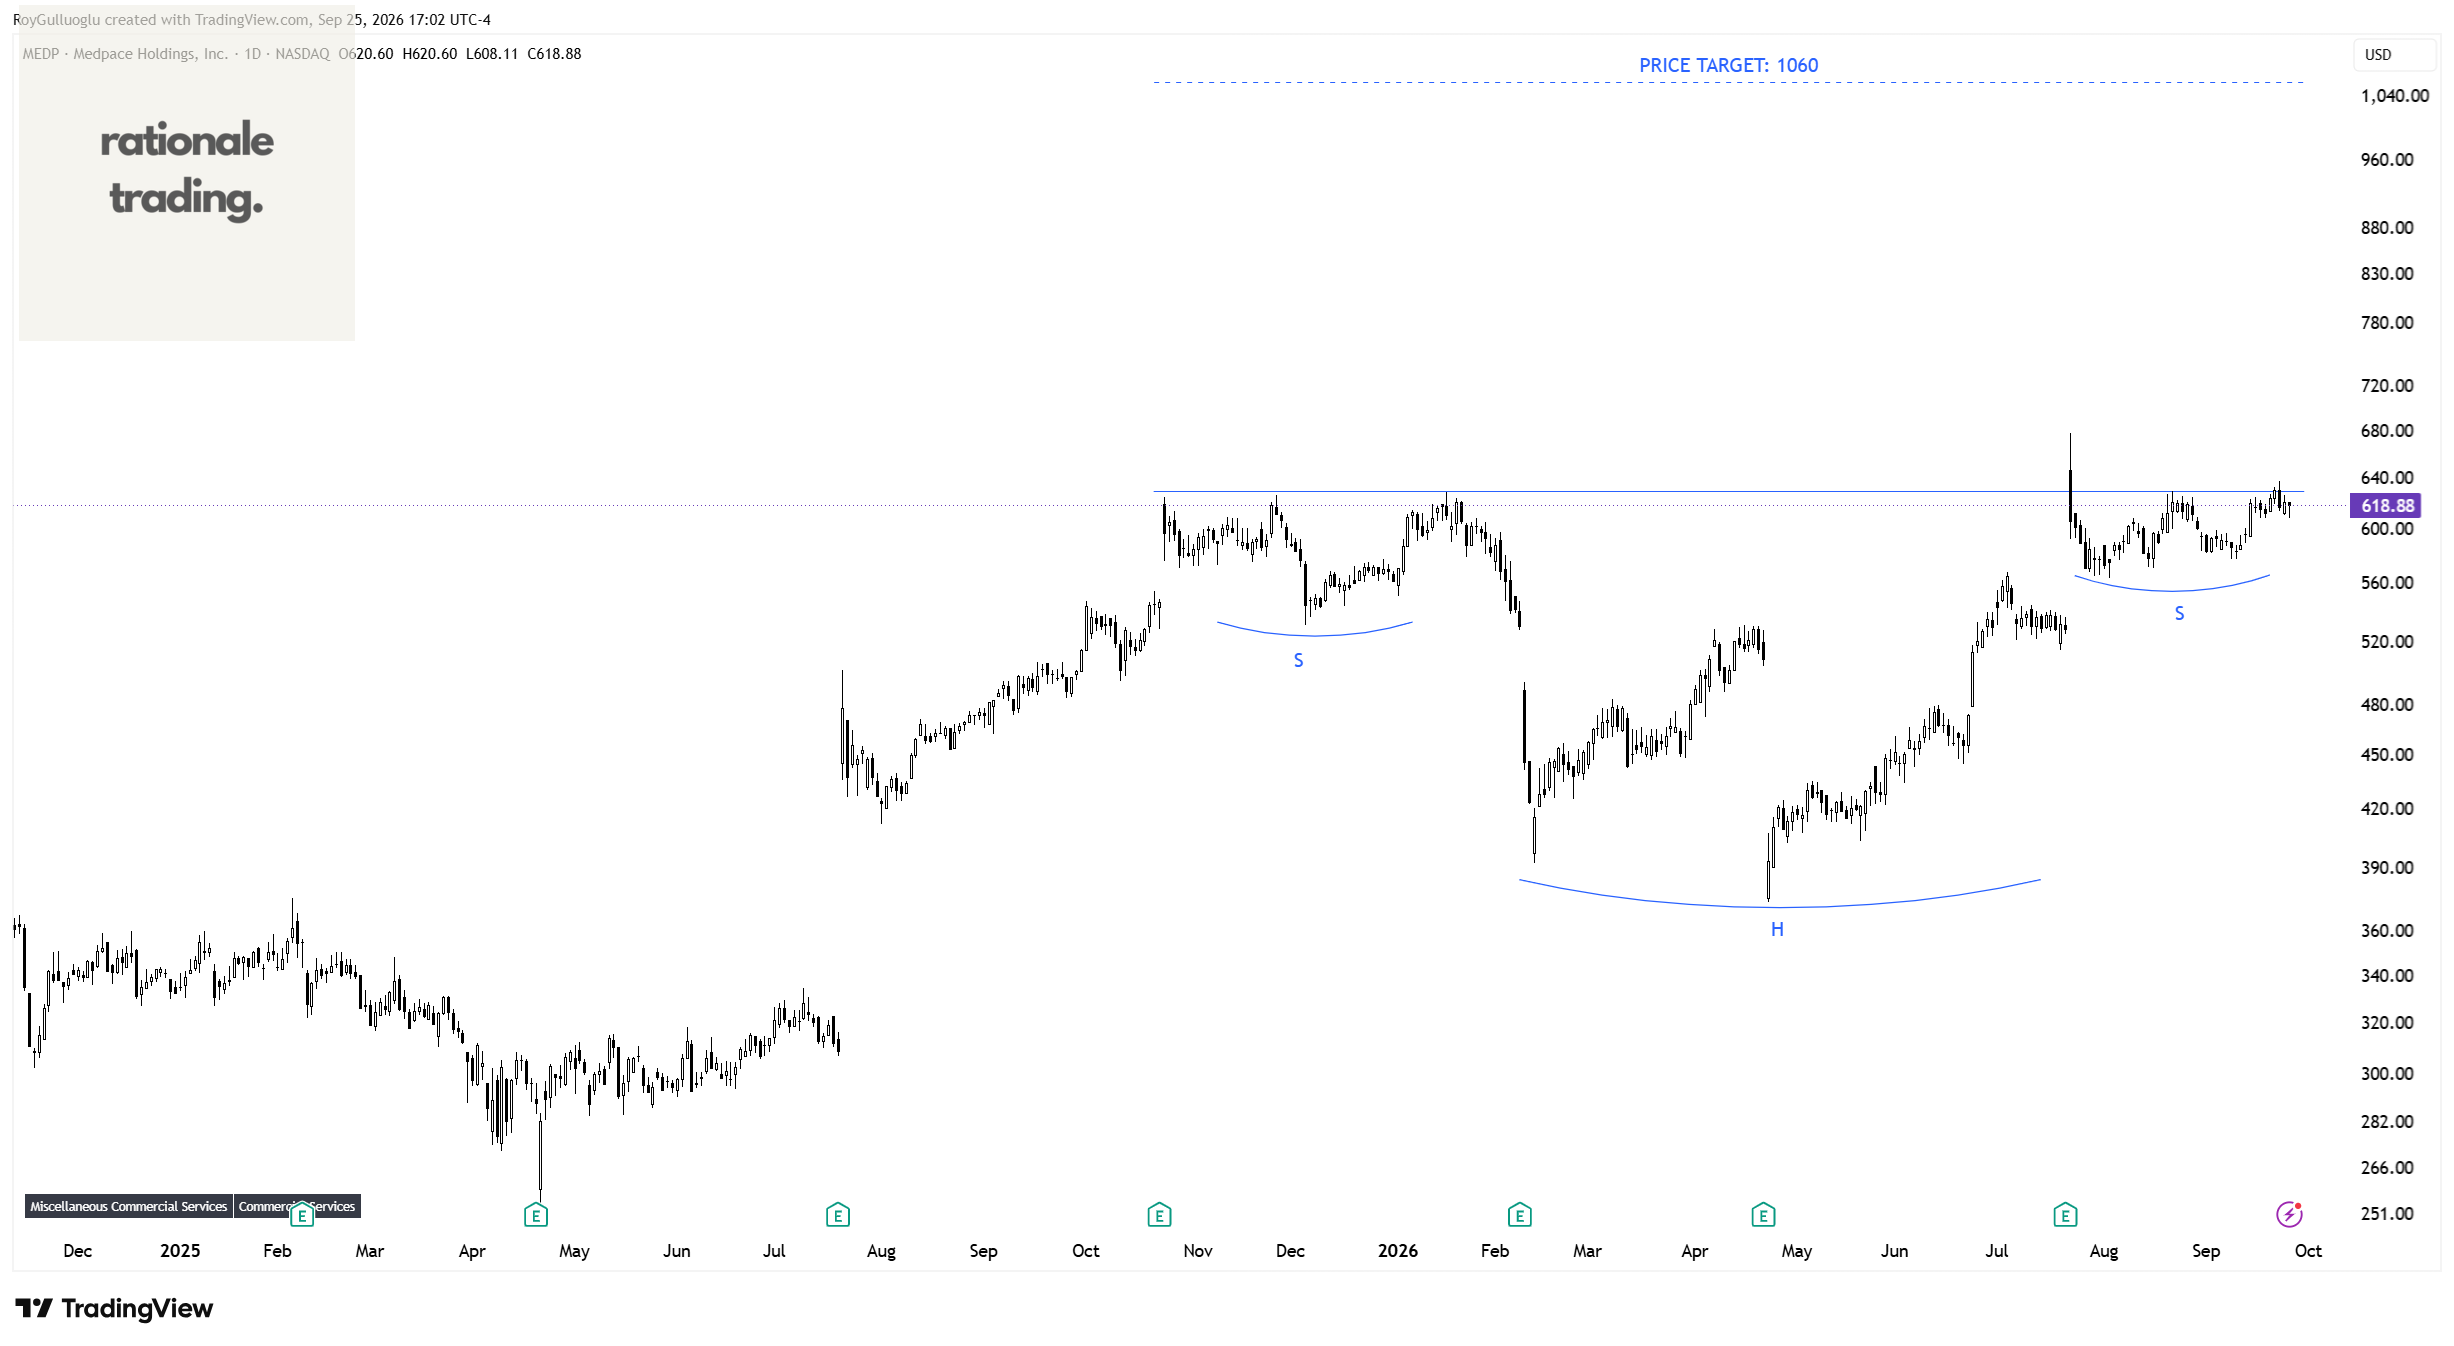
Medpace Holdings, Inc. provides clinical research-based drug and medical device development services in North America, Europe, Asia, South America, Africa, and Australia.
The above daily chart formed an approximately 7-month-long H&S continuation chart pattern as a bullish continuation after an uptrend.
Within this pattern, the horizontal boundary at 629.69 levels acts as a resistance.
A daily close above 648.5 levels would validate the breakout from the 7-month-long H&S continuation chart pattern.
Based on this chart pattern, the potential price target is 1060 levels.
Recursion Pharmaceuticals, Inc.-(RXRX/NASDAQ)-Long Idea
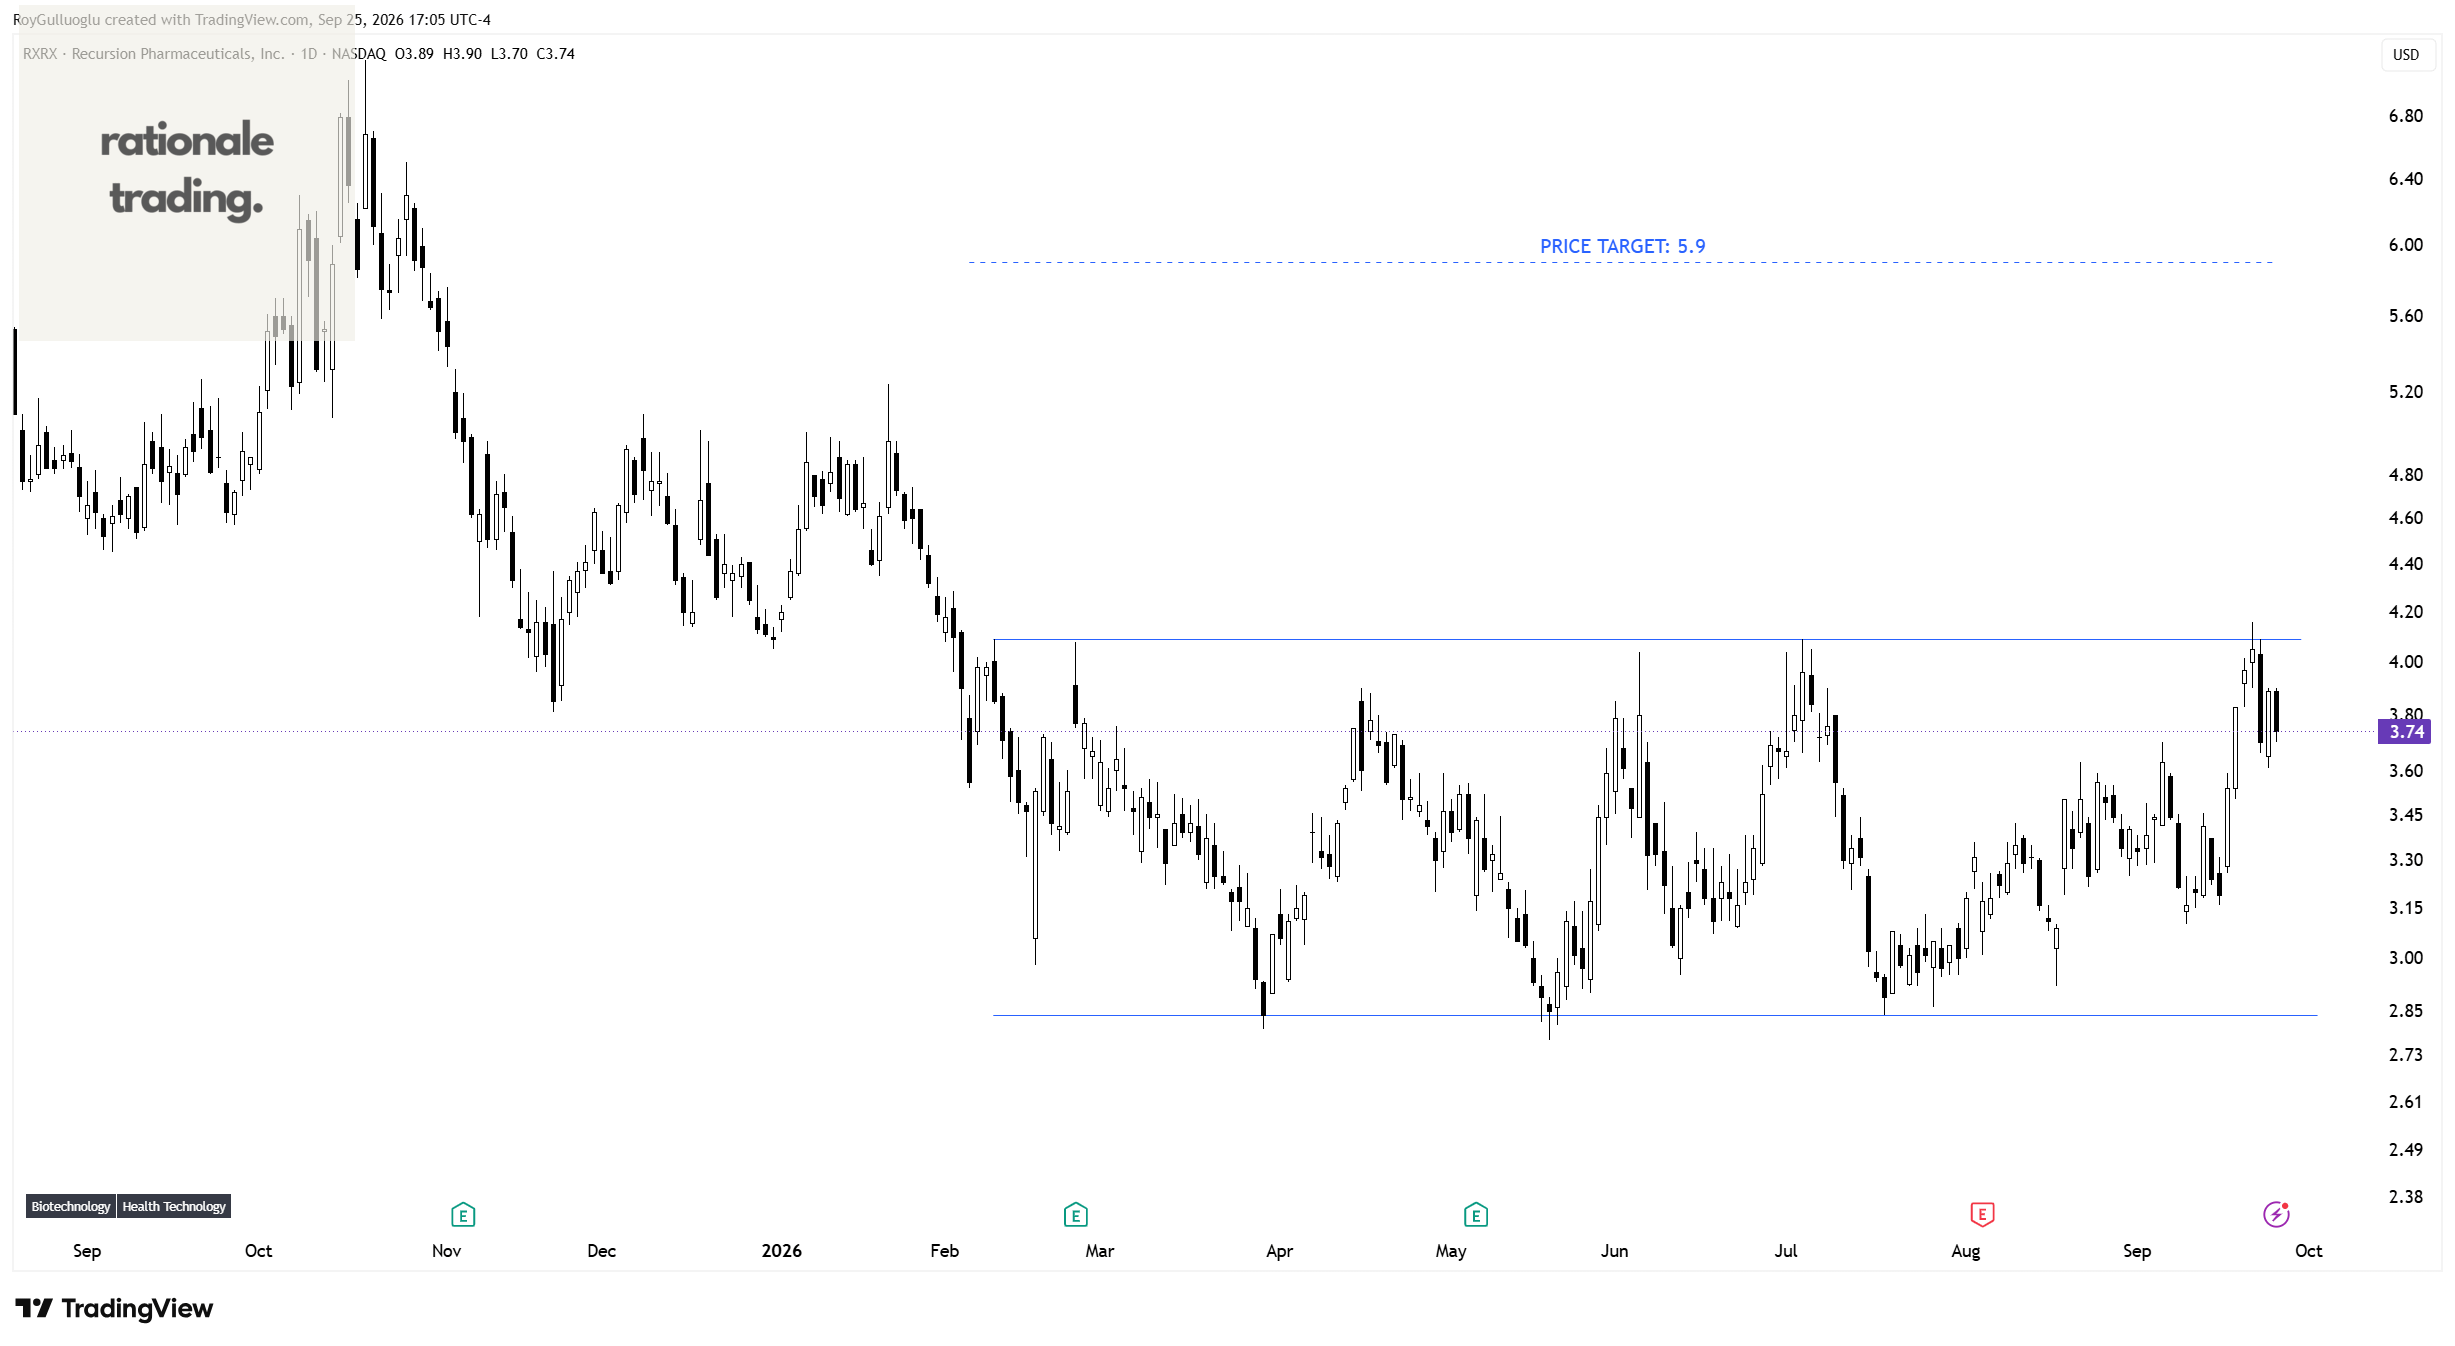
Recursion Pharmaceuticals, Inc., a clinical-stage biotechnology company, engages in the decoding biology and chemistry by integrating technological innovations across biology, chemistry, automation, data science, and engineering to industrialize drug discovery in the United States and the United Kingdom.
The above daily chart formed an approximately 5-month-long rectangle chart pattern as a bullish reversal after a downtrend.
Within this pattern, the horizontal boundary at 4.09 levels acts as a resistance.
A daily close above 4.21 levels would validate the breakout from the 5-month-long rectangle chart pattern.
Based on this chart pattern, the potential price target is 5.9 levels.
Thanks for share!!