


New setups
TICKERS: CVLG(NASDAQ), GWRS(NASDAQ), SIG(NYSE), UCTT(NASDAQ), 7272(TSE), 9719(TSE), 688475(SSE), 688300(SSE)
Covenant Logistics Group, Inc.-(CVLG/NASDAQ)-Long Idea
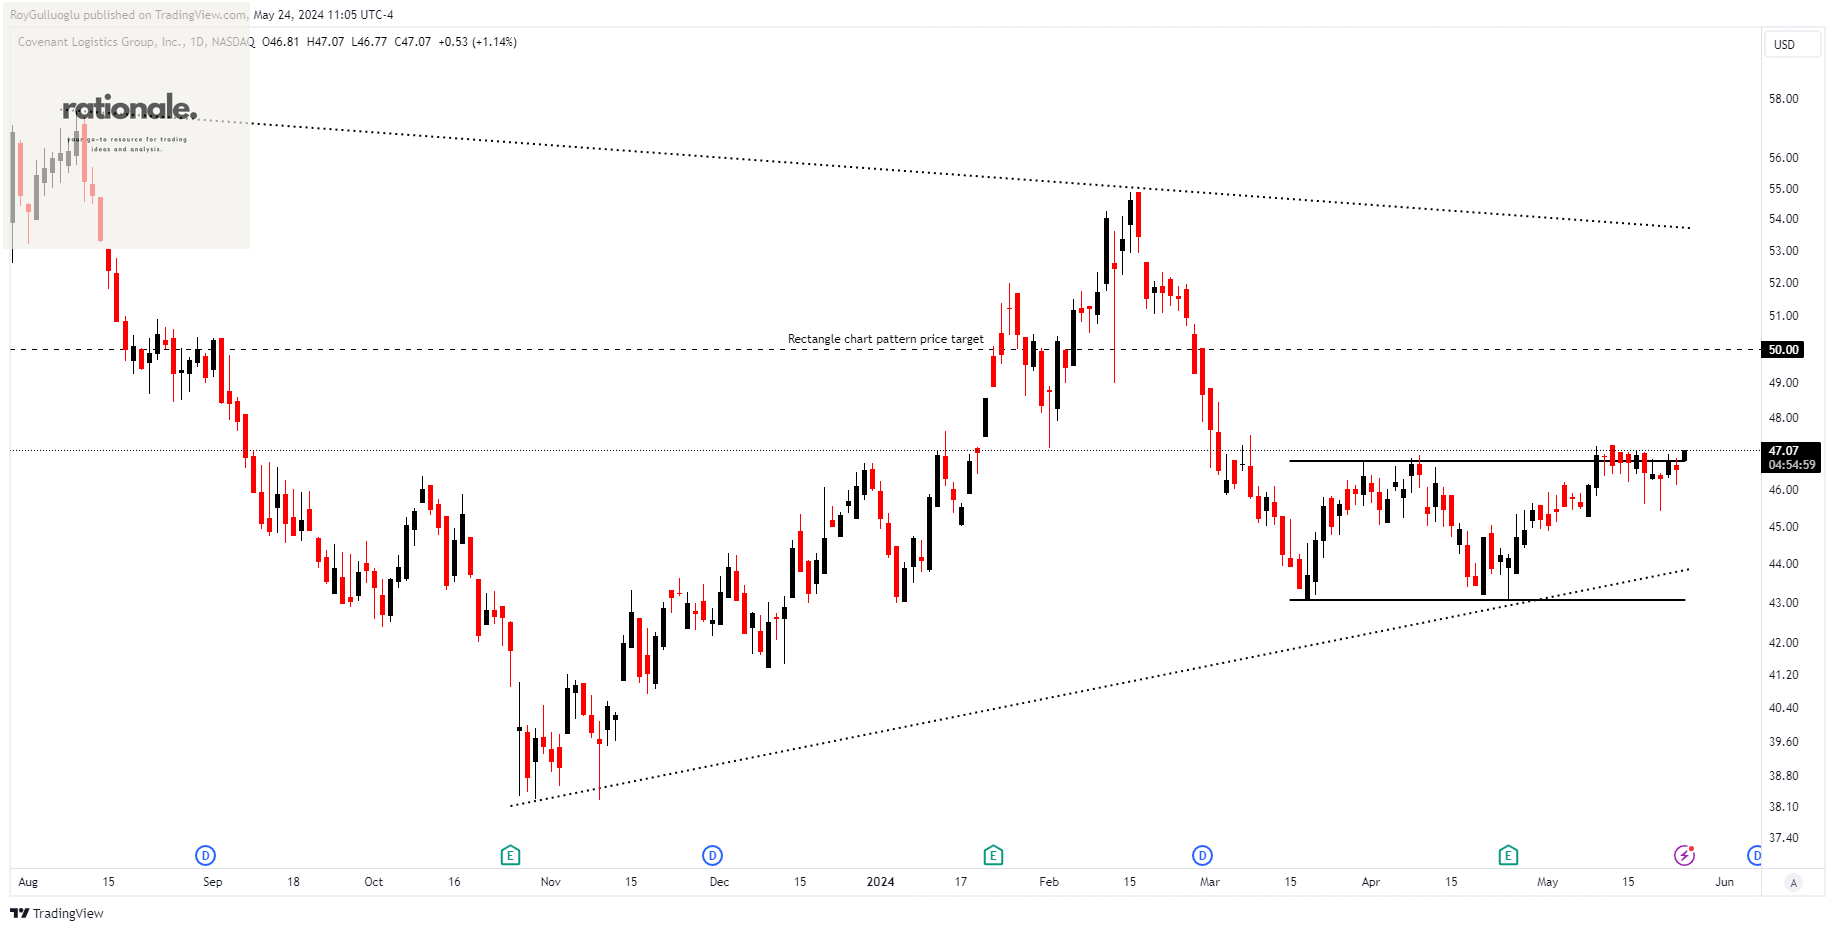
Covenant Logistics Group, Inc. and its subsidiaries offer transportation and logistics services across the United States. The company operates through four segments: Expedited, Dedicated, Managed Freight, and Warehousing.
The above daily chart formed an approximately 2-month-long rectangle chart pattern as a bullish reversal after a downtrend.
The horizontal boundary at 46.76 levels acts as a support within this pattern.
A daily close above 48.16 levels would validate the breakout from the 2-month-long rectangle chart pattern.
Based on this chart pattern, the potential price target is 50 levels.
CVLG, classified under the "industrials" sector, falls under the “Small Cap - Value” stock category.
Global Water Resources, Inc.-(GWRS/NASDAQ)-Long Idea
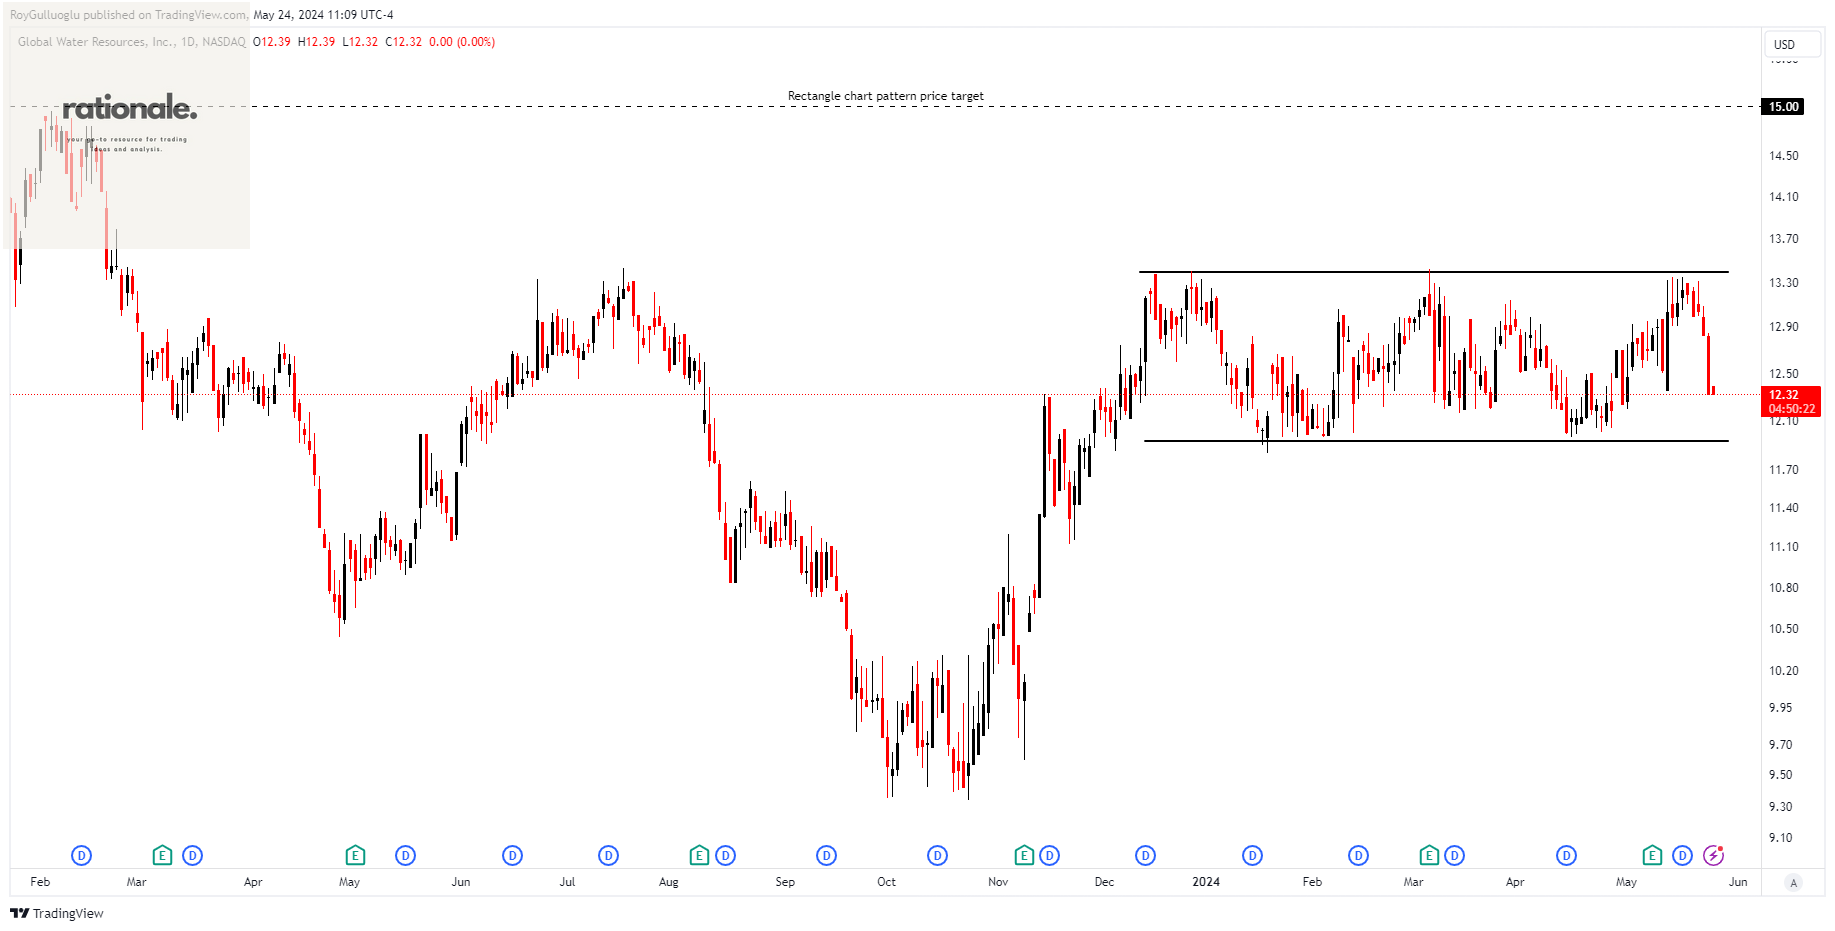
Global Water Resources, Inc. is a water resource management company that owns, operates, and manages regulated water, wastewater, and recycled water systems, primarily serving the metropolitan areas of Phoenix and Tucson, Arizona.
The above daily chart formed an approximately 4-month-long rectangle chart pattern as a bullish continuation after an uptrend.
The horizontal boundary at 13.39 levels acts as a support within this pattern.
A daily close above 13.79 levels would validate the breakout from the 4-month-long rectangle chart pattern.
Based on this chart pattern, the potential price target is 15 levels.
GWRS, classified under the "utilities" sector, falls under the “Small Cap - Income” stock category.
Signet Jewelers Limited-(SIG/NYSE)-Long Idea
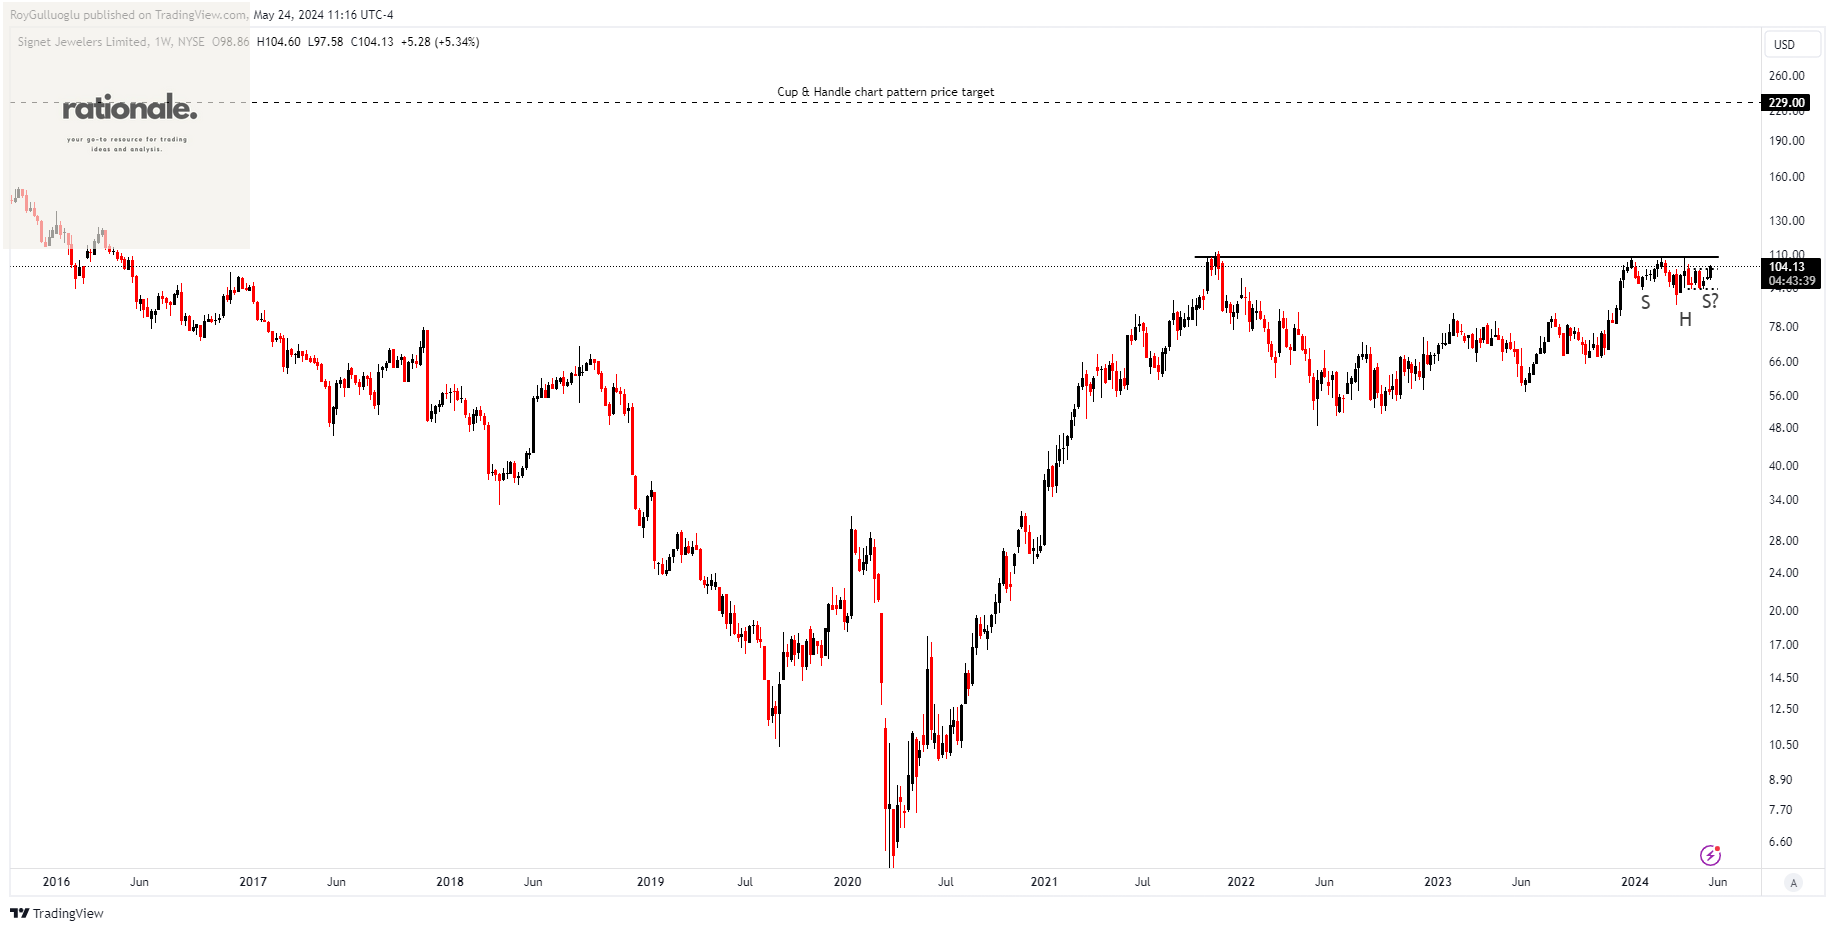
Signet Jewelers Limited operates as a retailer specializing in diamond jewelry.
The above weekly chart formed an approximately 33-month-long Cup & Handle chart pattern as a bullish continuation after an uptrend.
The horizontal boundary at 108.78 levels acts as a support within this pattern.
A daily close above 112 levels would validate the breakout from the 33-month-long Cup & Handle chart pattern.
Based on this chart pattern, the potential price target is 229 levels.
SIG, classified under the "healthcare" sector, falls under the “Small Cap - Value” stock category.
Ultra Clean Holdings, Inc.-(UCTT/NASDAQ)-Long Idea
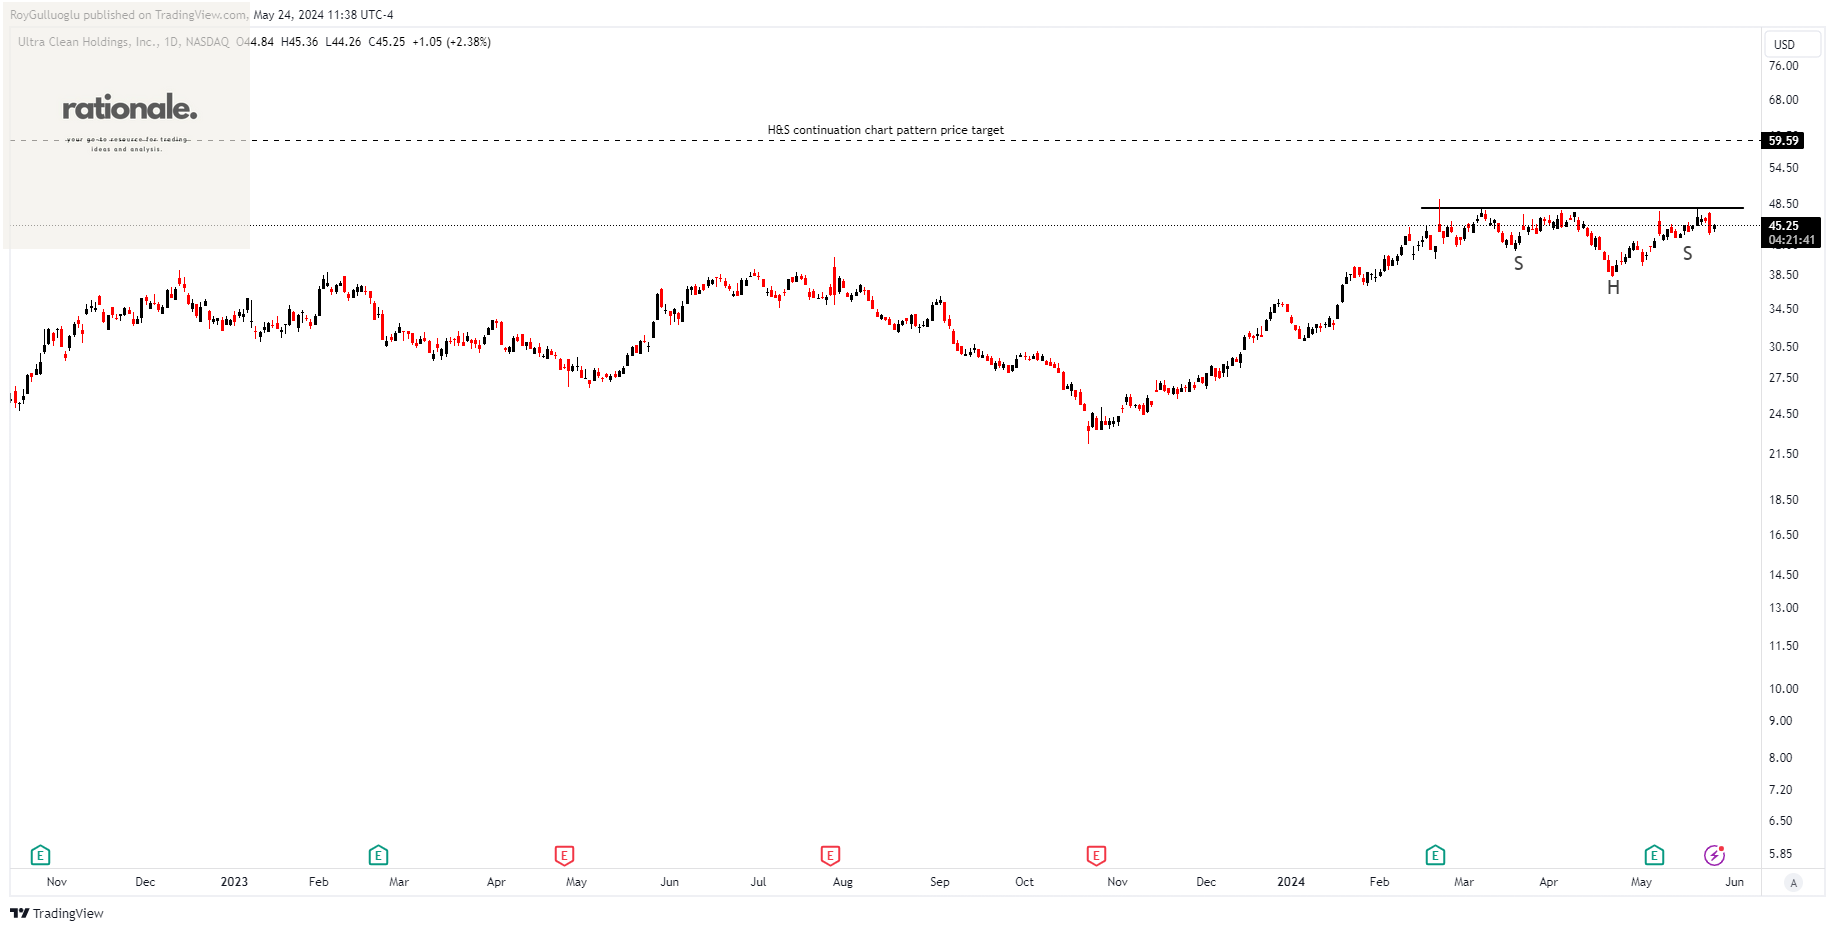
Ultra Clean Holdings, Inc. develops and supplies critical subsystems, components, and parts, as well as ultra-high purity cleaning and analytical services for the semiconductor industry both in the United States and internationally.
The above daily chart formed an approximately 2-month-long H&S continuation chart pattern as a bullish continuation after an uptrend.
The horizontal boundary at 47.77 levels acts as a support within this pattern.
A daily close above 49.2 levels would validate the breakout from the 2-month-long H&S continuation chart pattern.
Based on this chart pattern, the potential price target is 59.59 levels.
UCTT, classified under the "technology" sector, falls under the “Small Cap - Growth” stock category.
Yamaha Motor Co., Ltd.-(7272/TSE)-Long Idea
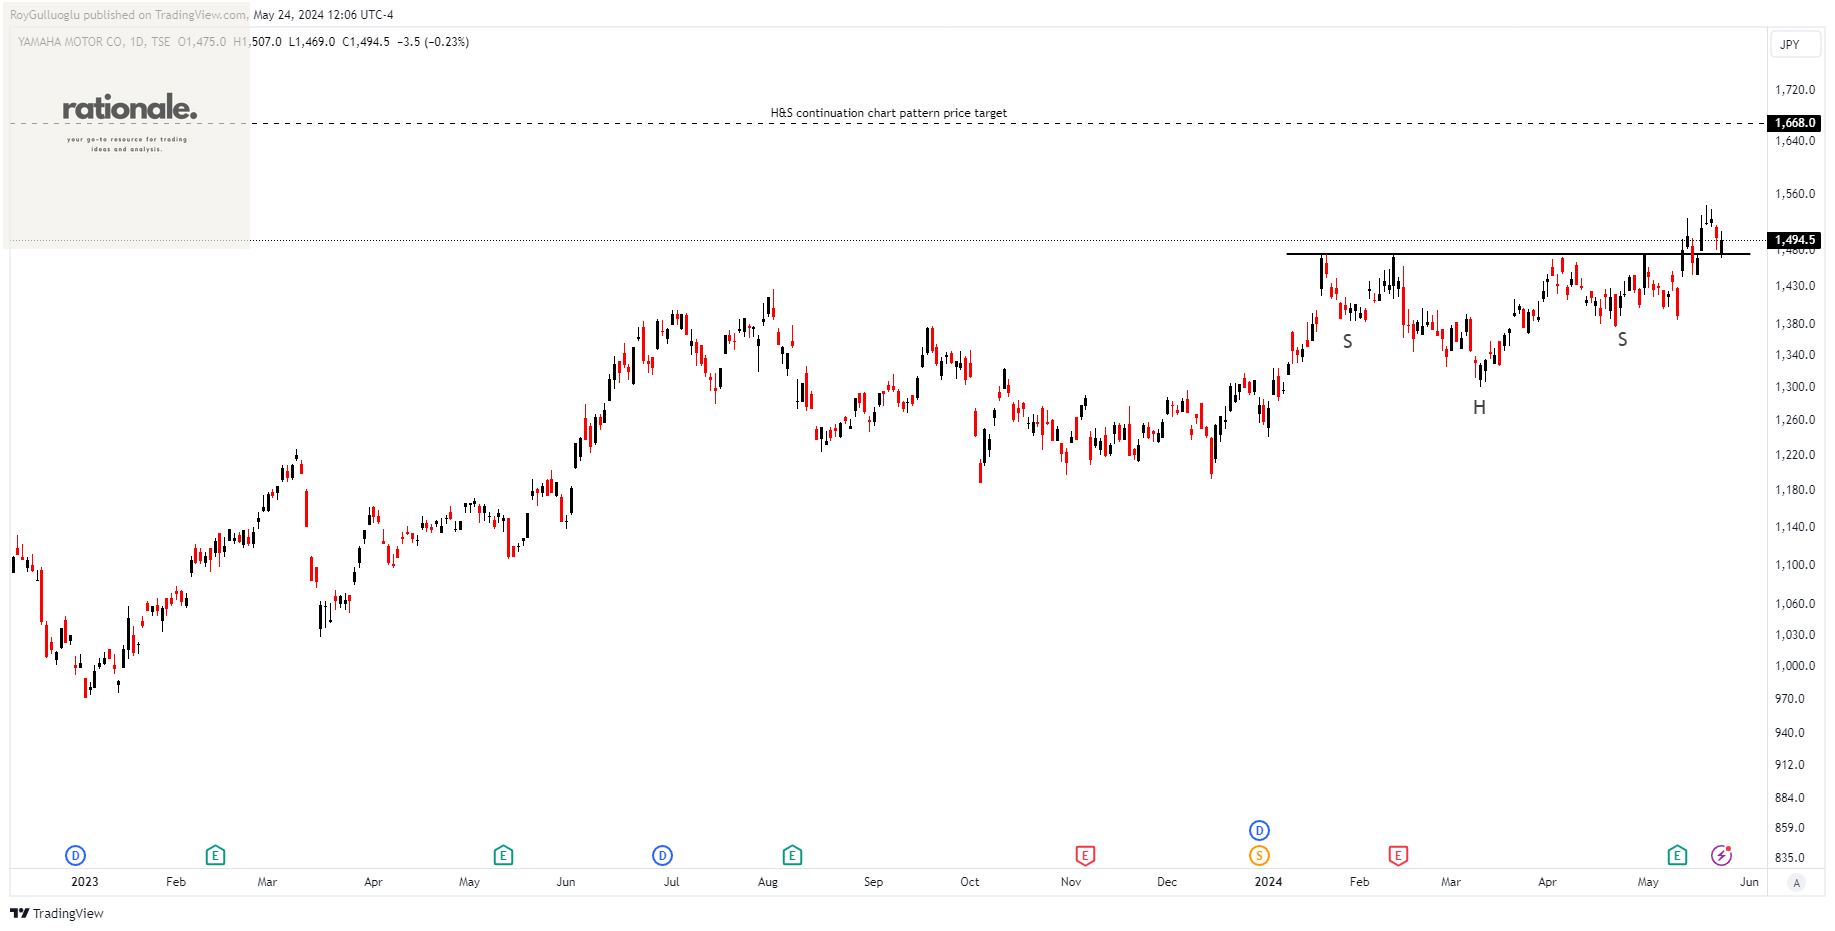
Yamaha Motor Co., Ltd., along with its subsidiaries, operates in land mobility, marine products, robotics, and financial services across Japan, North America, Europe, Asia, and other international markets.
The above daily chart formed an approximately 3-month-long H&S continuation chart pattern as a bullish continuation after an uptrend.
The horizontal boundary at 1474 levels acted as a support within this pattern.
A daily close above 1518.22 levels validated the breakout from the 3-month-long H&S continuation chart pattern. The price broke out and pulled back to the support line.
Based on this chart pattern, the potential price target is 1668 levels.
7272, classified under the "consumer cyclical" sector, falls under the “Mid Cap - Growth” stock category.
SCSK Corporation-(9719/TSE)-Long Idea
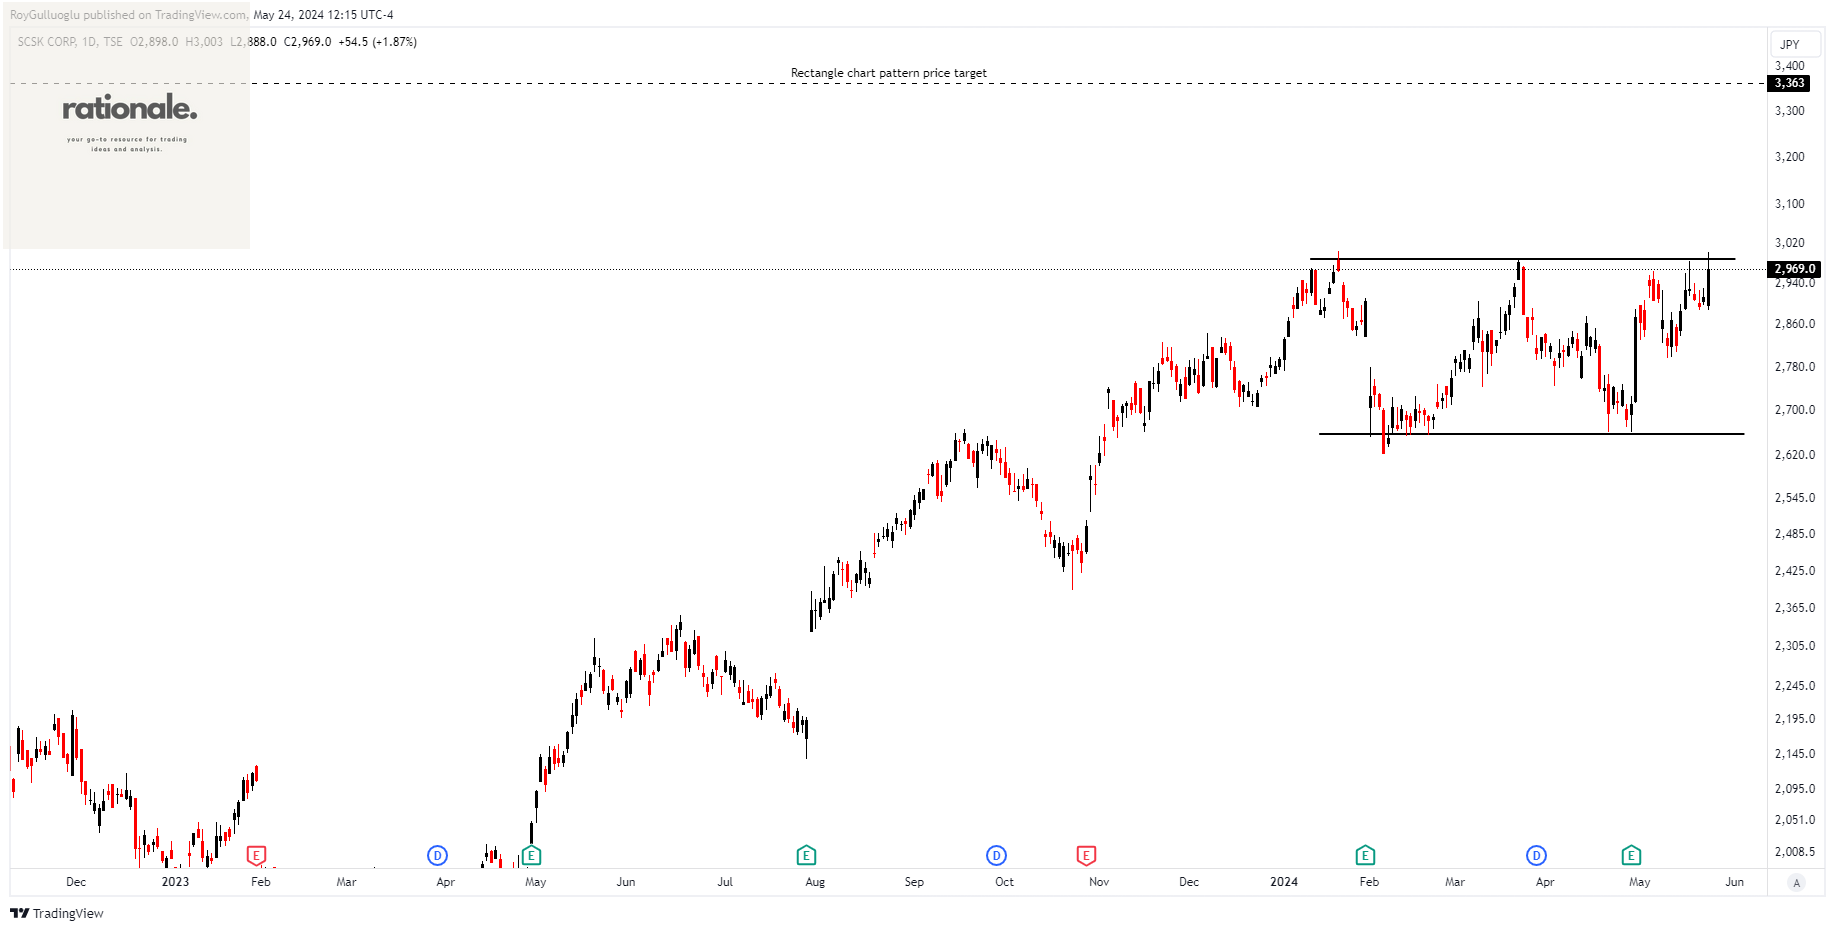
SCSK Corporation offers information technology (IT) services both domestically in Japan and internationally. Its operations are divided into six segments: Industrial IT Business, Financial IT Business, IT Business Solutions, IT Platform Solutions, IT Management Service, and Others.
The above weekly chart formed an approximately 3-month-long rectangle chart pattern as a bullish continuation after an uptrend.
The horizontal boundary at 2989 levels acts as a support within this pattern.
A daily close above 3078 levels would validate the breakout from the 3-month-long rectangle chart pattern.
Based on this chart pattern, the potential price target is 3363 levels.
9719, classified under the "technology" sector, falls under the “Mid Cap - Growth” stock category.
Hangzhou EZVIZ Network Co., Ltd.-(688475/SSE)-Long Idea
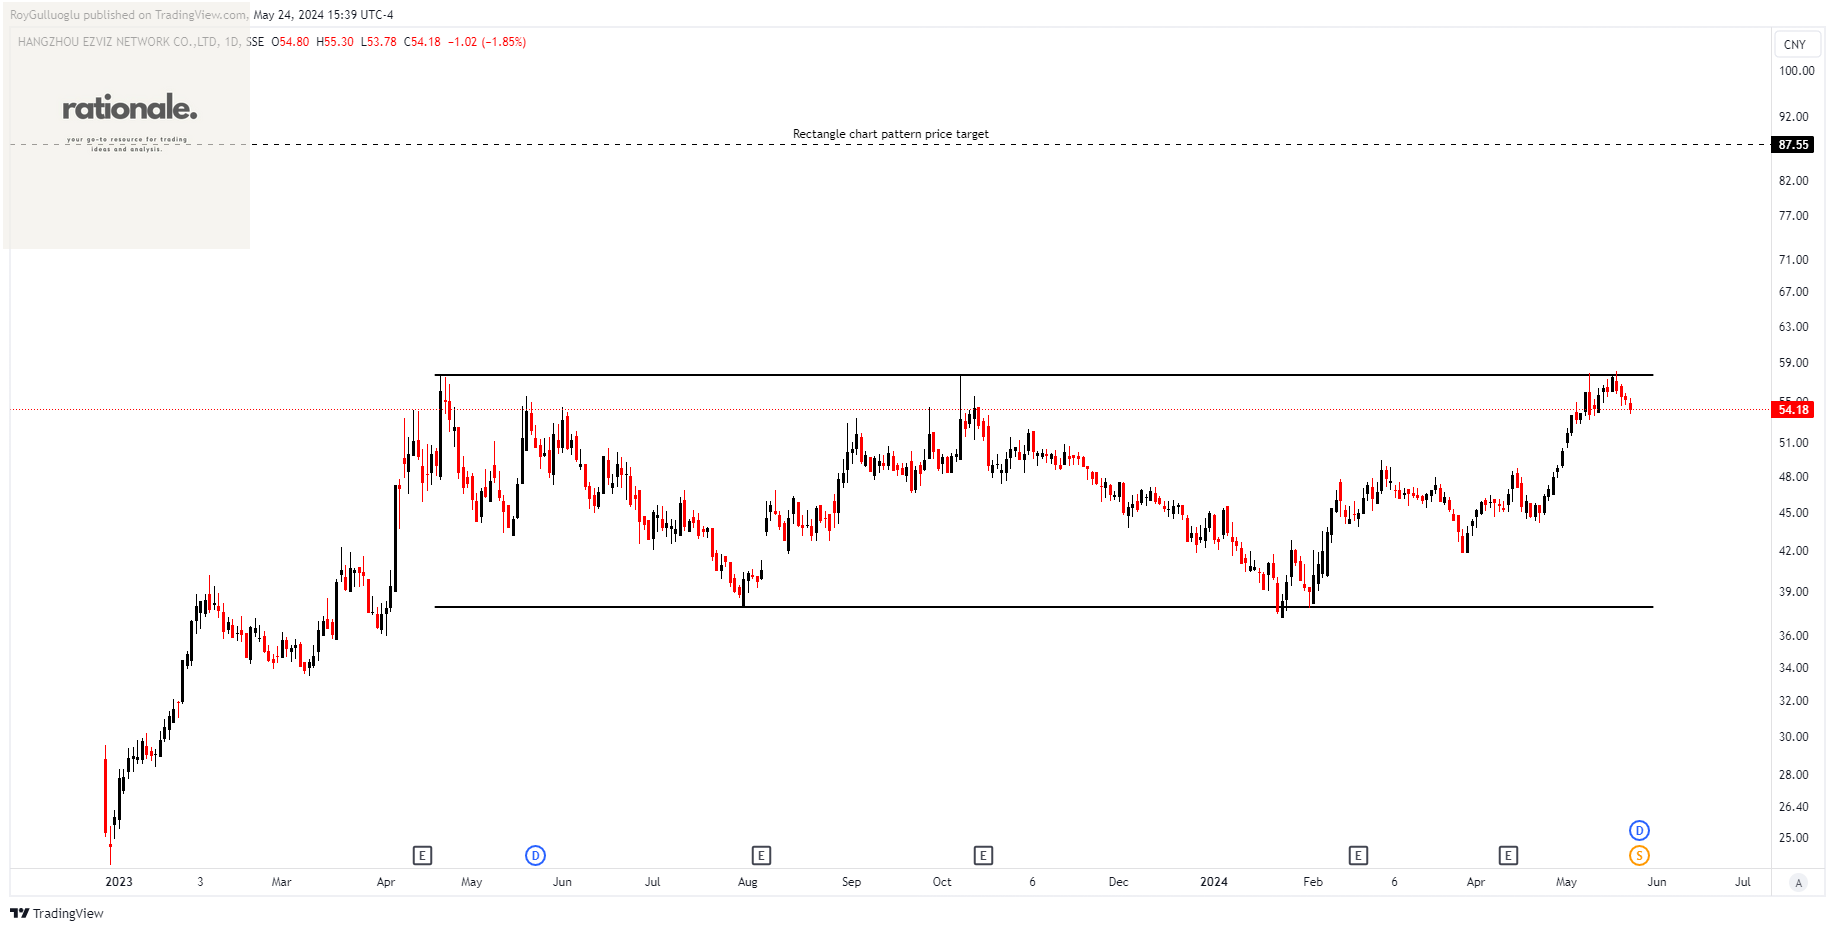
Hangzhou EZVIZ Network Co., Ltd. manufactures and sells smart home products in both domestic Chinese and international markets.
The above daily chart formed an approximately 9-month-long rectangle chart pattern as a bullish continuation after an uptrend.
The horizontal boundary at 57.65 levels acts as a support within this pattern.
A daily close below 59.38 levels would validate the breakdown from the 9-month-long rectangle chart pattern.
Based on this chart pattern, the potential price target is 87.55 levels.
688475, classified under the "technology" sector, falls under the “Mid Cap - Growth” stock category.
Novoray Corporation-(688300/SSE)-Long Idea
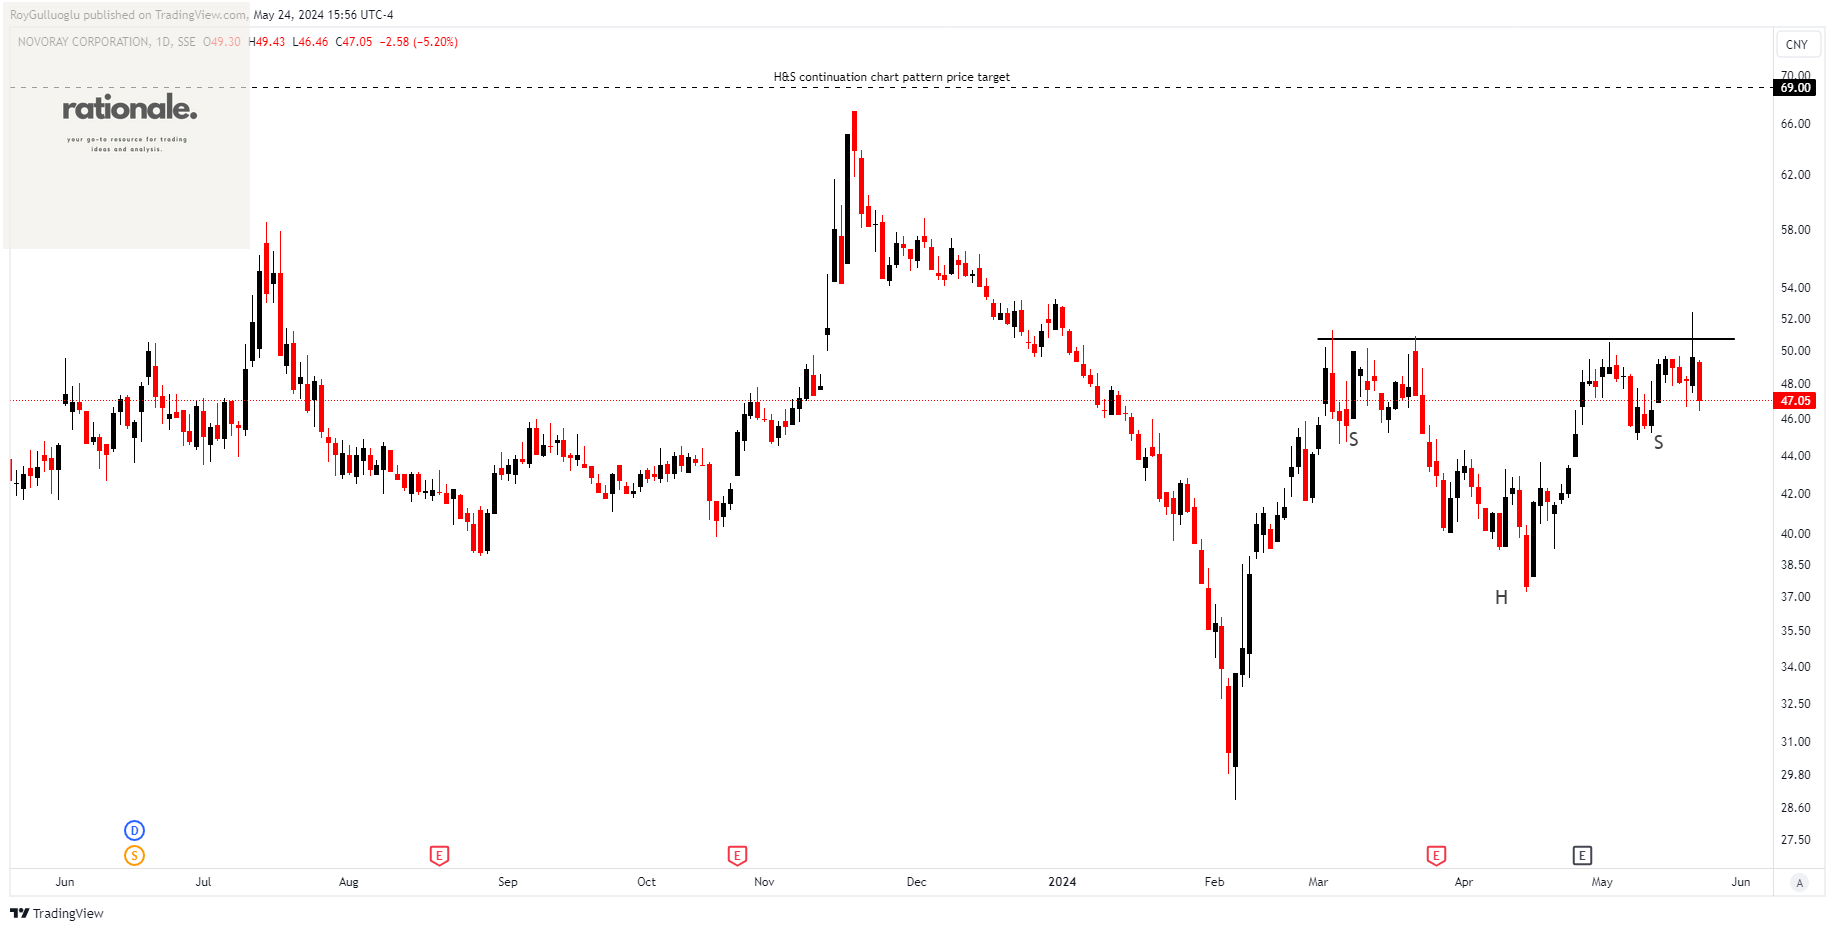
Novoray Corporation engages in the research, development, manufacturing, and sale of industrial powder materials for various applications globally.
The above daily chart formed an approximately 2-month-long H&S continuation chart pattern as a bullish continuation after an uptrend.
The horizontal boundary at 50.72 levels acts as a support within this pattern.
A daily close below 52.24 levels would validate the breakdown from the 2-month-long H&S continuation chart pattern.
Based on this chart pattern, the potential price target is 69 levels.
688300, classified under the "basic materials" sector, falls under the “Small Cap - Value” stock category.
TEŞEKKÜRLER