


Talos Energy Inc.-(TALO/NYSE)-Long Idea
Talos Energy Inc., through its subsidiaries, engages in the exploration and production of oil and gas in the United States and Mexico.
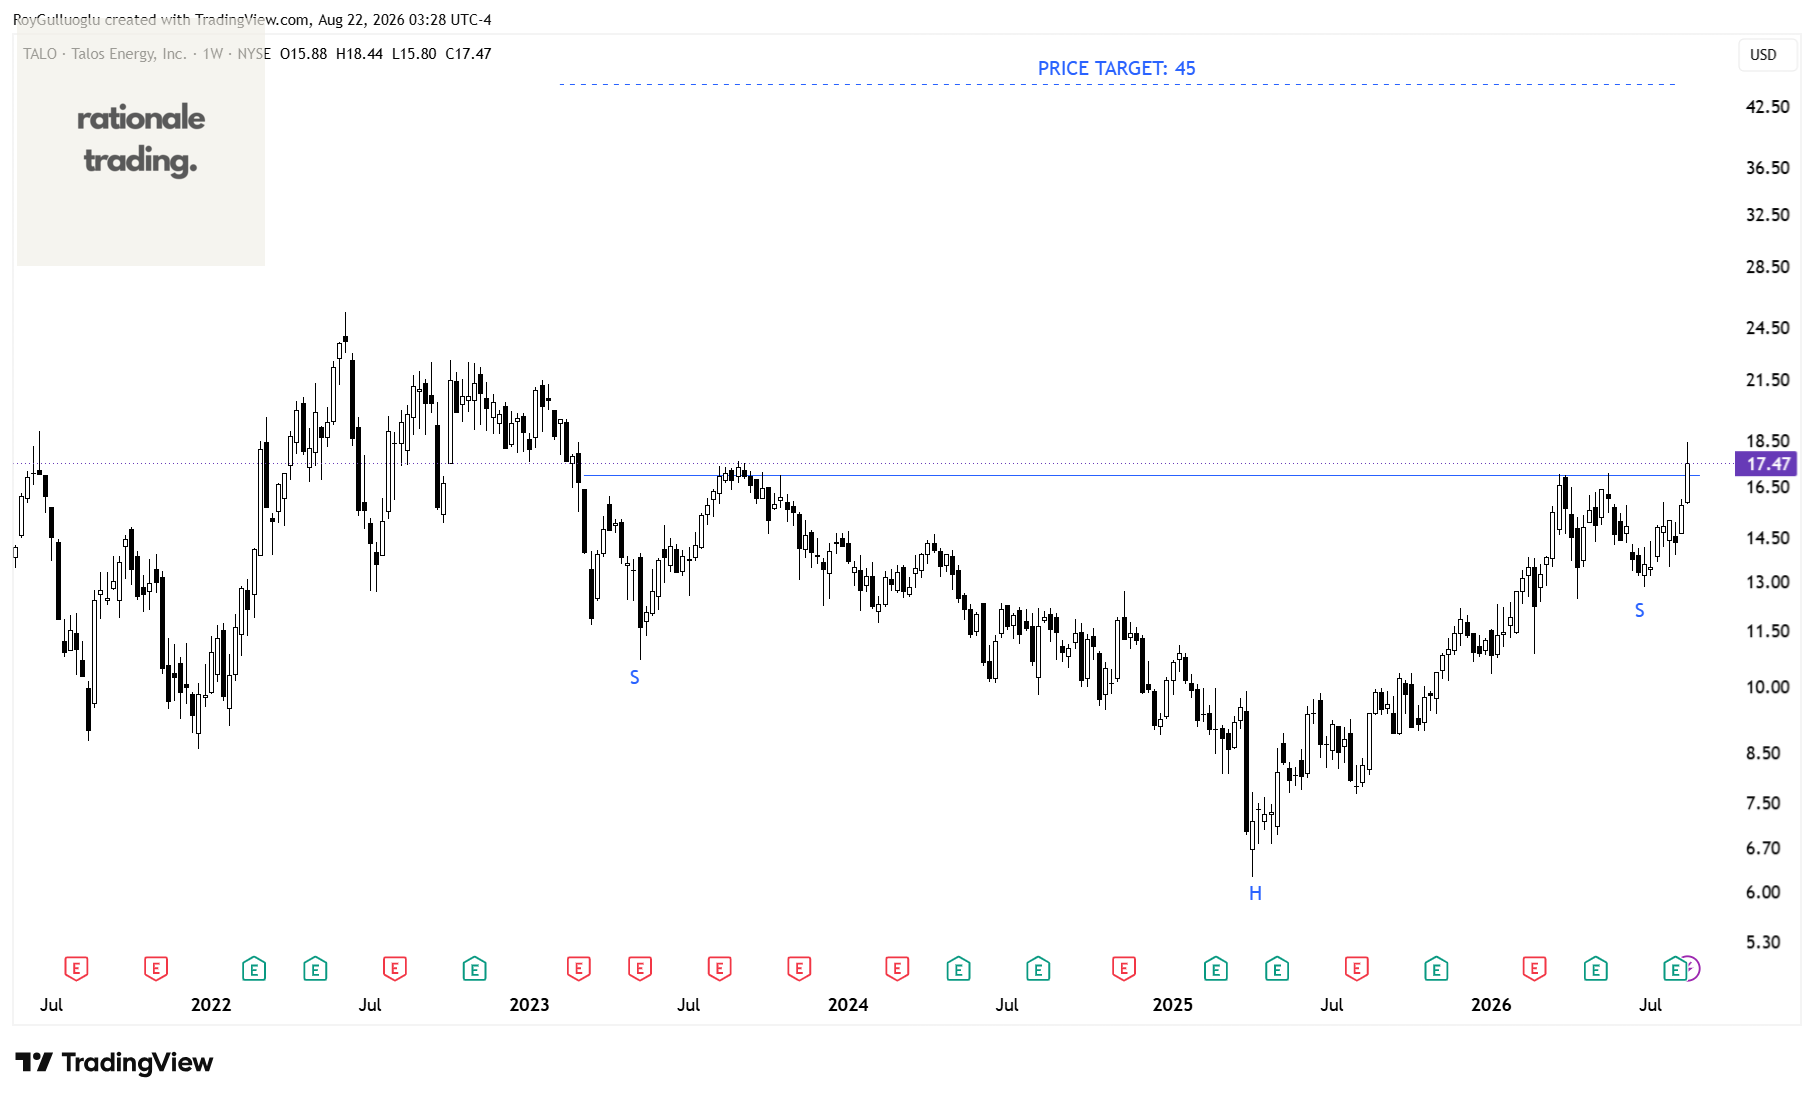
The above weekly chart formed an approximately 45-month-long H&S bottom chart pattern as a bullish reversal after a downtrend.
Within this pattern, the horizontal boundary at 16.96 levels acts as a resistance.
A daily close above 17.47 levels would validate the breakout from the 6-month-long H&S bottom chart pattern.
Based on this chart pattern, the potential price target is 45 levels.
CF Industries Holdings, Inc.-(CF/NYSE)-Long Idea
CF Industries Holdings, Inc., together with its subsidiaries, engages in the production of ammonia in North America, Europe, and internationally.
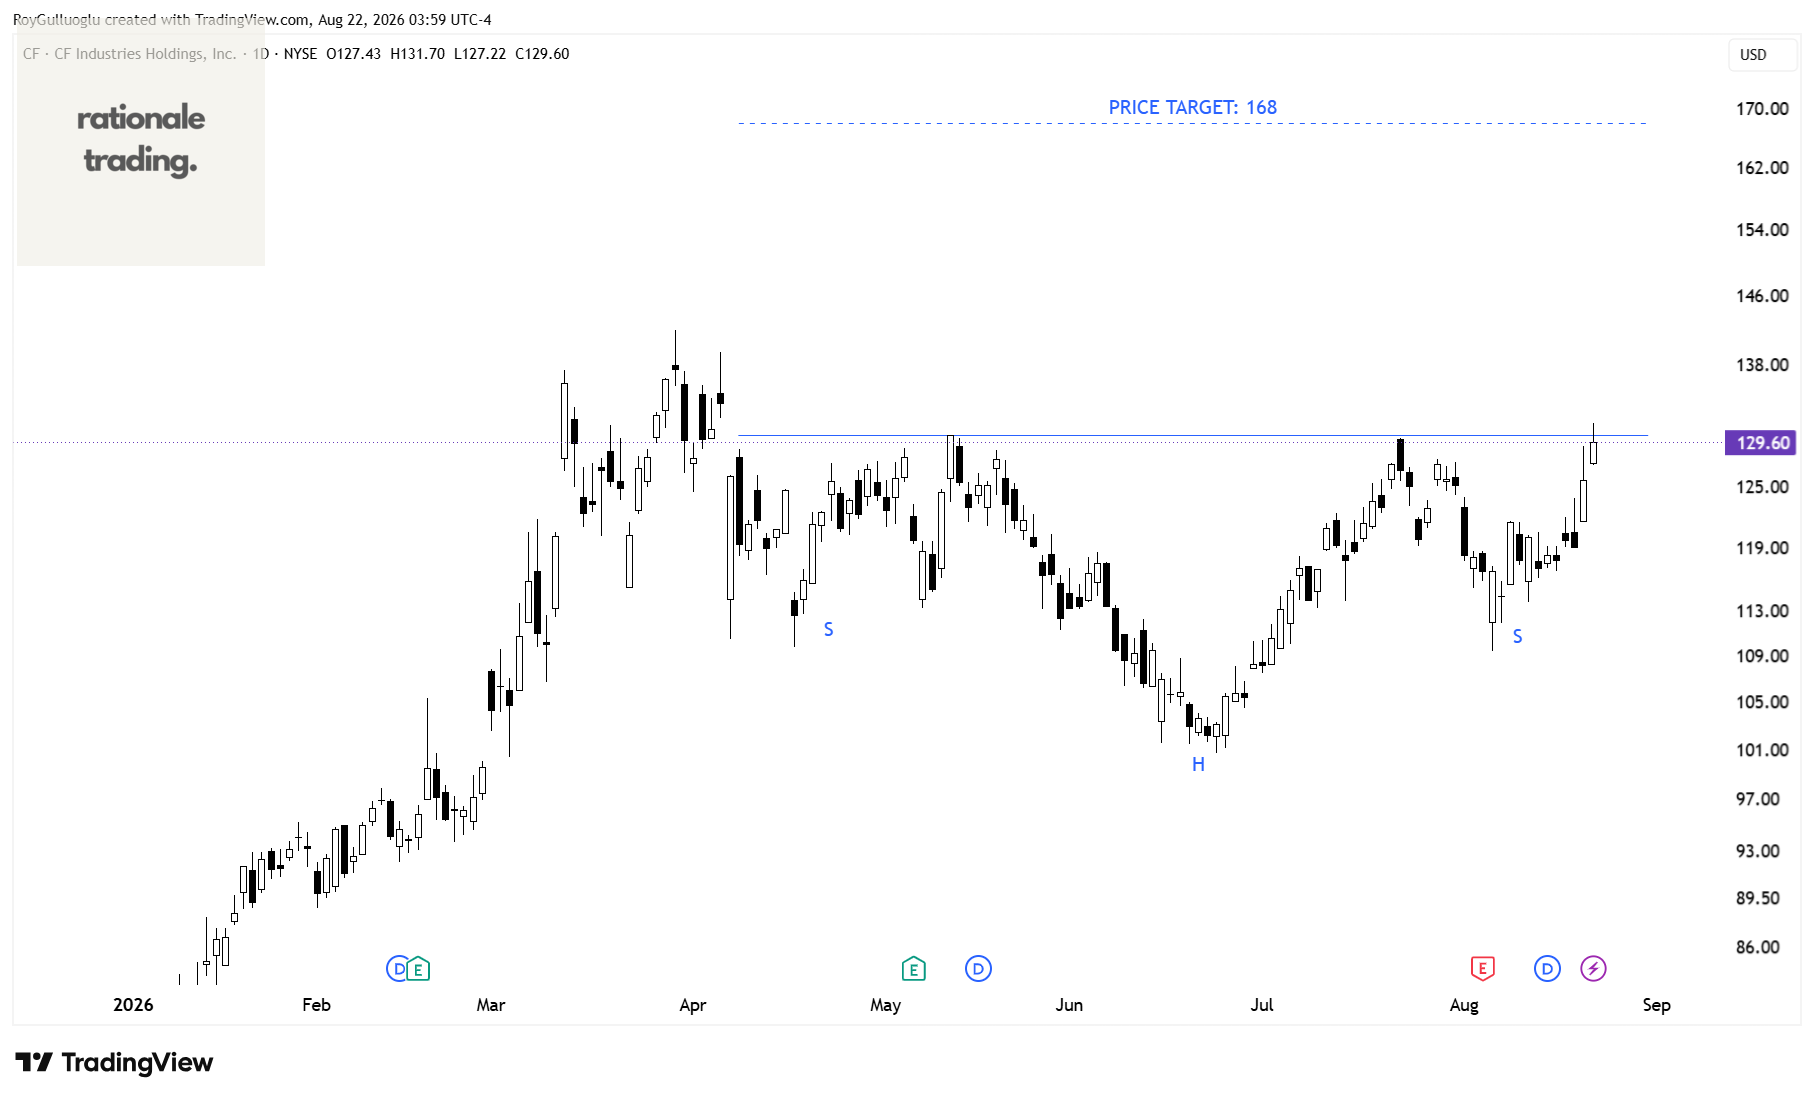
The above daily chart formed an approximately 3-month-long H&S bottom chart pattern as a bullish reversal after a downtrend.
Within this pattern, the horizontal boundary at 130.43 levels acts as a resistance.
A daily close above 134.3 levels would validate the breakout from the 3-month-long H&S bottom chart pattern.
Based on this chart pattern, the potential price target is 168 levels.
Benitec Biopharma Inc.-(BNTC/NASDAQ)-Long Idea
Benitec Biopharma Inc., a clinical-stage biotechnology company, focuses on the development of novel genetic medicines.
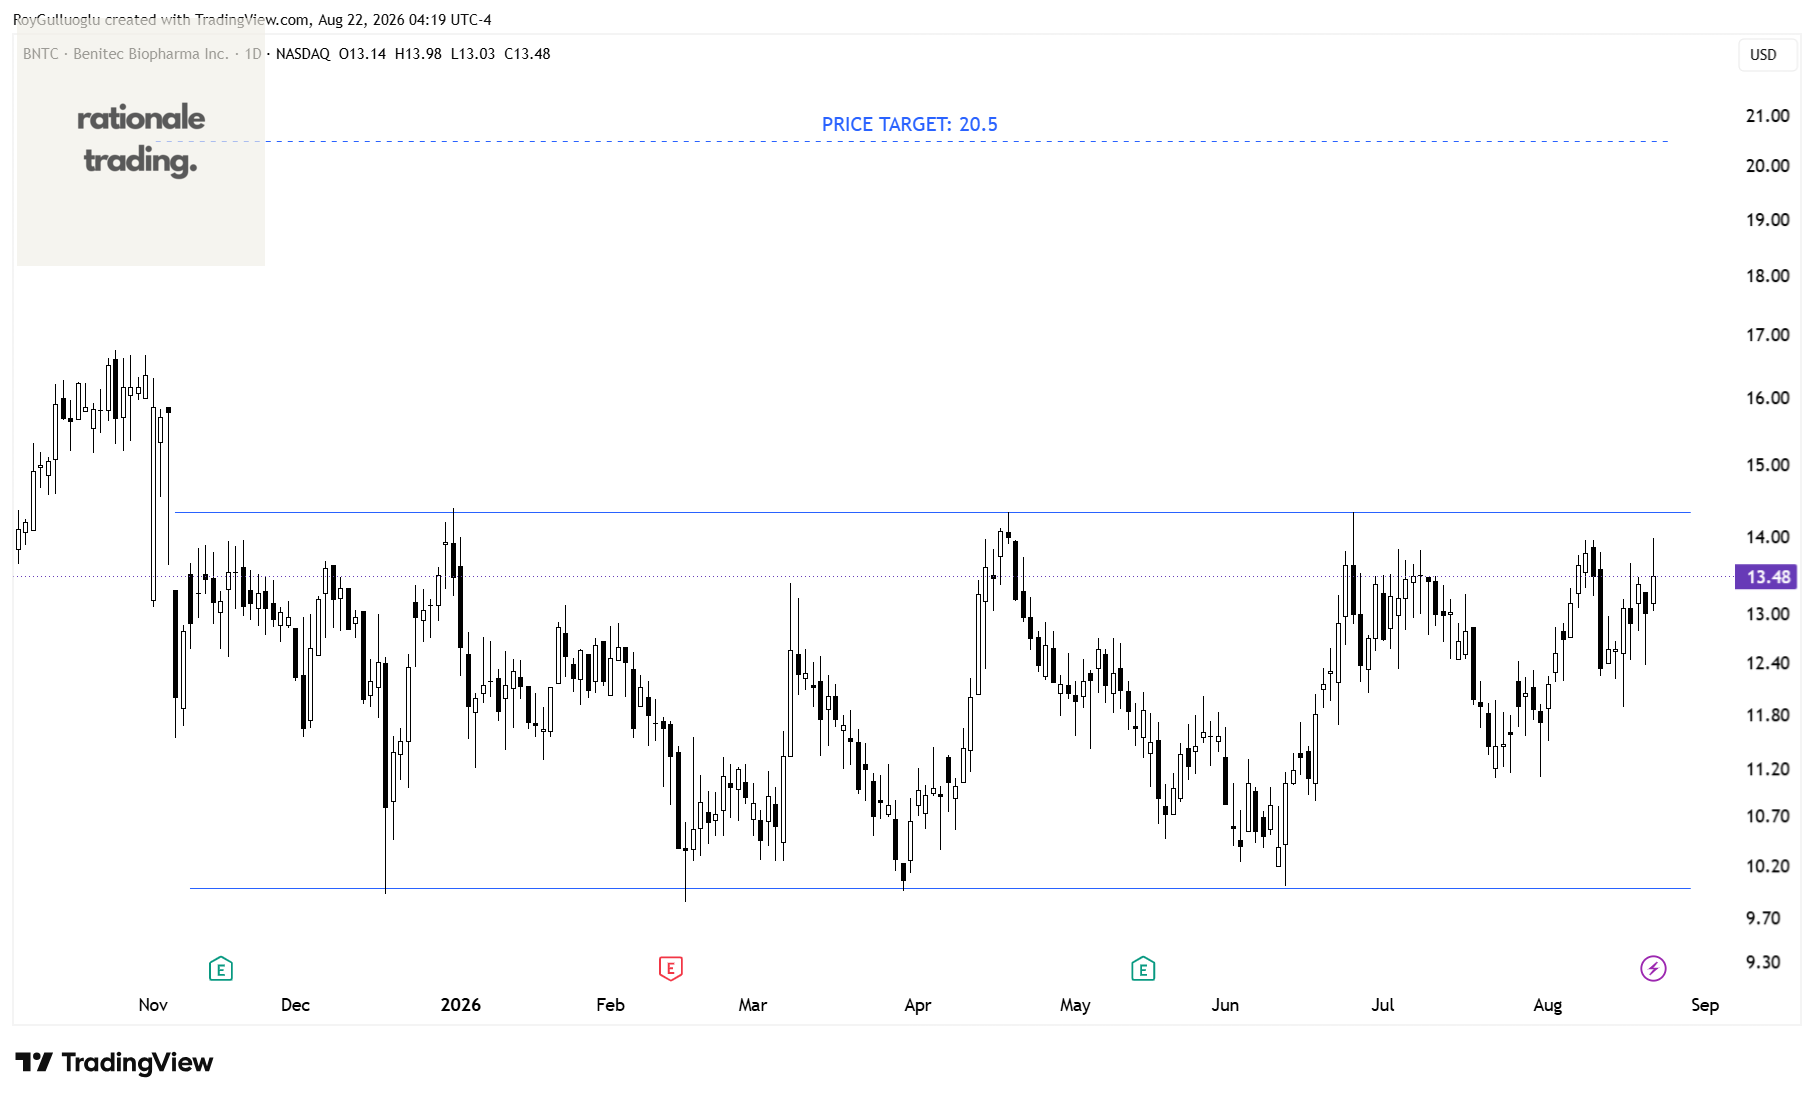
The above daily chart formed an approximately 6-month-long rectangle chart pattern as a bullish reversal after a downtrend.
Within this pattern, the horizontal boundary at 14.33 levels acts as a resistance.
A daily close above 14.75 levels would validate the breakout from the 6-month-long rectangle chart pattern.
Based on this chart pattern, the potential price target is 20.5 levels.
Nutex Health Inc.-(NUTX/NASDAQ)-Long Idea
Nutex Health Inc. operates as a healthcare services and operations company in the United States
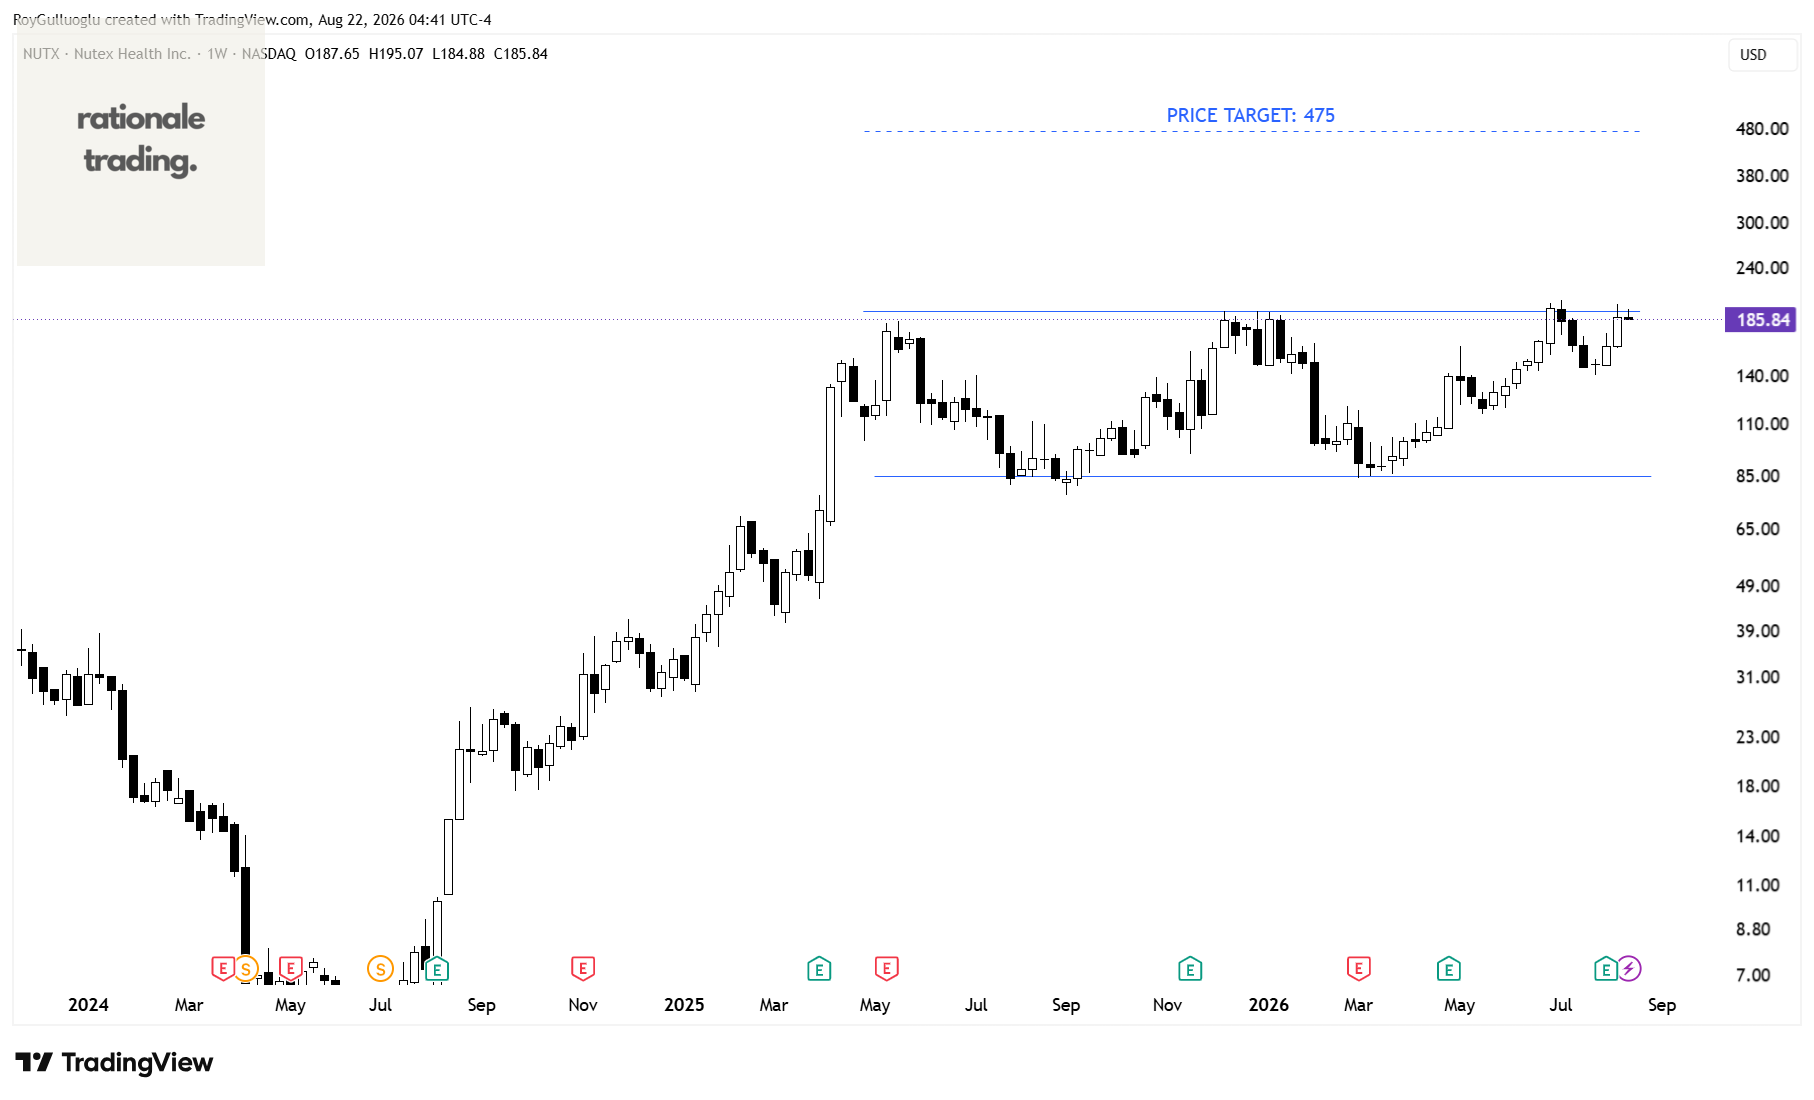
The above weekly chart formed an approximately 16-month-long rectangle chart pattern.
Within this pattern, the horizontal boundary at 193.35 levels acts as a resistance.
A daily close above 199 levels would validate the breakout from the 16-month-long rectangle chart pattern.
Based on this chart pattern, the potential price target is 475 levels.
Stewart Information Services Corporation-(STC/NYSE)-Long Idea
Stewart Information Services Corporation, through its subsidiaries, provides title insurance and real estate transaction related services in the United States and internationally.
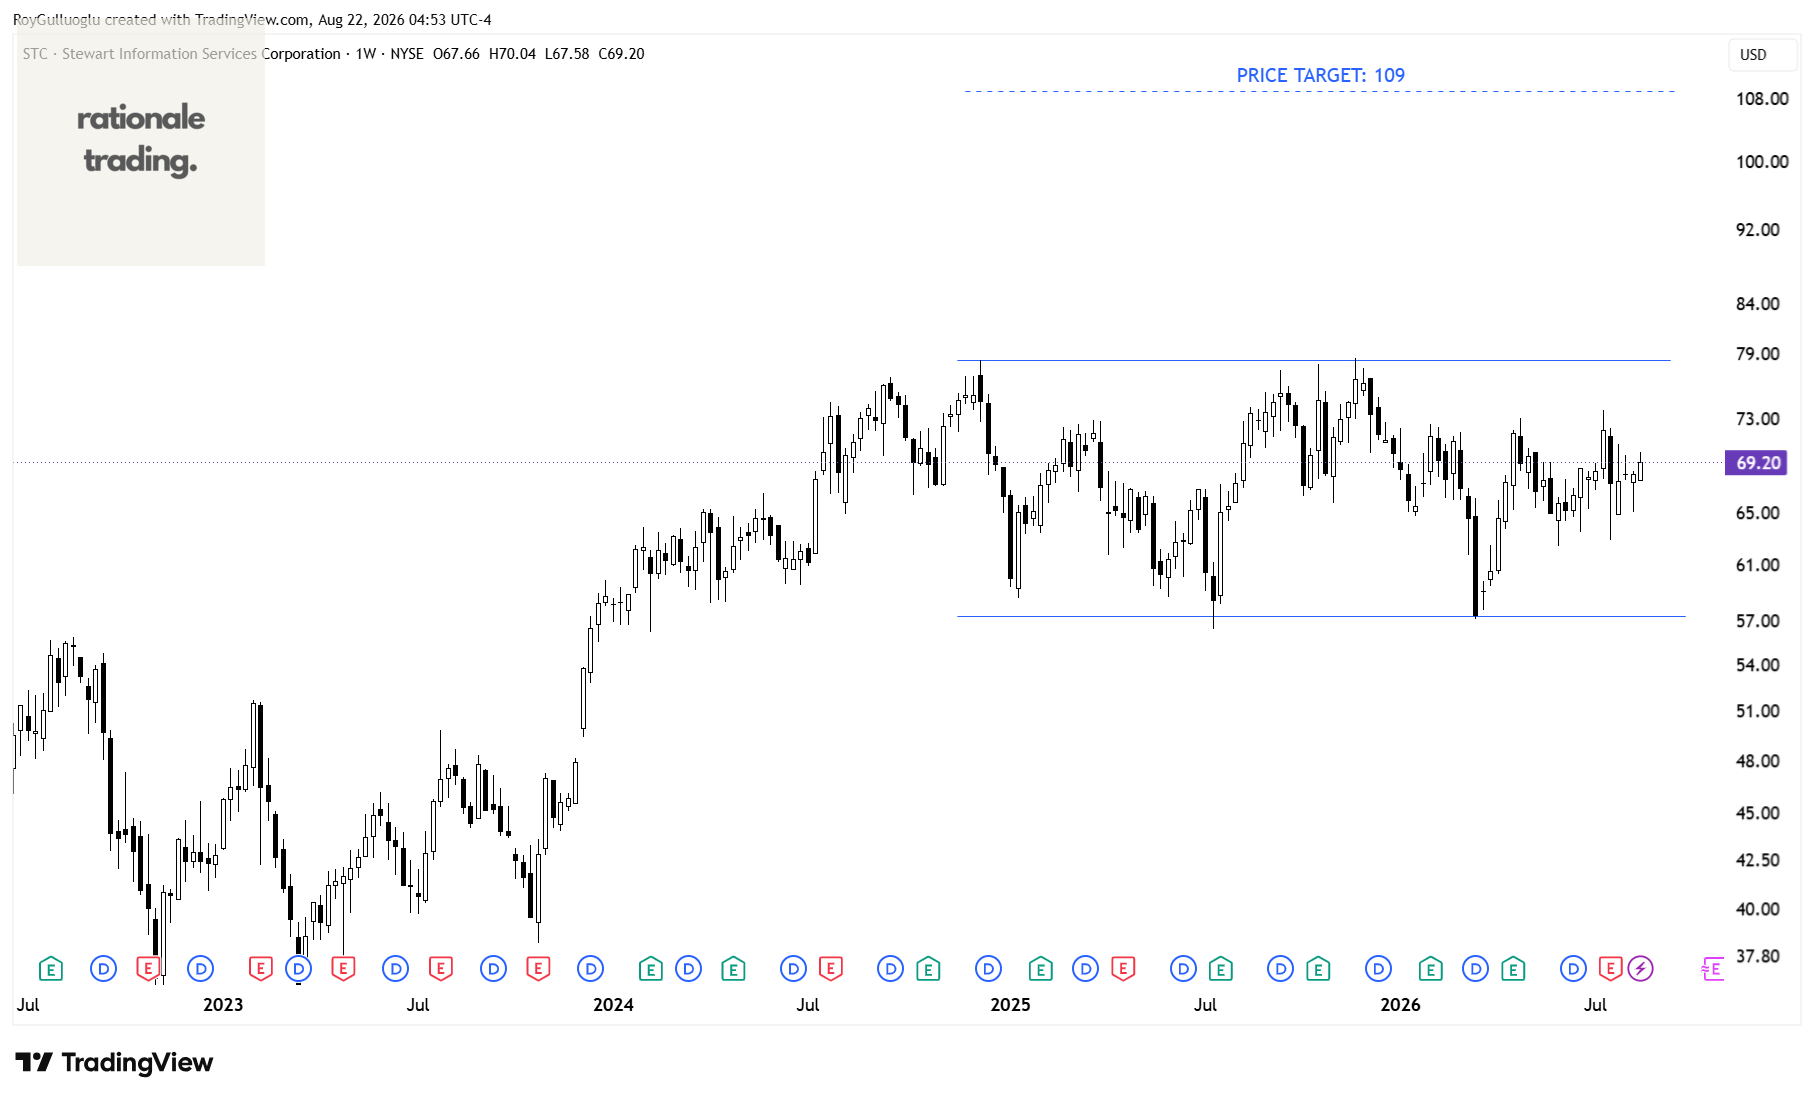
The above weekly chart formed an approximately 22-month-long rectangle chart pattern.
Within this pattern, the horizontal boundary at 78.44 levels acts as a resistance.
A daily close above 80.8 levels would validate the breakout from the 22-month-long rectangle chart pattern.
Based on this chart pattern, the potential price target is 109 levels.
Federal Signal Corporation-(FSS/NYSE)-Long Idea
Federal Signal Corporation designs, manufactures, and supplies a suite of products and integrated solutions for municipal, governmental, industrial, and commercial customers in the United States, Canada, Europe, and internationally.
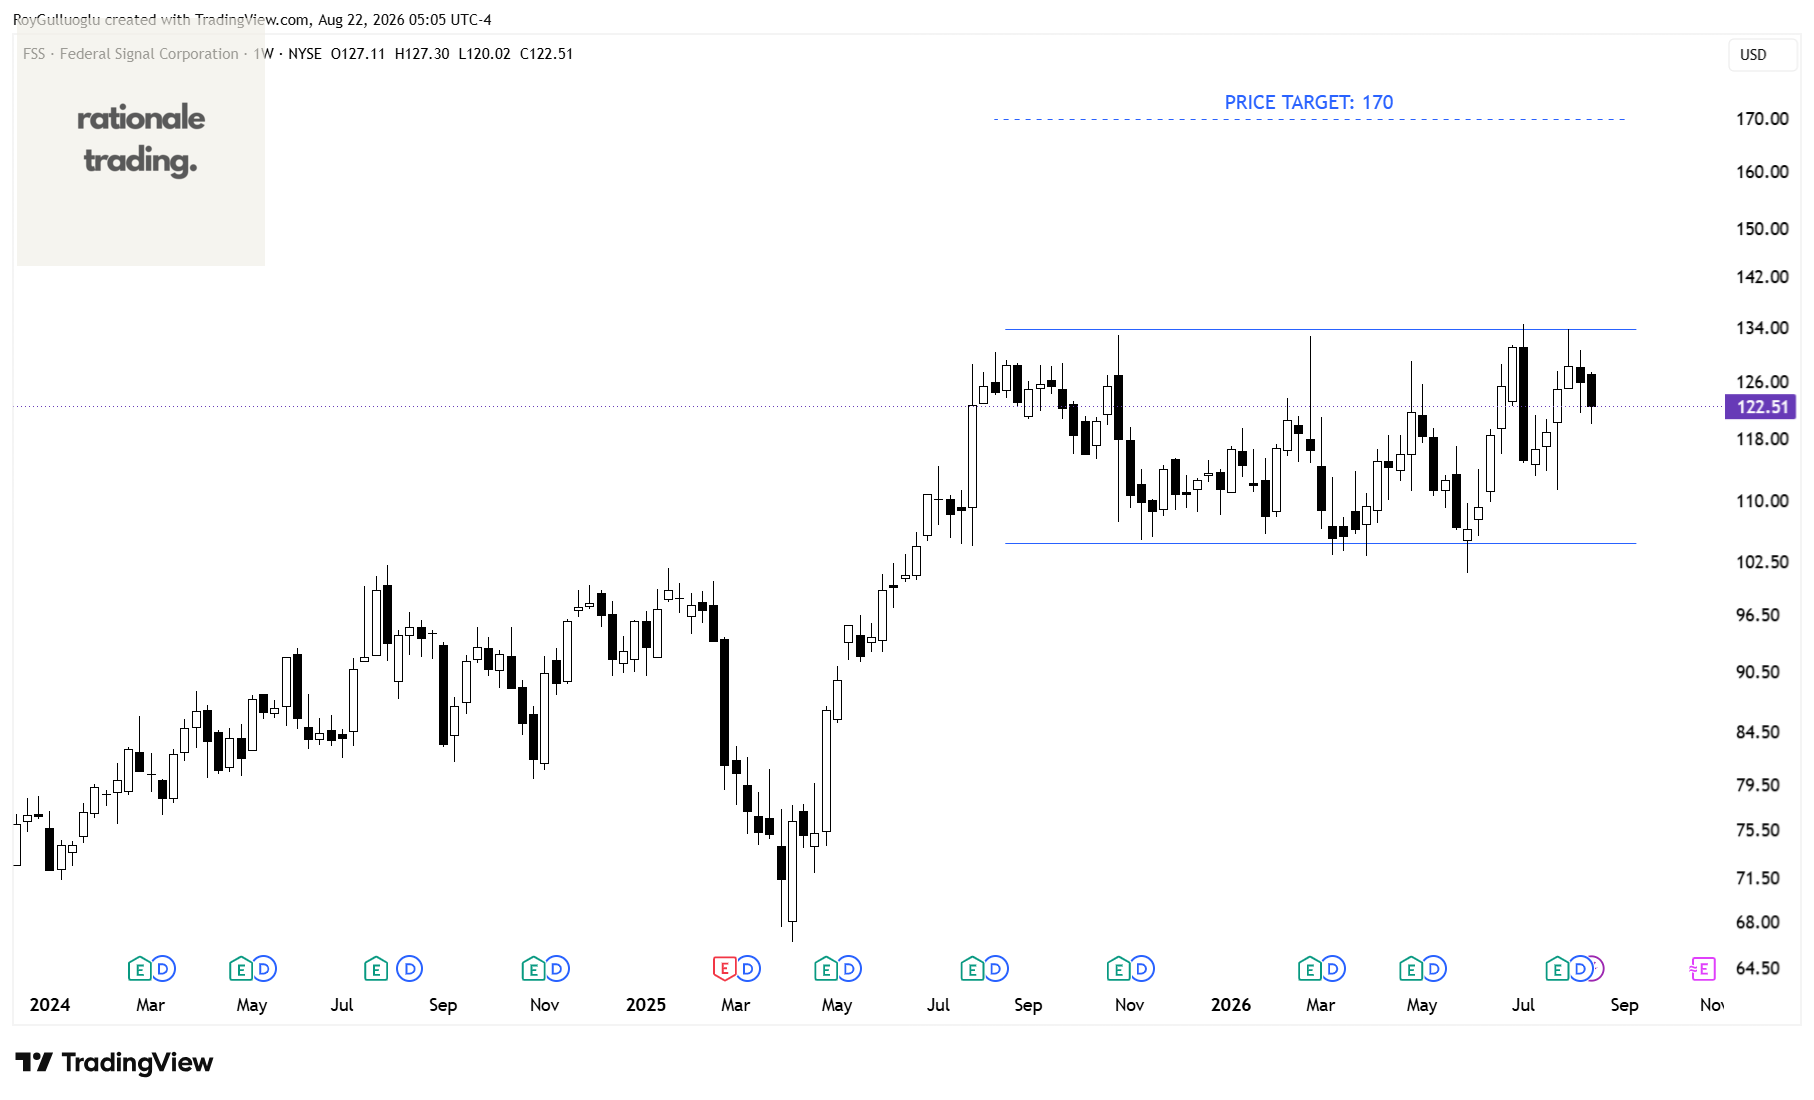
The above weekly chart formed an approximately 12-month-long rectangle chart pattern.
Within this pattern, the horizontal boundary at 133.78 levels acts as a resistance.
A daily close above 137.8 levels would validate the breakout from the 12-month-long rectangle chart pattern.
Based on this chart pattern, the potential price target is 170 levels.
You have an impersonator. I thought it would never happen on Substack. Report it
👉 ratioaletradessq83730
Hello Roy, there is an error in the price level for TALO. It shows 86.72, while the BP is at 17.47 with a TP at 45. Regards.