


Twist Bioscience Corporation-(TWST/NASDAQ)-Long Idea
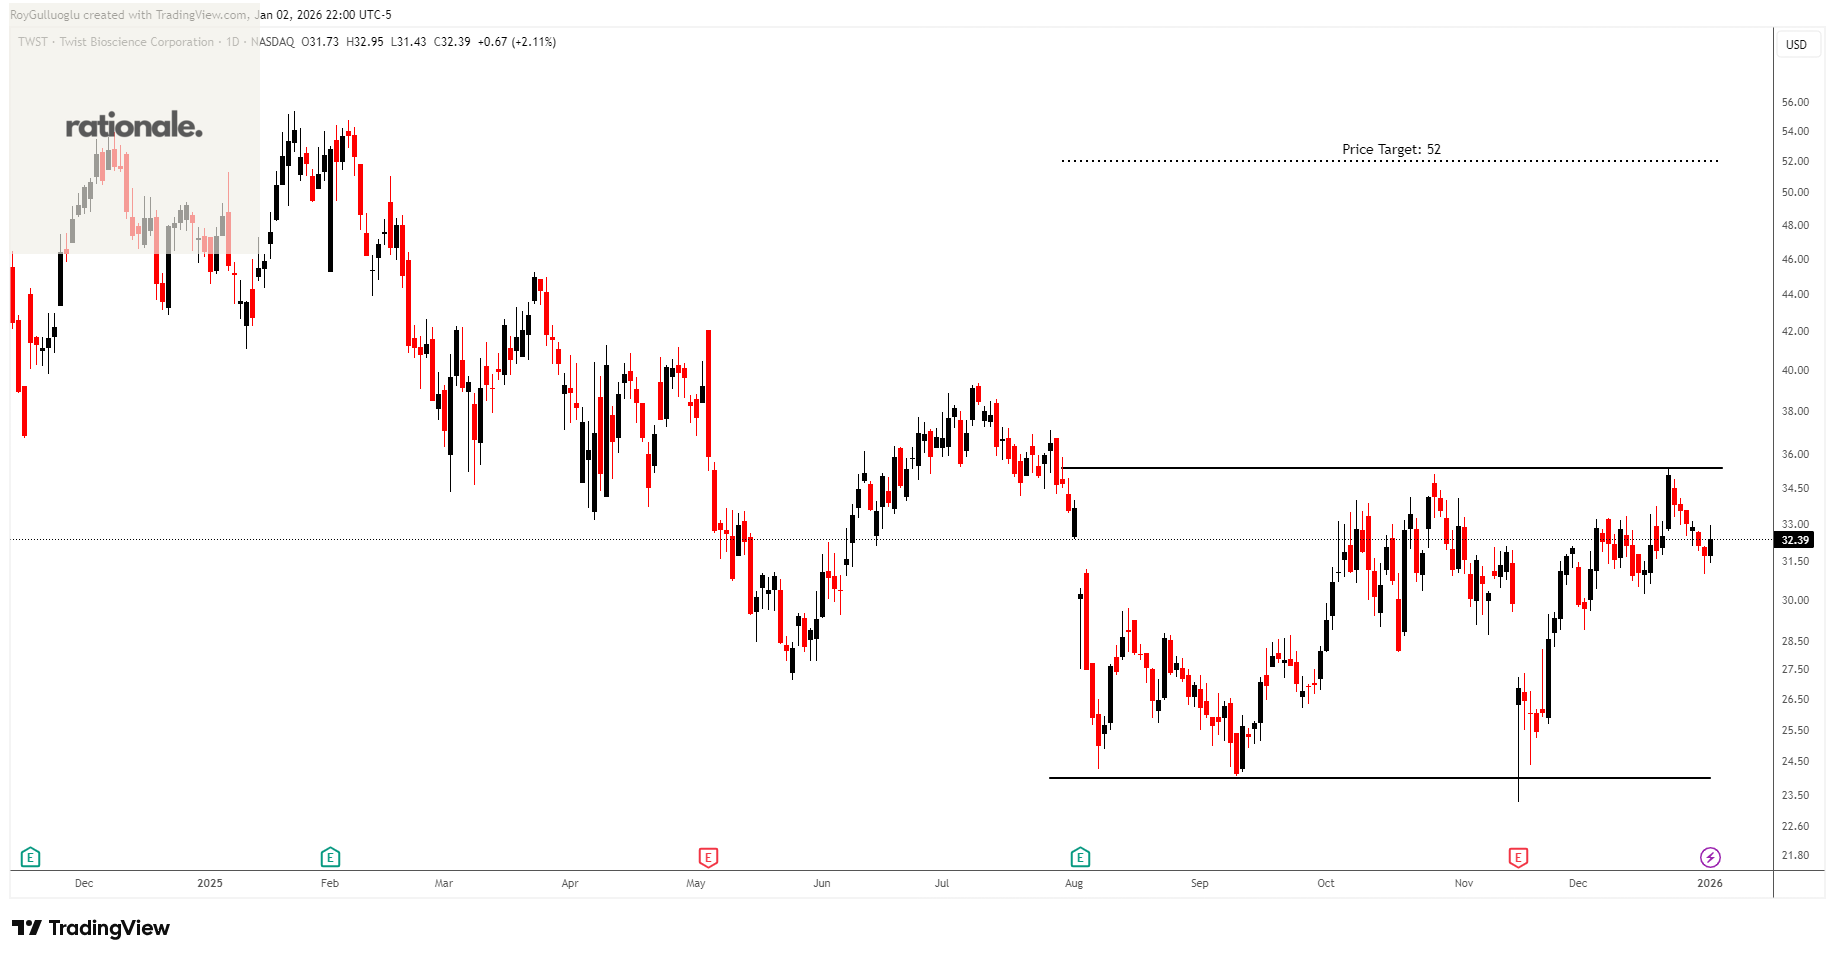
Twist Bioscience Corporation manufactures and sells synthetic DNA-based products.
The above daily chart formed an approximately 3-month-long rectangle chart pattern as a bullish reversal after a downtrend.
The horizontal boundary at 35.39 levels acts as a support within this pattern.
A daily close above 36.45 levels would validate the breakdown from the 3-month-long rectangle chart pattern.
Based on this chart pattern, the potential price target is 52 levels.
Bank of Hawaii Corporation-(BOH/NYSE)-Long Idea
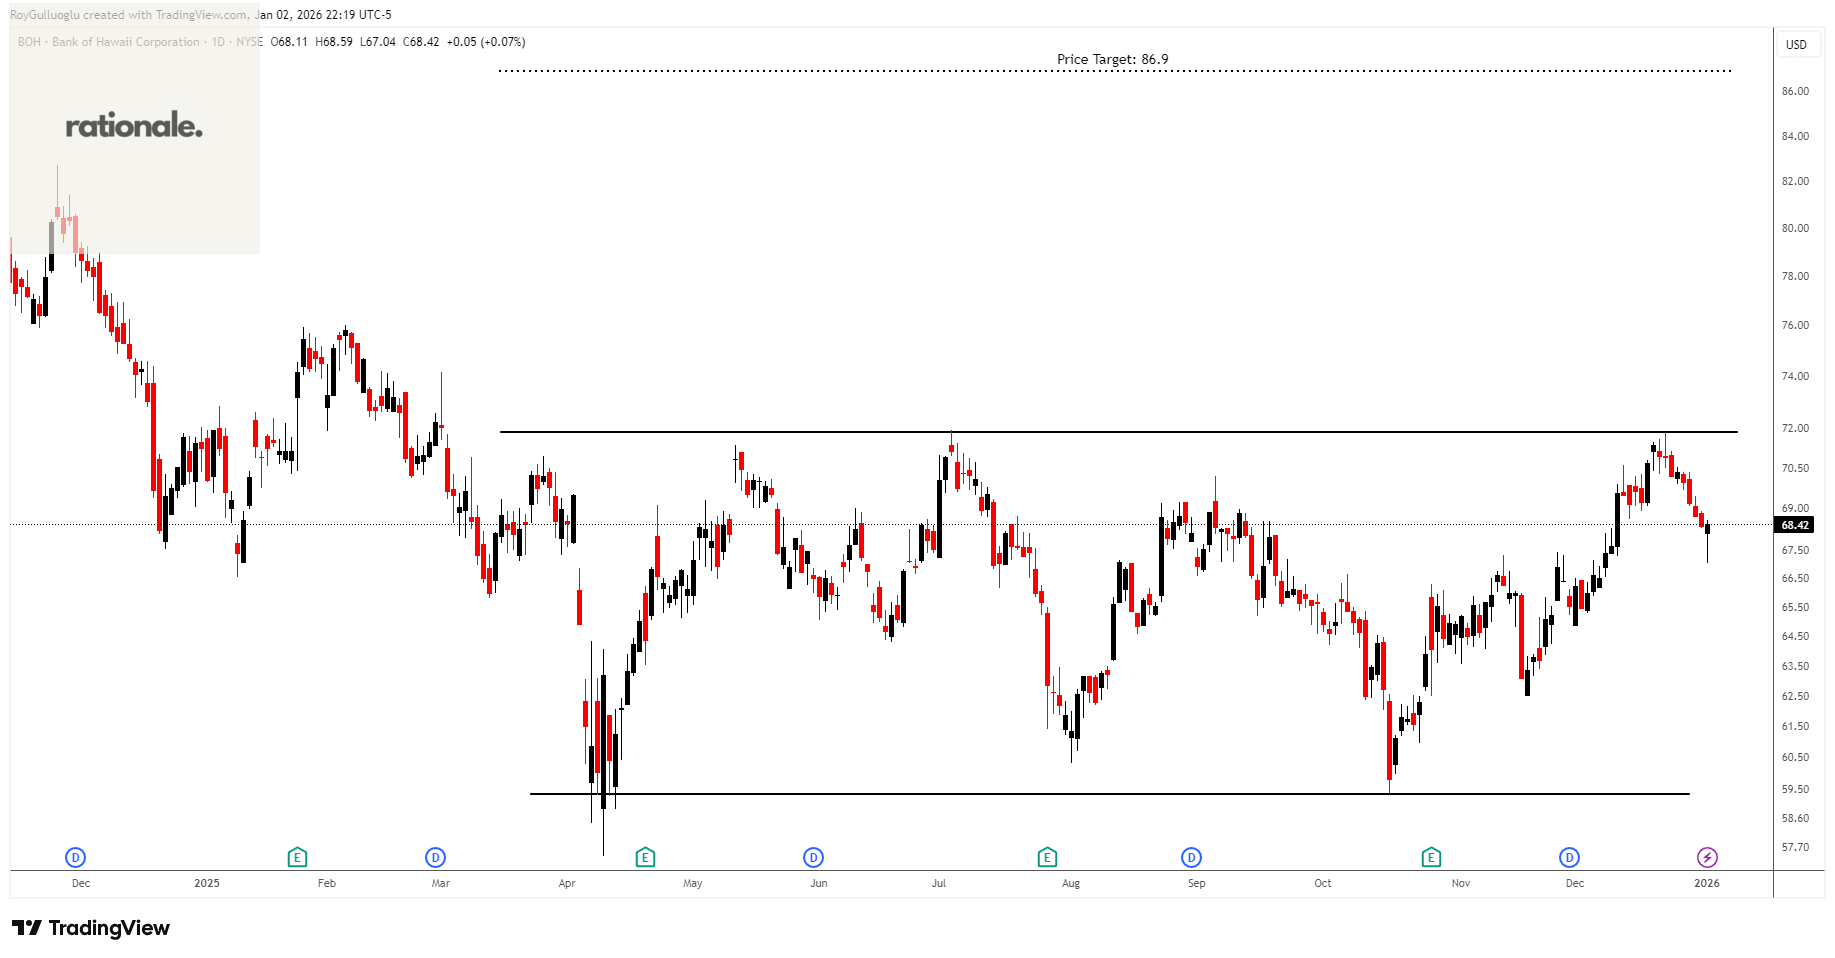
Bank of Hawaii Corporation operates as the bank holding company for Bank of Hawaii that provides various financial products and services in Hawaii, Guam, and other Pacific Islands
The above daily chart formed an approximately 6-month-long rectangle chart pattern as a bullish reversal after a downtrend.
The horizontal boundary at 71.85 levels acts as a resistance within this pattern.
A daily close above 74 levels would validate the breakout from the 6-month-long rectangle chart pattern.
Based on this chart pattern, the potential price target is 86.9 levels.
Star Group, L.P.-(SGU/NYSE)-Long Idea
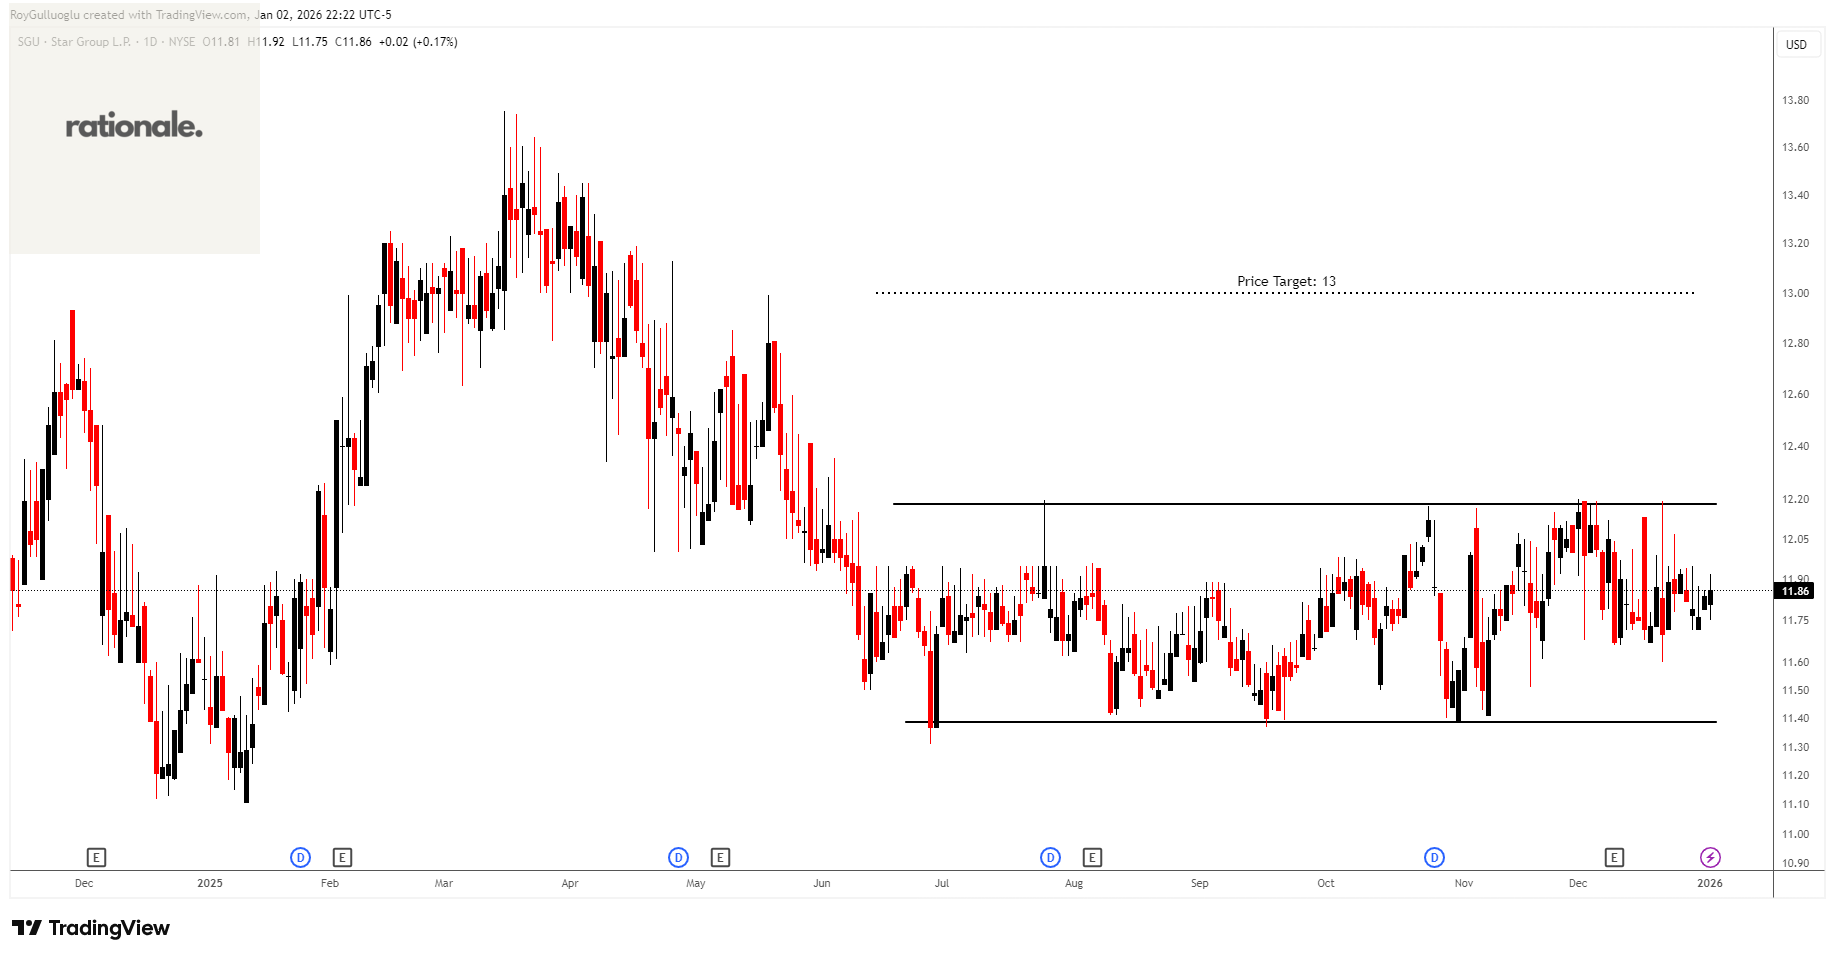
Star Group, L.P., together with its subsidiaries, provides home heating oil and propane products and services to residential and commercial customers in the United States.
The above daily chart formed an approximately 4-month-long rectangle chart pattern as a bullish reversal after a downtrend.
The horizontal boundary at 12.18 levels acts as a resistance within this pattern.
A daily close above 12.25 levels would validate the breakout from the 4-month-long rectangle chart pattern.
Based on this chart pattern, the potential price target is 13 levels.
Mavi Giyim Sanayi ve Ticaret A.S.-(MAVI/BIST)-Long Idea
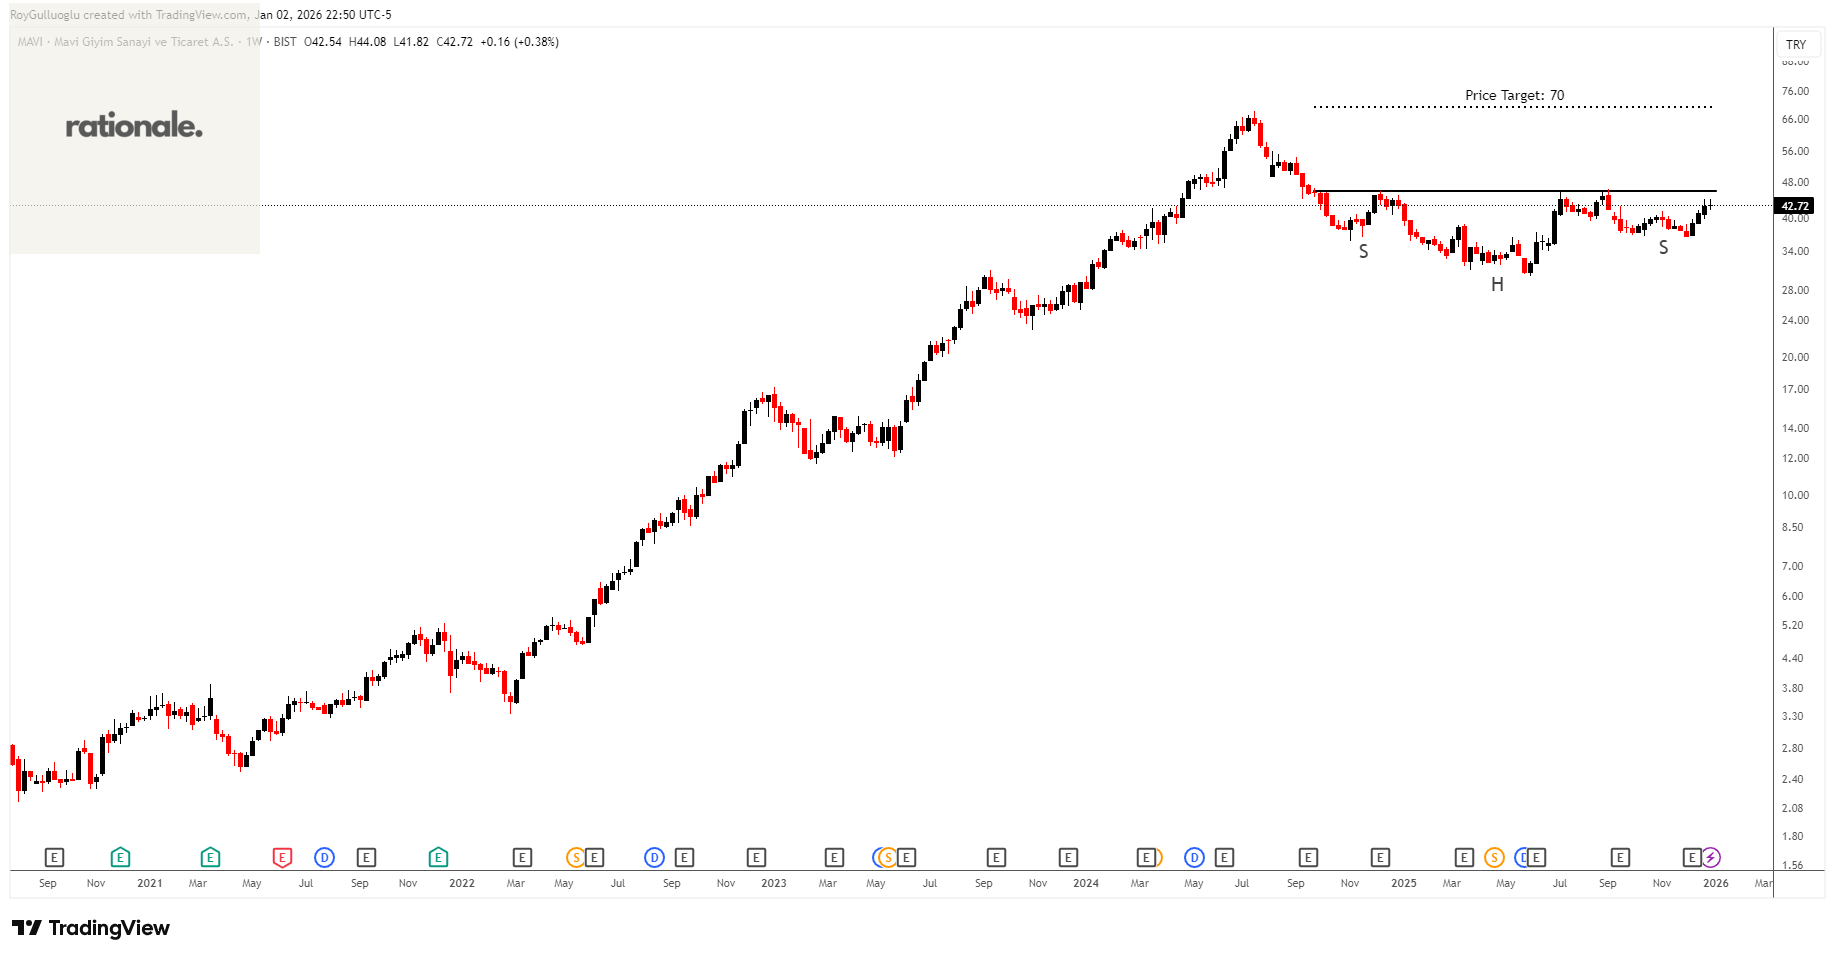
Mavi Giyim Sanayi ve Ticaret A.S. engages in the wholesale and retail sale of ready-to-wear denim apparel in Turkey and internationally.
The above weekly chart formed an approximately 15-month-long H&S bottom chart pattern as a bullish reversal after a downtrend.
The horizontal boundary at 45.84 levels acts as a resistance within this pattern.
A daily close above 47.21 levels would validate the breakout from the 15-month-long H&S bottom chart pattern.
Based on this chart pattern, the potential price target is 70 levels.
Teşekkürler Roy