


Zscaler, Inc.-(ZS/NASDAQ)-Long Idea
Zscaler, Inc. operates as a cloud security company worldwide.
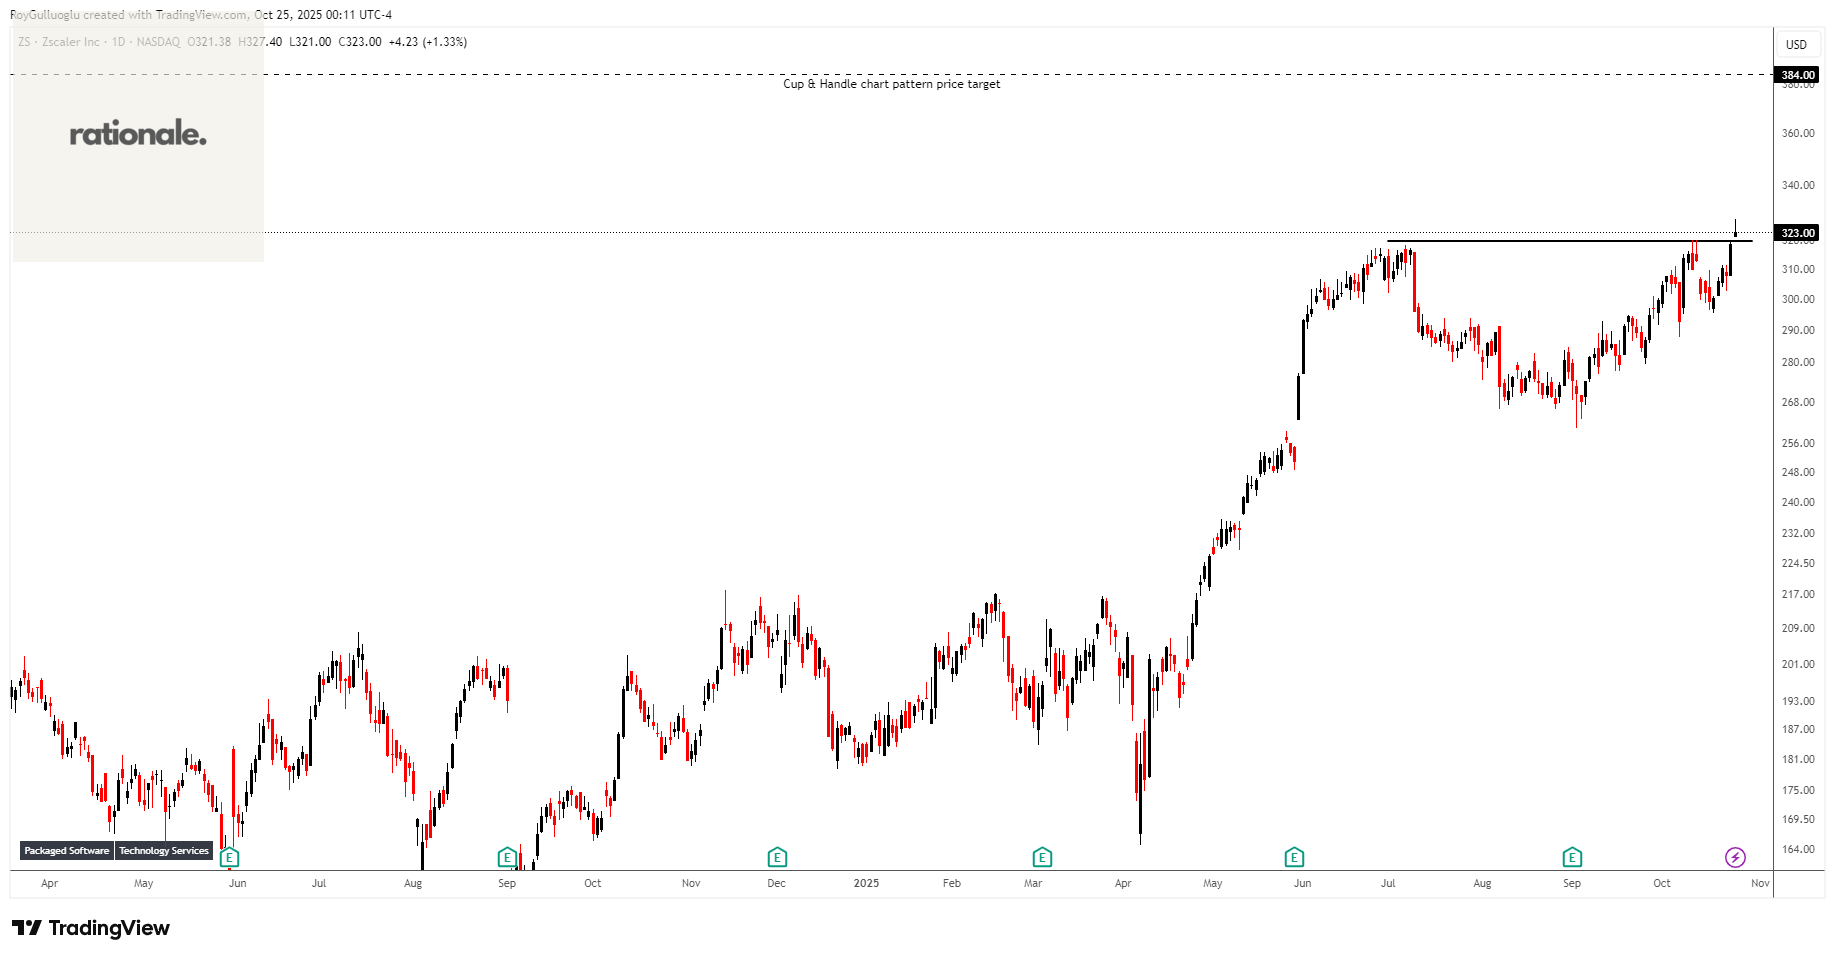
The above weekly chart formed an approximately 3-month-long cup & handle chart pattern as a bullish continuation after an uptrend.
The horizontal boundary at 319.77 levels acts as a resistance within this pattern.
A daily close above 329.3 levels would validate the breakout from the 3-month-long cup & handle chart pattern.
Based on this chart pattern, the potential price target is 384 levels.
Littelfuse, Inc.-(LFUS/NASDAQ)-Long Idea
Littelfuse, Inc. designs, manufactures, and sells electronic components, modules, and subassemblies.
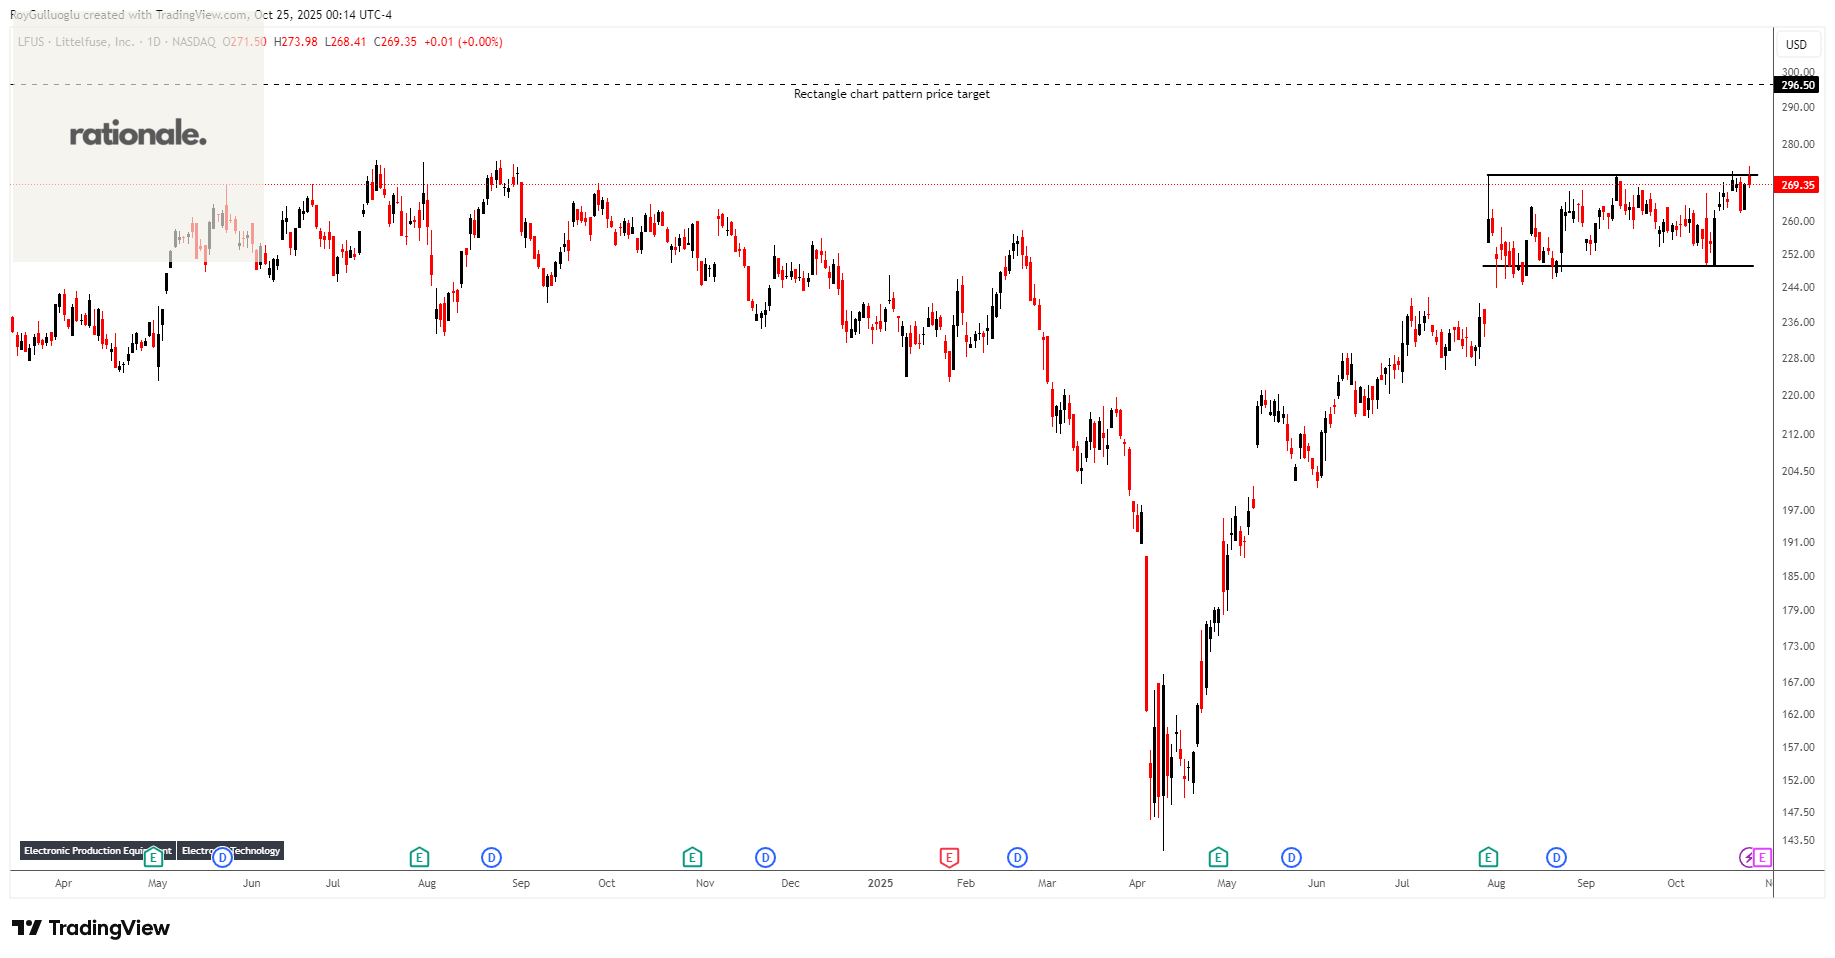
The above daily chart formed an approximately 2-month-long rectangle chart pattern as a bullish continuation after an uptrend.
The horizontal boundary at 271.72 levels acts as a resistance within this pattern.
A daily close above 279.8 levels would validate the breakout from the 2-month-long rectangle chart pattern.
Based on this chart pattern, the potential price target is 296.5 levels.
CSG Systems International, Inc.-(CSGS/NASDAQ)-Long Idea
CSG Systems International, Inc., together with its subsidiaries, provides revenue management and digital monetization, customer experience, and payment solutions primarily to the communications industry in the Americas, Europe, the Middle East, Africa, and the Asia Pacific.
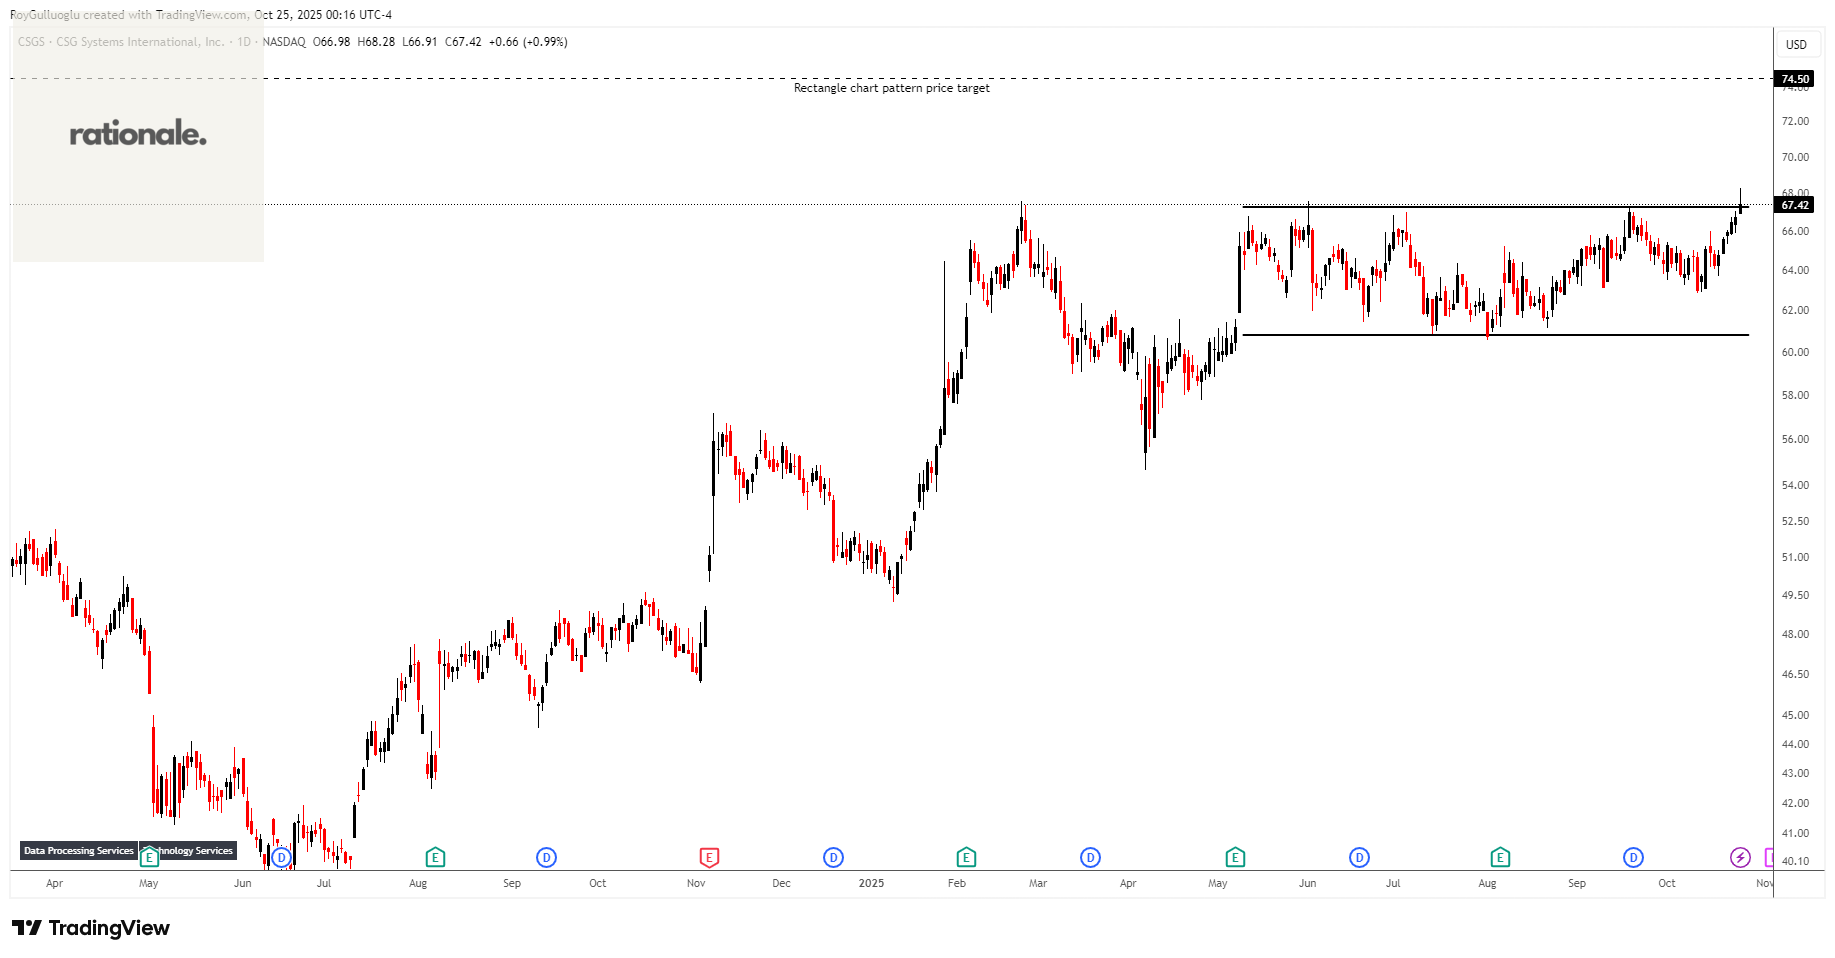
The above daily chart formed an approximately 4-month-long rectangle chart pattern as a bullish continuation after an uptrend.
The horizontal boundary at 67.26 levels acts as a resistance within this pattern.
A daily close above 69.4 levels would validate the breakout from the 2-month-long rectangle chart pattern.
Based on this chart pattern, the potential price target is 74.5 levels.
Brookfield Renewable Partners L.P.-(BEP/NYSE)-Long Idea
Brookfield Renewable Partners L.P. owns a portfolio of renewable power generating facilities in North America, Colombia, and Brazil.
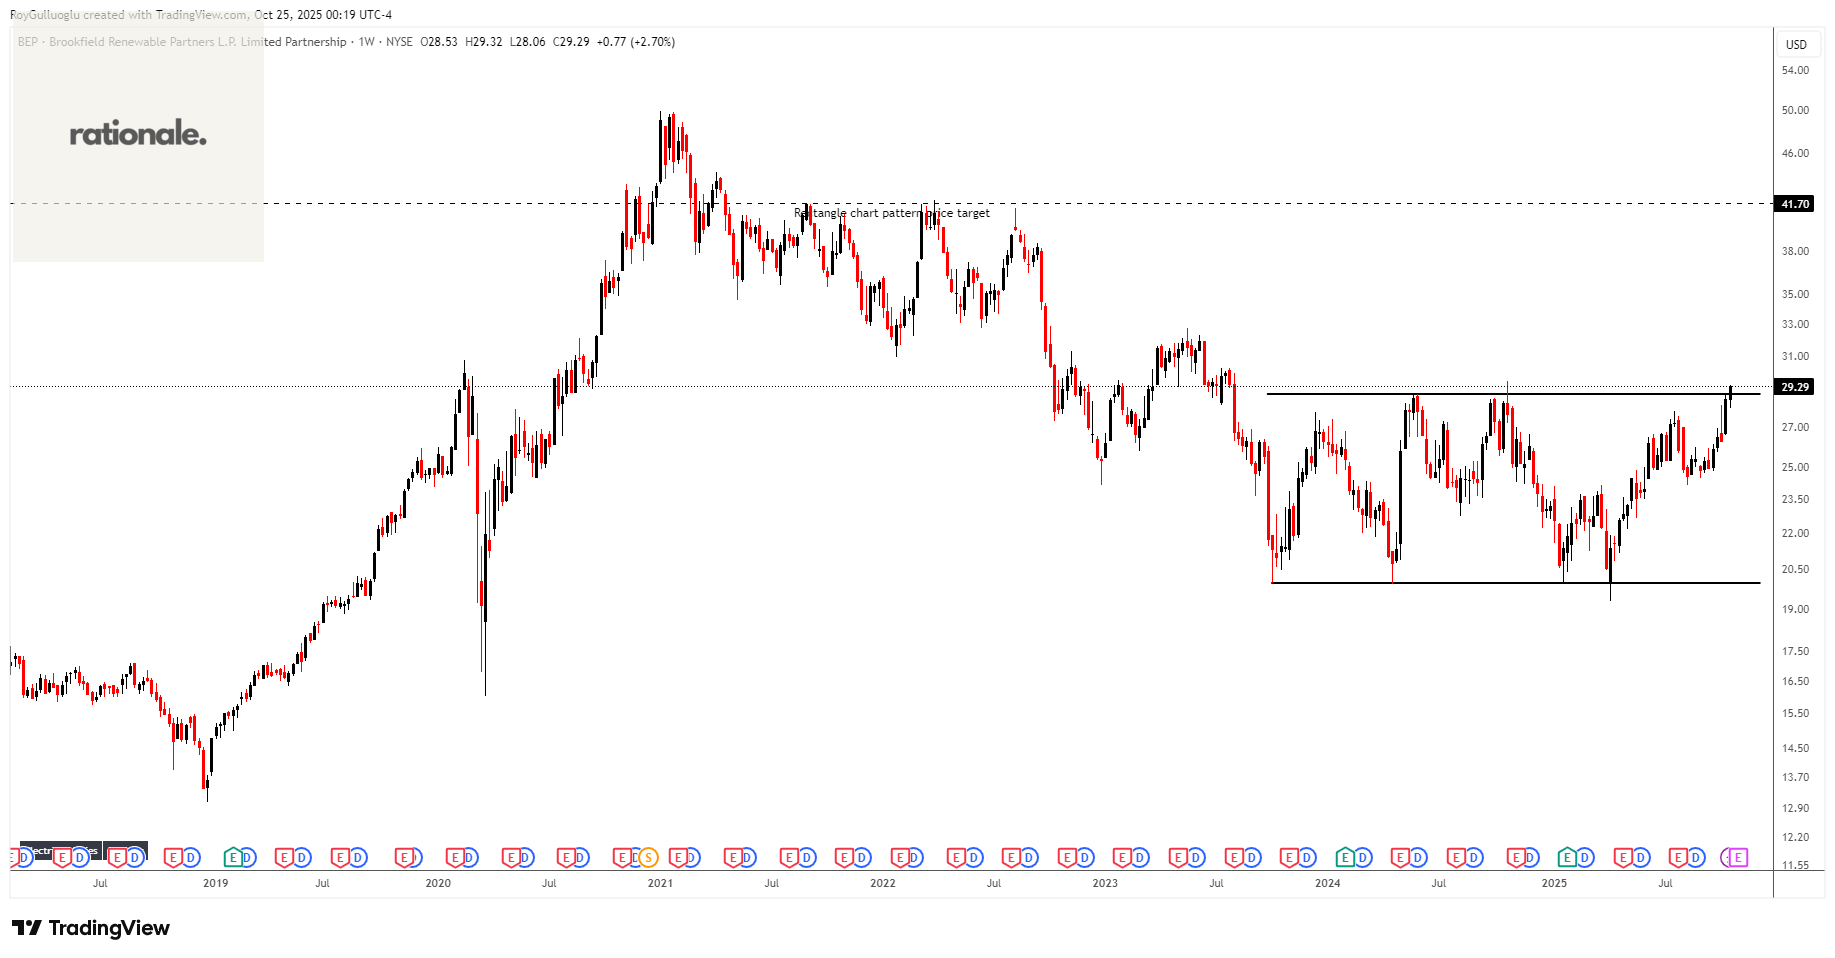
The above weekly chart formed an approximately 25-month-long rectangle chart pattern as a bullish reversal after a downtrend.
The horizontal boundary at 28.8 levels acts as a resistance within this pattern.
A daily close above 29.6 levels would validate the breakout from the 25-month-long rectangle chart pattern.
Based on this chart pattern, the potential price target is 41.7 levels.
Generac Holdings Inc.-(GNRC/NYSE)-Long Idea
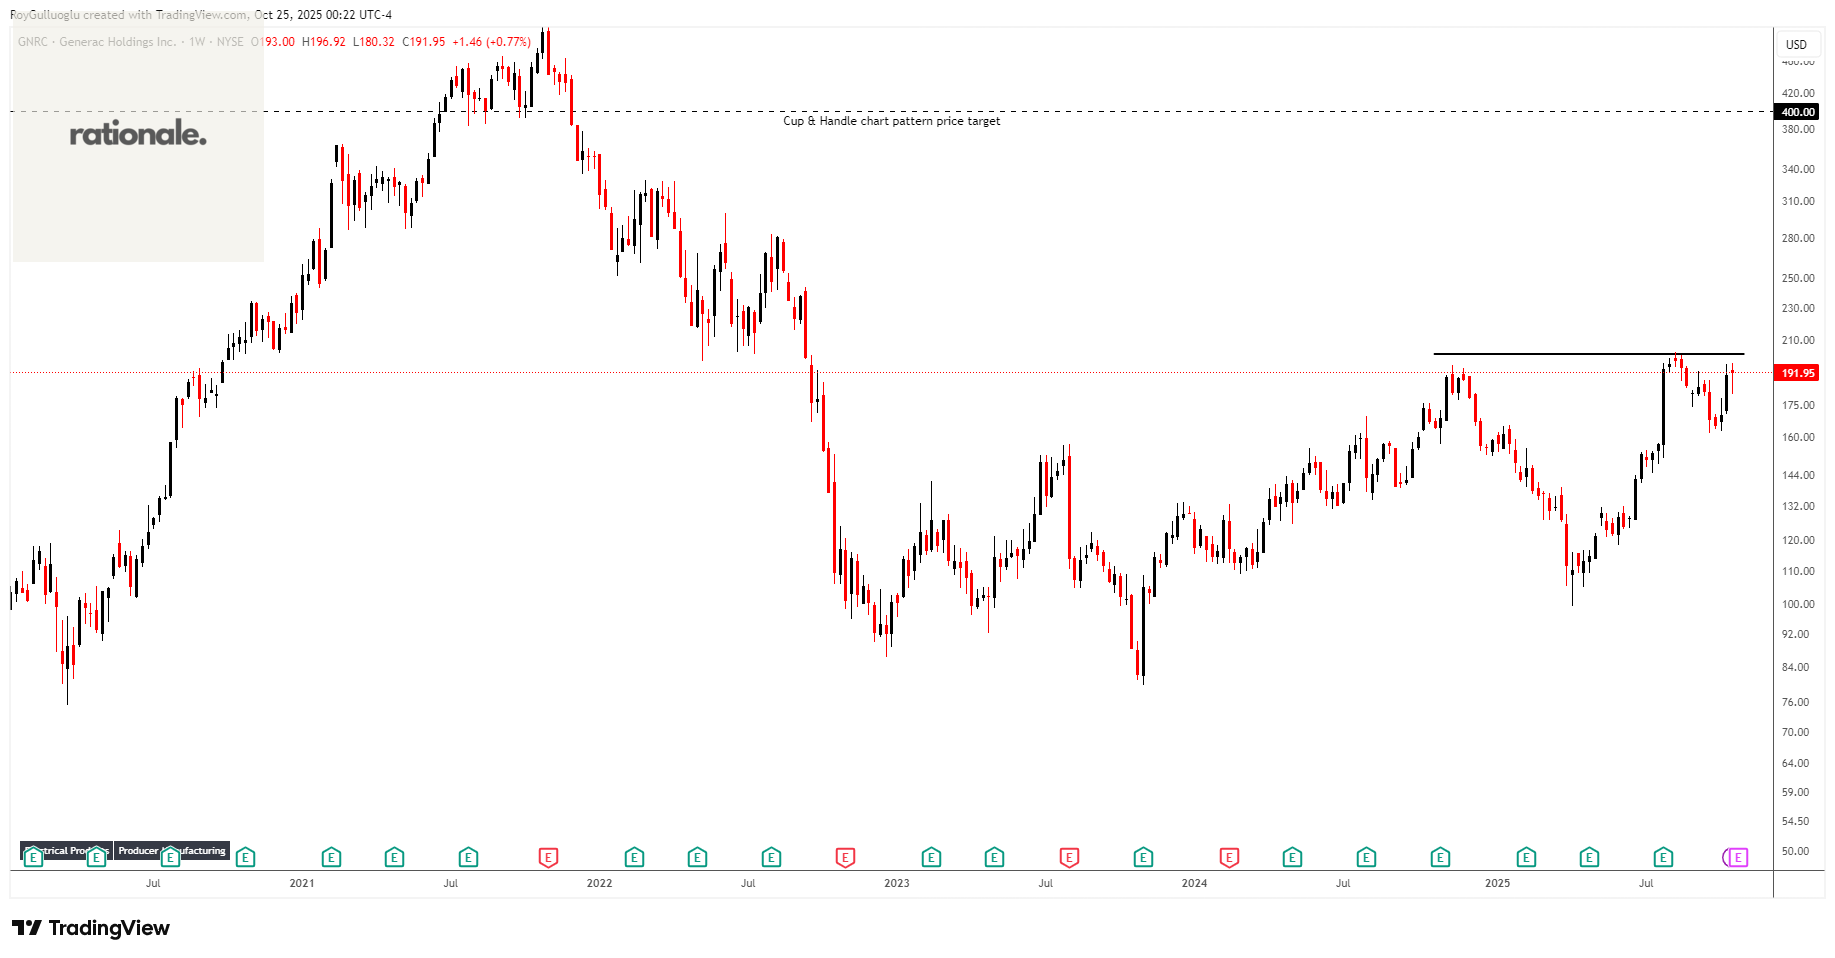
Generac Holdings Inc. designs, manufactures, and distributes energy technology products and solution worldwide.
The above weekly chart formed an approximately 12-month-long ascending triangle chart pattern as a bullish reversal after a downtrend.
The horizontal boundary at 202.18 levels acts as a resistance within this pattern.
A daily close above 208.25 levels would validate the breakout from the 12-month-long ascending triangle chart pattern.
Based on this chart pattern, the potential price target is 400 levels.