


New setups
TICKERS: IOT(NYSE), OBDC(NYSE), MCD(NYSE), HBAN(NASDAQ), 6448(TSE), 7167(TSE), 300418(SZSE), MBG(XETR), OR(EURONEXT), HVO(LSE), DCC(LSE), TUPRS(BIST)
Samsara Inc.-(IOT/NYSE)-Long Idea
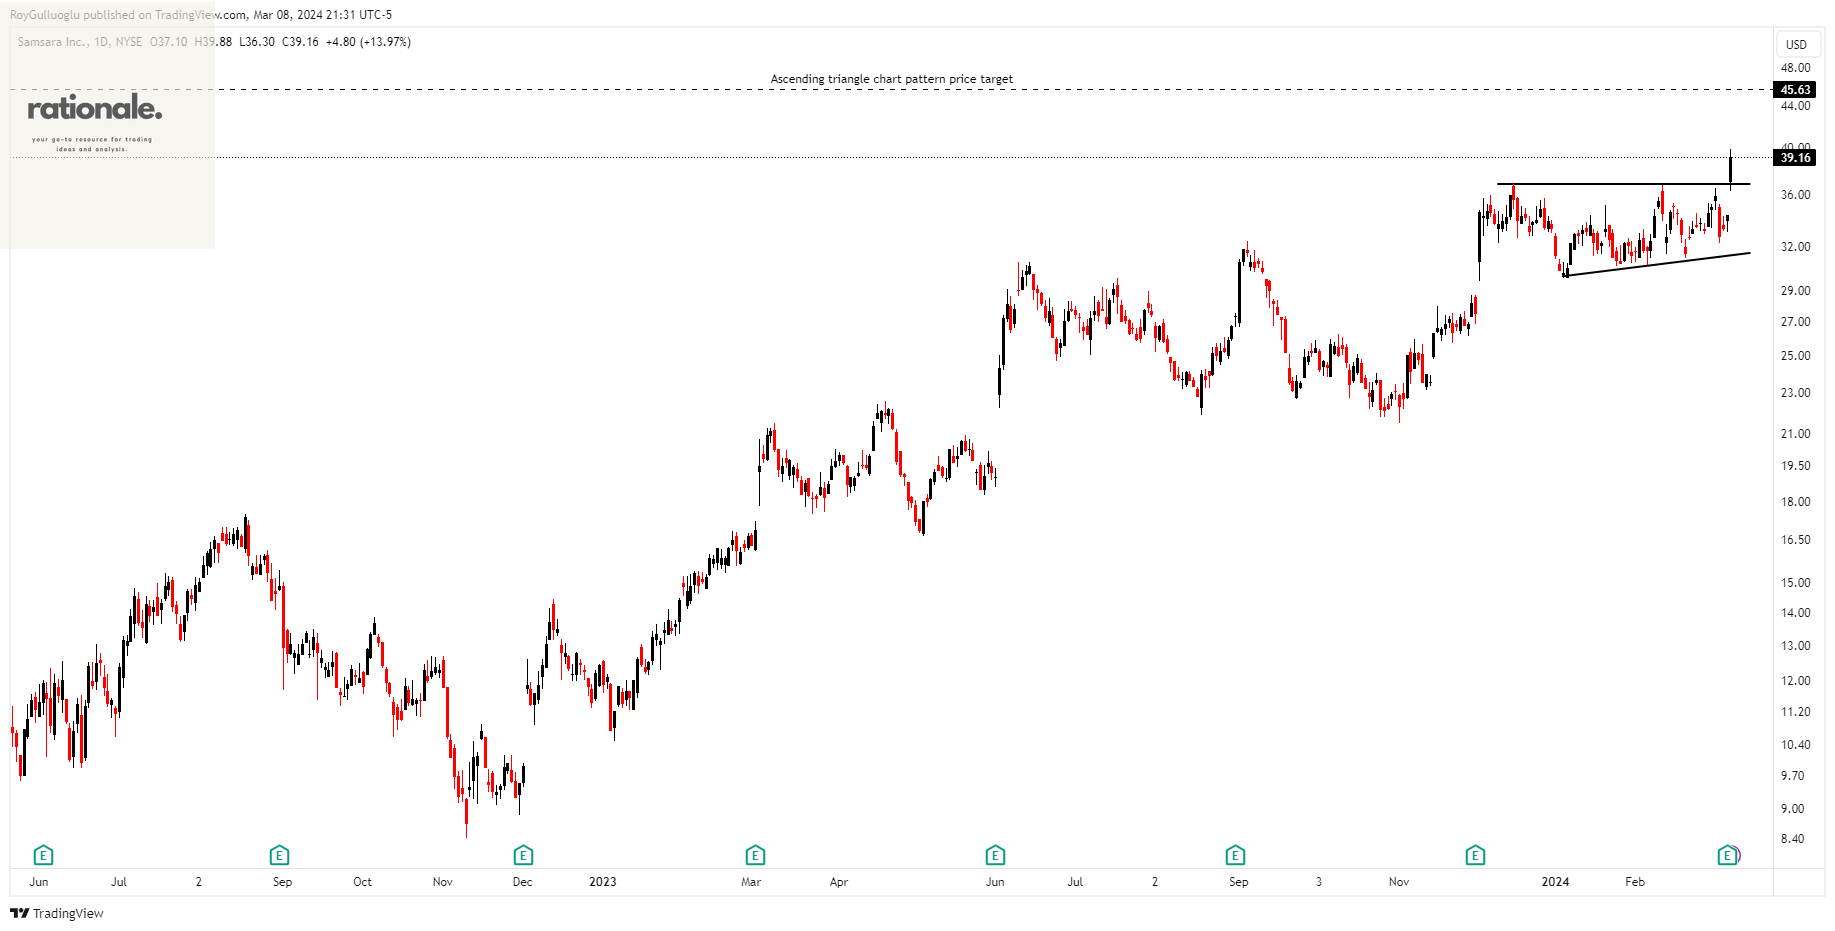
Samsara Inc. provides solutions that connect physical operations data to its Connected Operations Cloud in the United States and internationally.
The above daily chart formed an approximately 2-month-long ascending triangle chart pattern as a bullish continuation after an uptrend.
The horizontal boundary at 36.9 levels acted as a resistance within this pattern.
A daily close above 38 levels validated the breakout from the 2-month-long ascending triangle chart pattern.
Based on this chart pattern, the potential price target is 45.6 levels.
IOT, classified under the "technology" sector, falls under the “Large Cap - Growth” stock category.
Blue Owl Capital Corporation-(OBDC/NYSE)-Long Idea
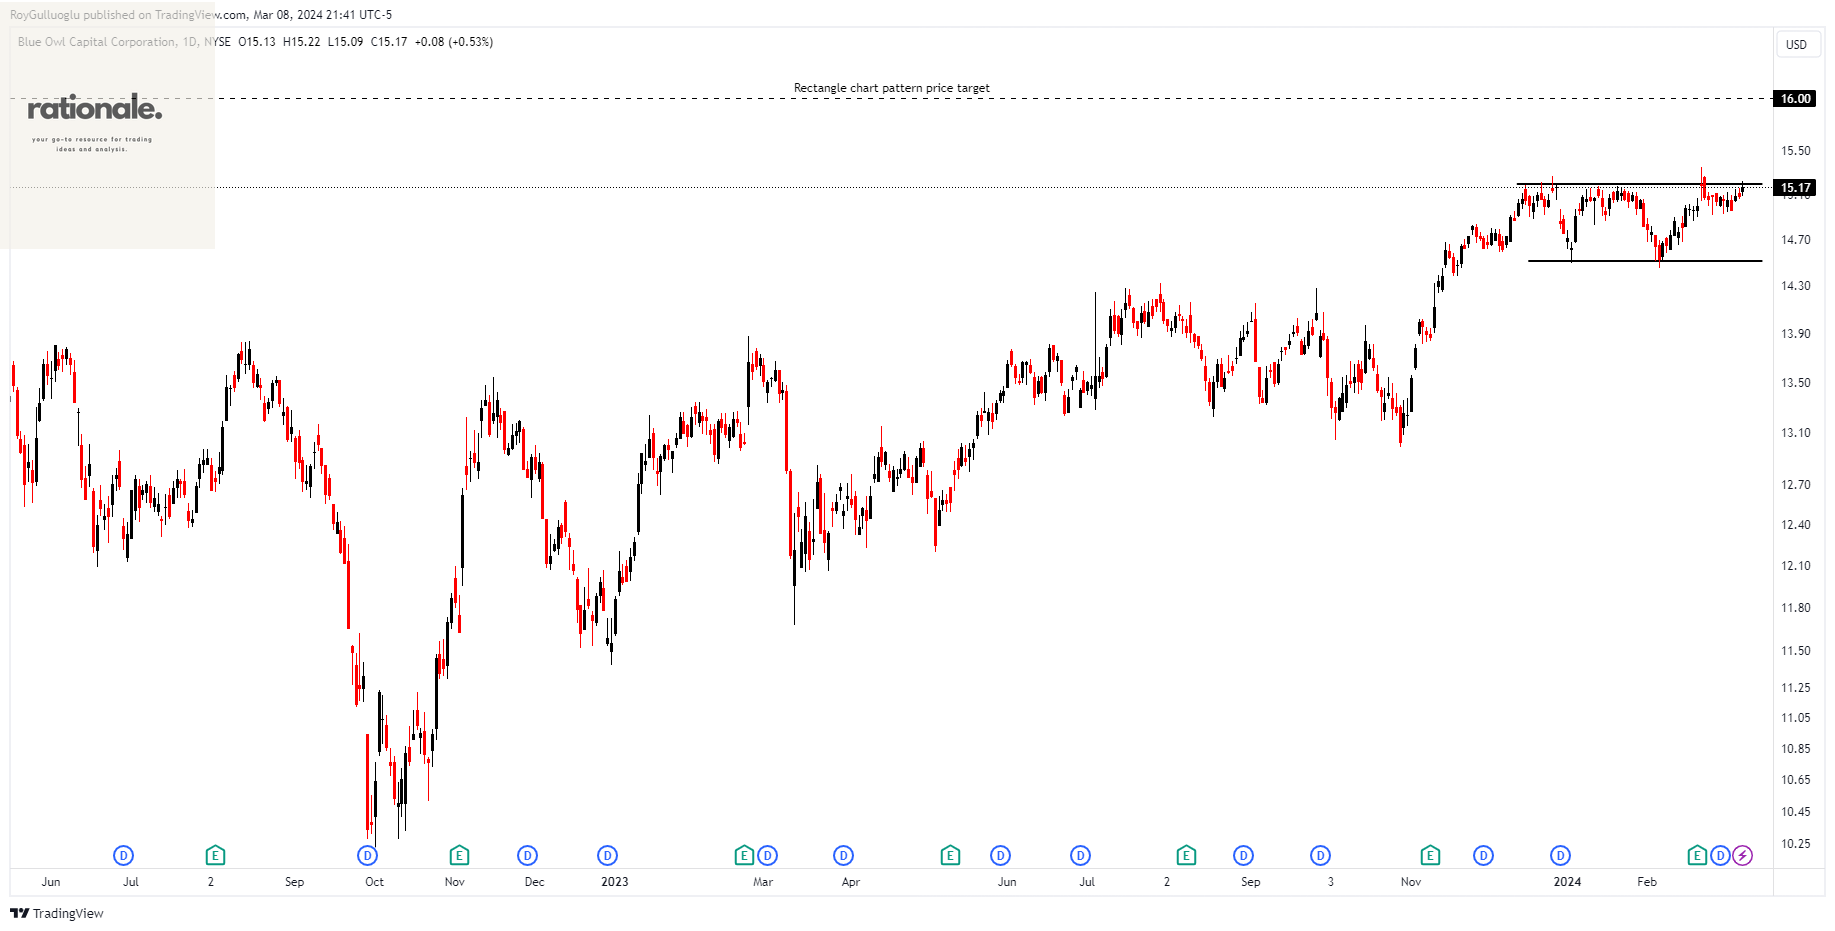
Blue Owl Capital Corporation operates as a business development company with a focus on direct and fund of fund investments. The company engages in a variety of investment types, including senior secured loans, direct lending, unsecured loans, subordinated loans, mezzanine loans, as well as equity-related securities like warrants and preferred stocks.
The above daily chart formed an approximately 2-month-long rectangle chart pattern as a bullish continuation after an uptrend.
The horizontal boundary at 15.2 levels acts as a resistance within this pattern.
A daily close above 15.65 levels would validate the breakout from the 2-month-long rectangle chart pattern.
Based on this chart pattern, the potential price target is 16 levels.
OBDC, classified under the "financial services" sector, falls under the “Mid Cap - Income” stock category.
McDonalds Corporation-(MCD/NYSE)-Long Idea
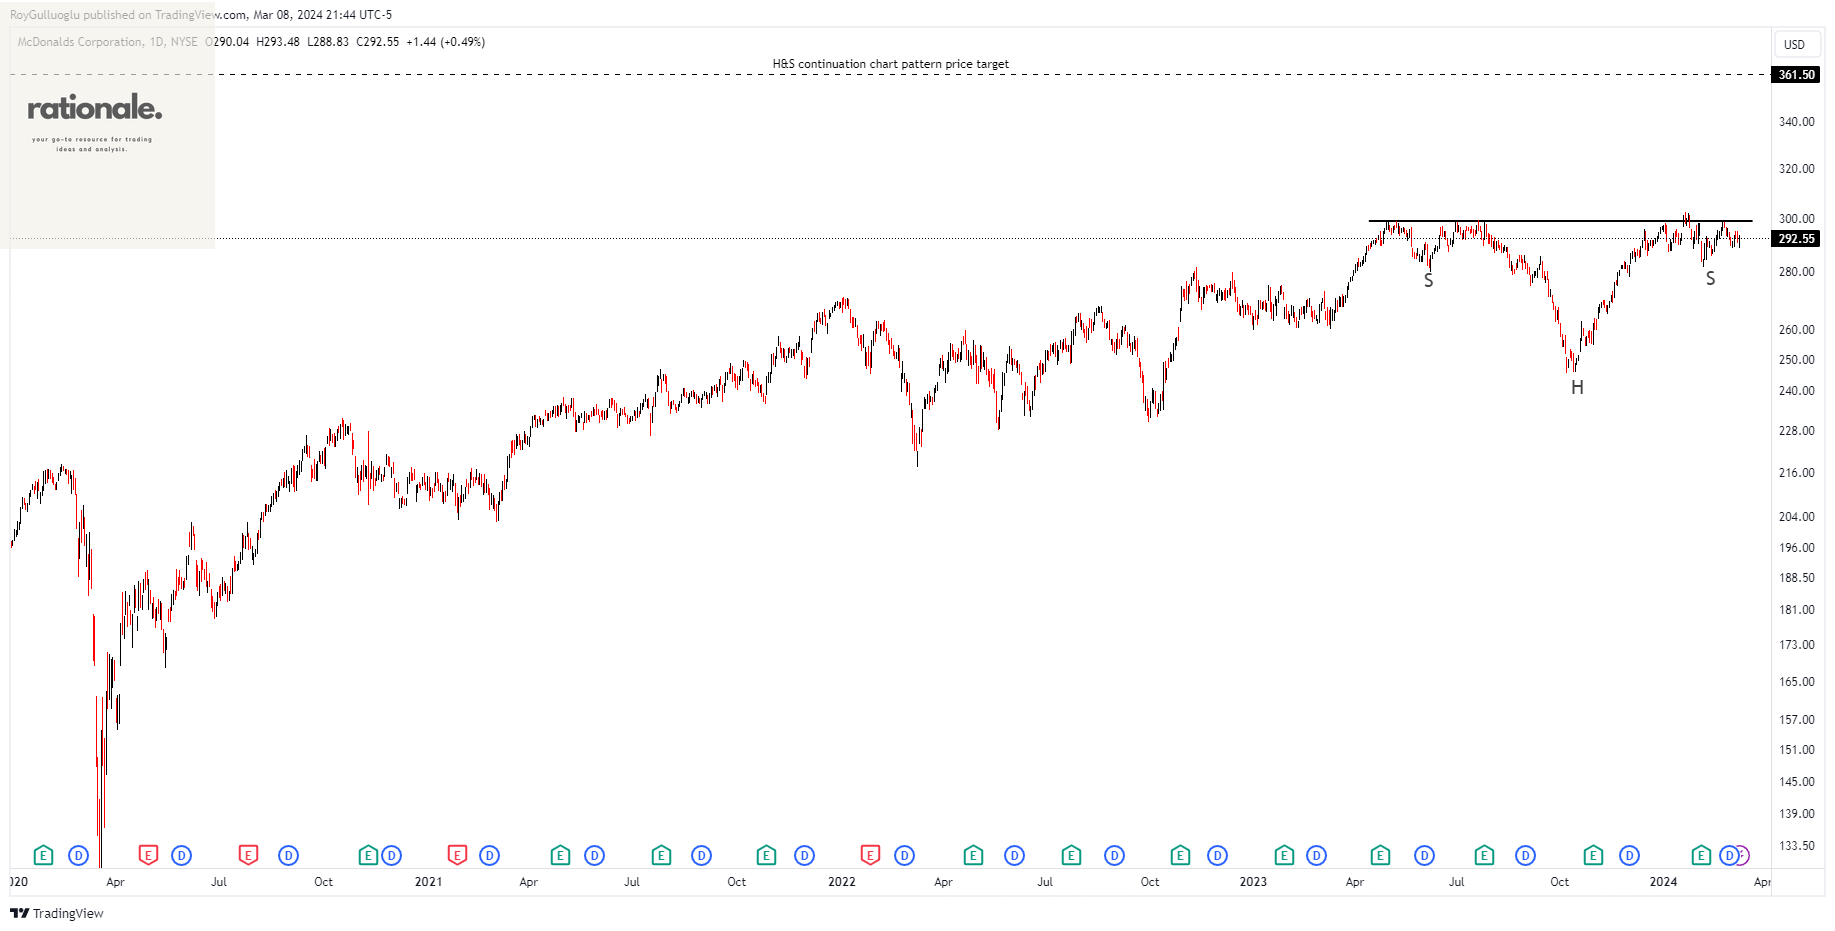
McDonald's Corporation manages and licenses restaurants globally under the McDonald's brand, both within the United States and internationally.
The above daily chart formed an approximately 6-month-long H&S continuation chart pattern as a bullish continuation after an uptrend.
Within this pattern, the horizontal boundary at 299 levels acts as a resistance.
A daily close above 308 levels would validate the breakout from the 6-month-long H&S continuation chart pattern.
Based on this chart pattern, the potential price target is 361.5 levels.
MCD, classified under the "consumer cyclicals" sector, falls under the “Large Cap - Growth” stock category.
Huntington Bancshares Incorporated-(HBAN/NASDAQ) - Long Idea
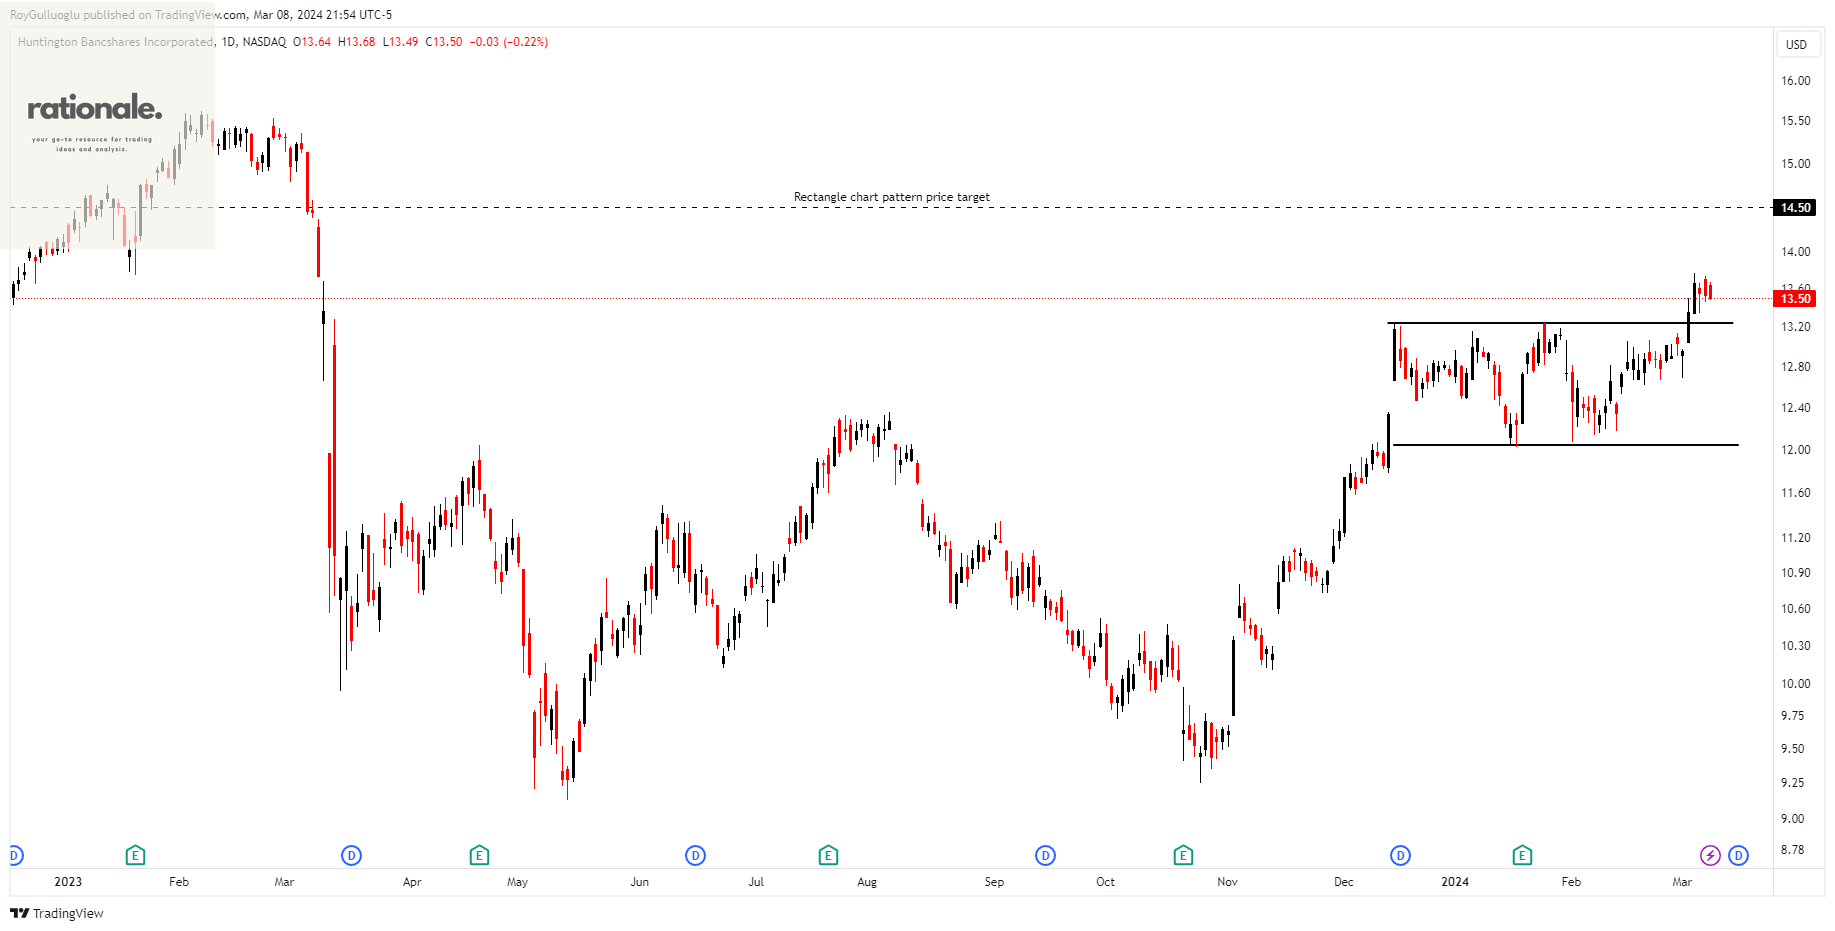
Huntington Bancshares Incorporated serves as the holding company for The Huntington National Bank, offering a range of commercial, consumer, and mortgage banking services throughout the United States.
The above daily chart formed an approximately 2-month-long rectangle chart pattern as a bullish continuation after an uptrend
The boundary at 13.24 levels acted as a resistance within this pattern.
A daily close above 13.63 levels validated the breakout from the 2-month-long rectangle chart pattern.
Based on this chart pattern, the potential price target is 14.5 levels.
HBAN, classified under the "financial services" sector, falls under the “Large Cap - Income” stock category.
Brother Industries, Ltd.-(6448/TSE)-Long Idea
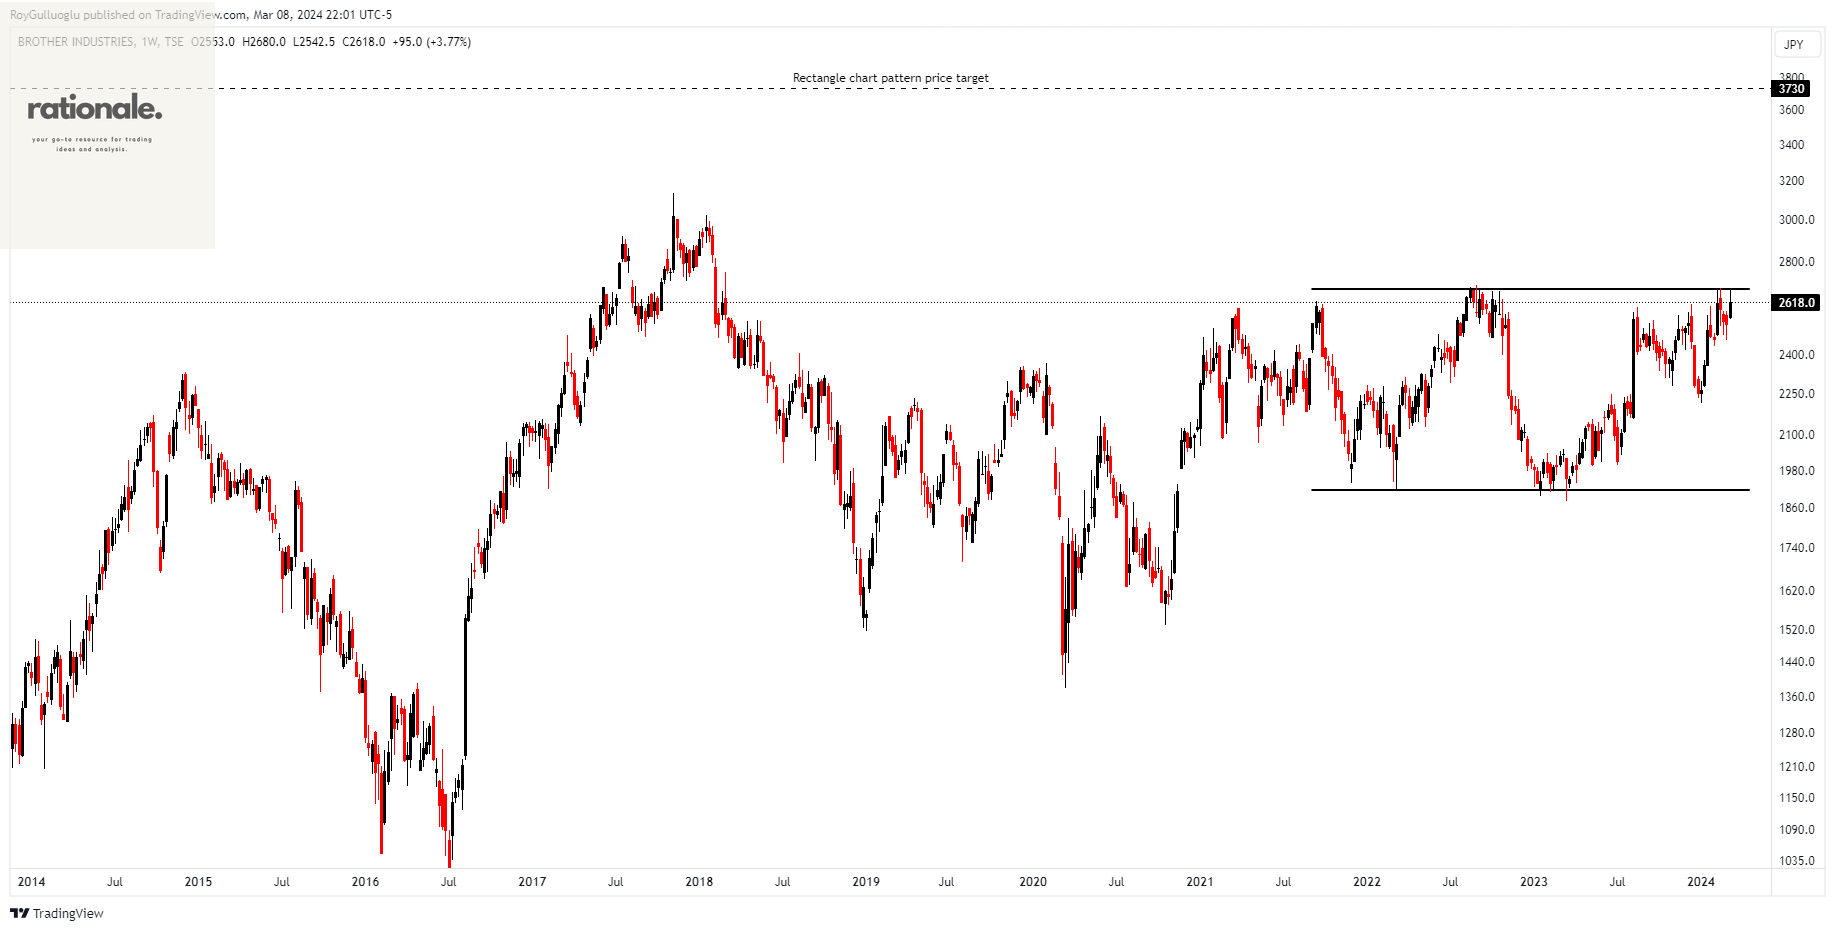
Brother Industries, Ltd. produces and markets communication and printing equipment worldwide, including in Japan, the Americas, Europe, Asia, Oceania, the Middle East, and Africa.
The above weekly chart formed an approximately 4-month-long rectangle chart pattern as a bullish continuation after an uptrend.
The horizontal boundary at 2673.5 levels acts as a resistance within this pattern.
A daily close above 2753 levels would validate the breakout from the 4-month-long rectangle chart pattern.
Based on this chart pattern, the potential price target is 3730 levels.
6448, classified under the "industrials" sector, falls under the “Mid Cap - Value” stock category.
Mebuki Financial Group,Inc.-(7167/TSE)-Long Idea
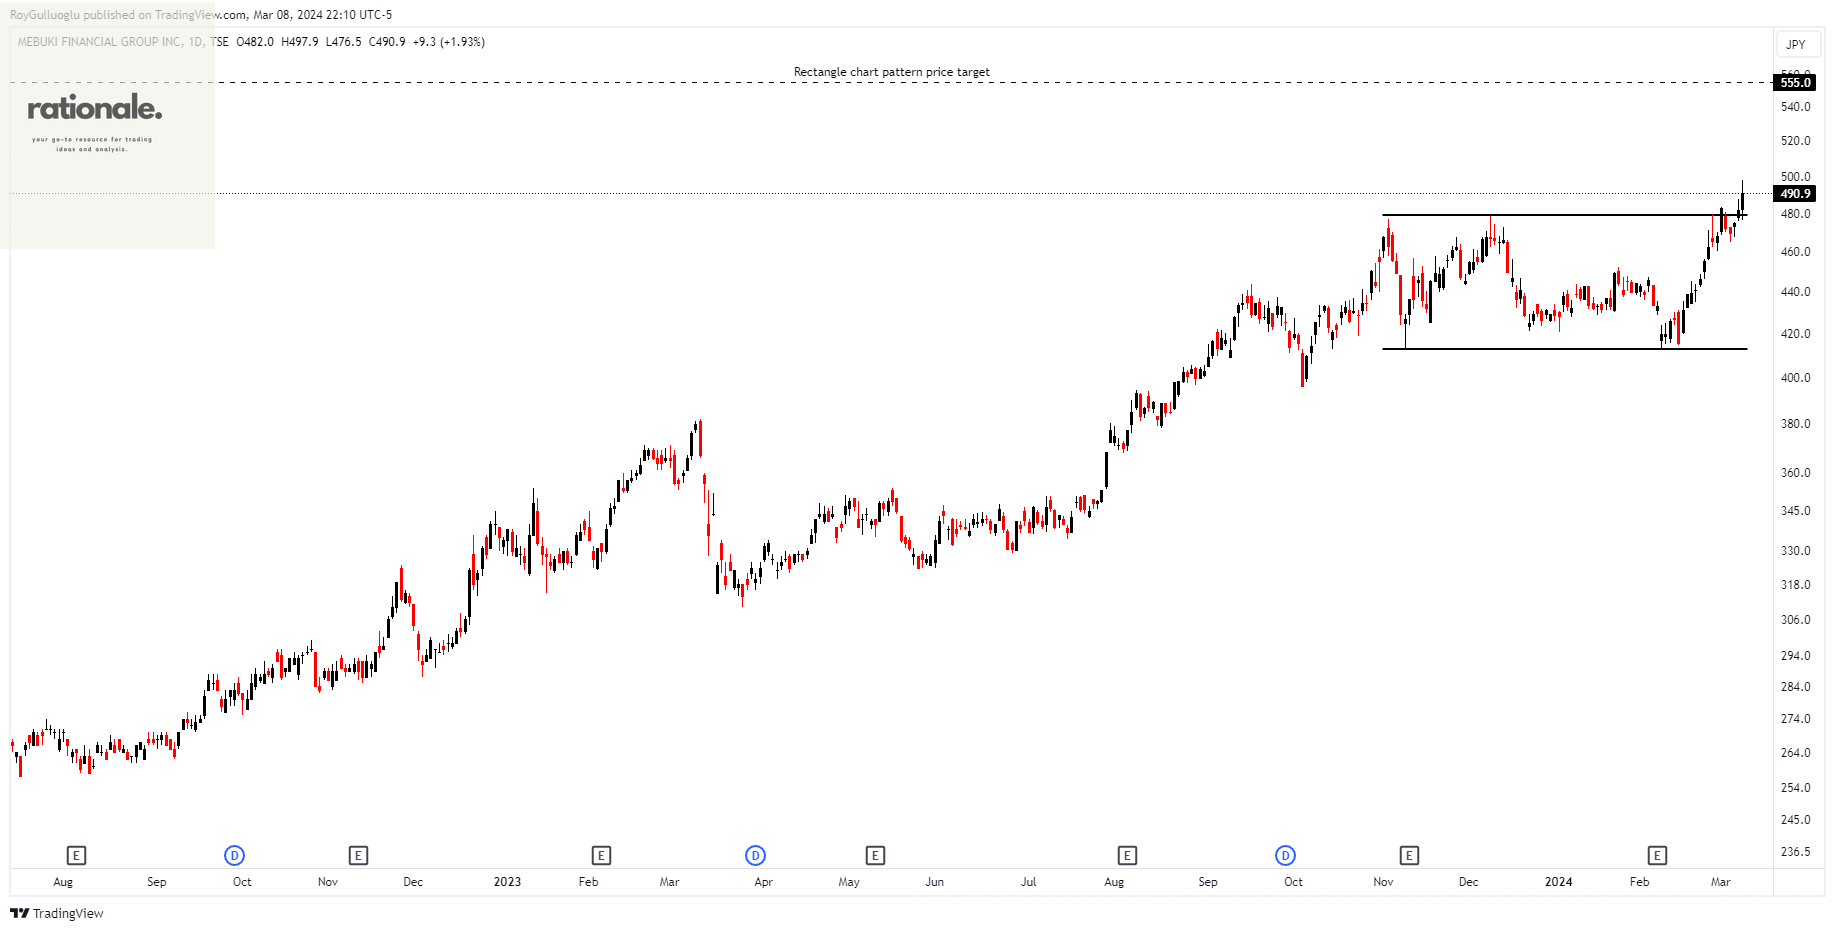
Mebuki Financial Group, Inc., along with its subsidiaries, offers banking products and services on both domestic and international fronts. The company accepts a range of deposits and extends loan services.
The above daily chart formed an approximately 3-month-long rectangle chart pattern as a bullish continuation after an uptrend
The boundary at 479 levels acts as a resistance within this pattern.
A daily close above 493.37 levels would validate the breakout from the 3-month-long rectangle chart pattern.
Based on this chart pattern, the potential price target is 555 levels.
7167, classified under the "financial services" sector, falls under the “Mid Cap - Income” stock category.
Kunlun Tech Co., Ltd.-(300418/SZSE)-Long Idea
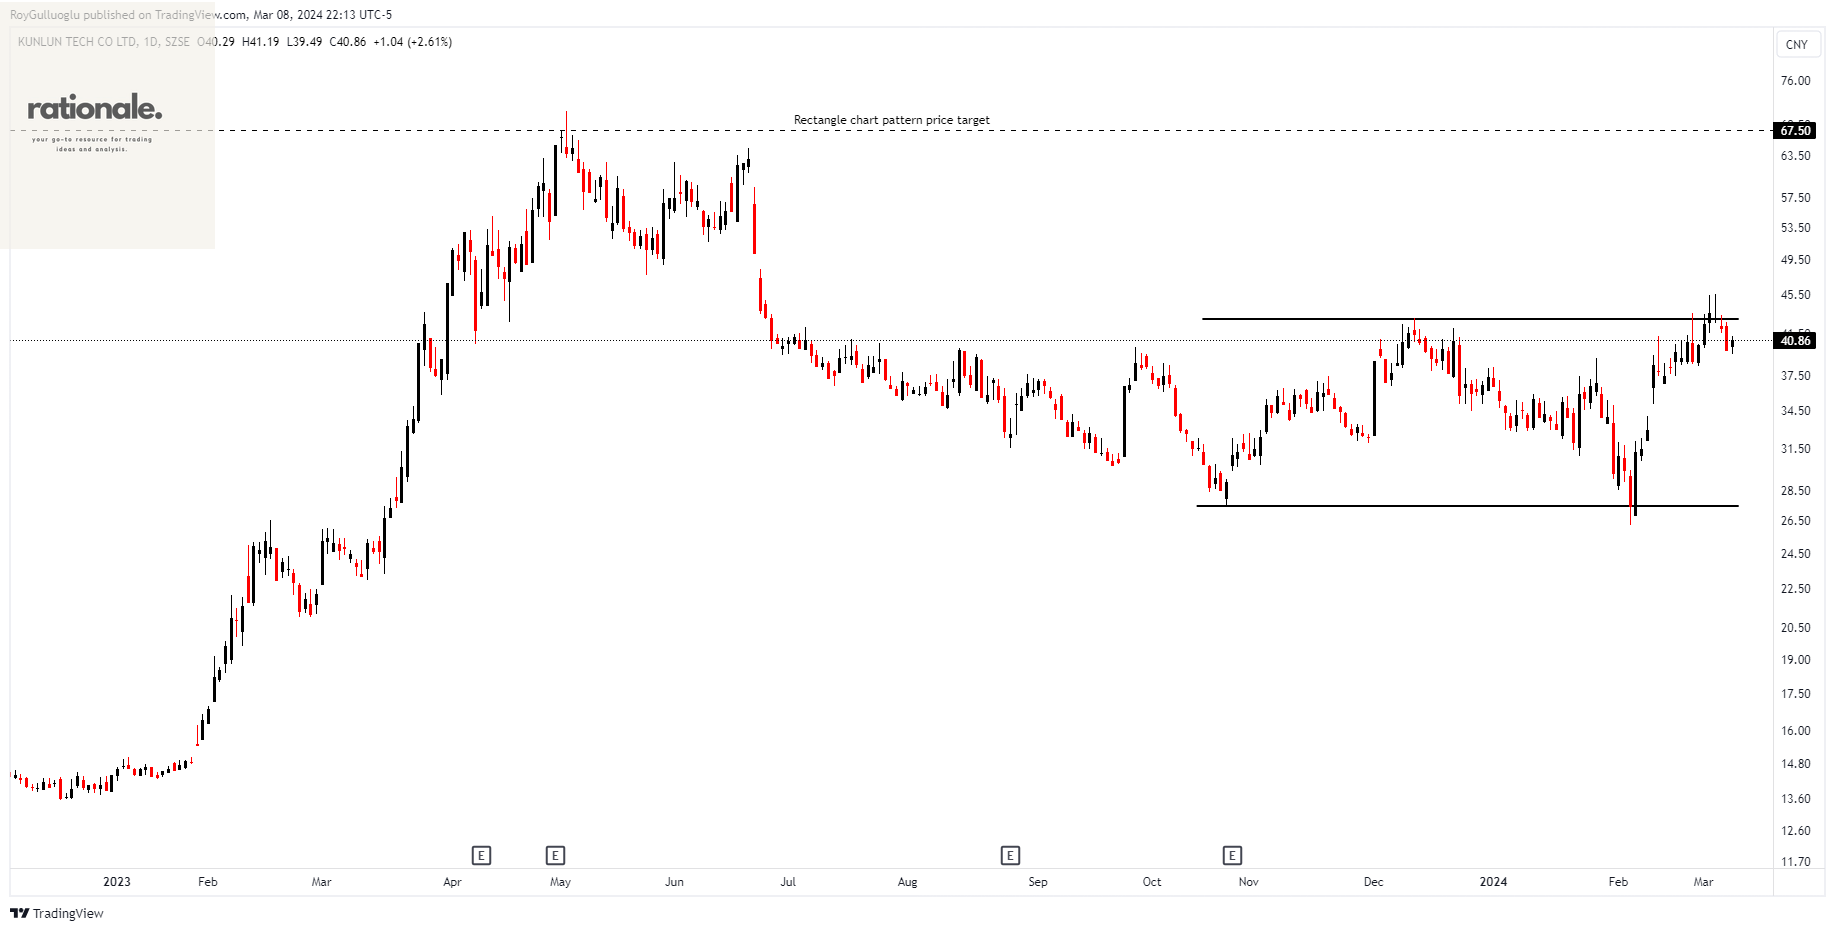
Kunlun Tech Co., Ltd. is engaged in the development and global publication of web games, with operations spanning China and international markets. The company oversees platforms such as Opera, focusing on information distribution and the metaverse; StarX, a social entertainment platform; and XIANLAIHUYU, dedicated to leisure and entertainment. Additionally, Kunlun Tech manages the mobile game platform Ark Games and holds equity investments through Kunlun Capital.
The above weekly chart formed an approximately 3-month-long rectangle chart pattern as a bullish reversal after a downtrend.
The horizontal boundary at 42.94 levels acts as a resistance within this pattern.
A daily close above 44.23 levels would validate the breakout from the 3-month-long rectangle chart pattern.
Based on this chart pattern, the potential price target is 67.5 levels.
300418, classified under the "communication services" sector, falls under the “Mid Cap - Growth” stock category.
Mercedes-Benz Group AG-(MBG/XETR)-Long Idea
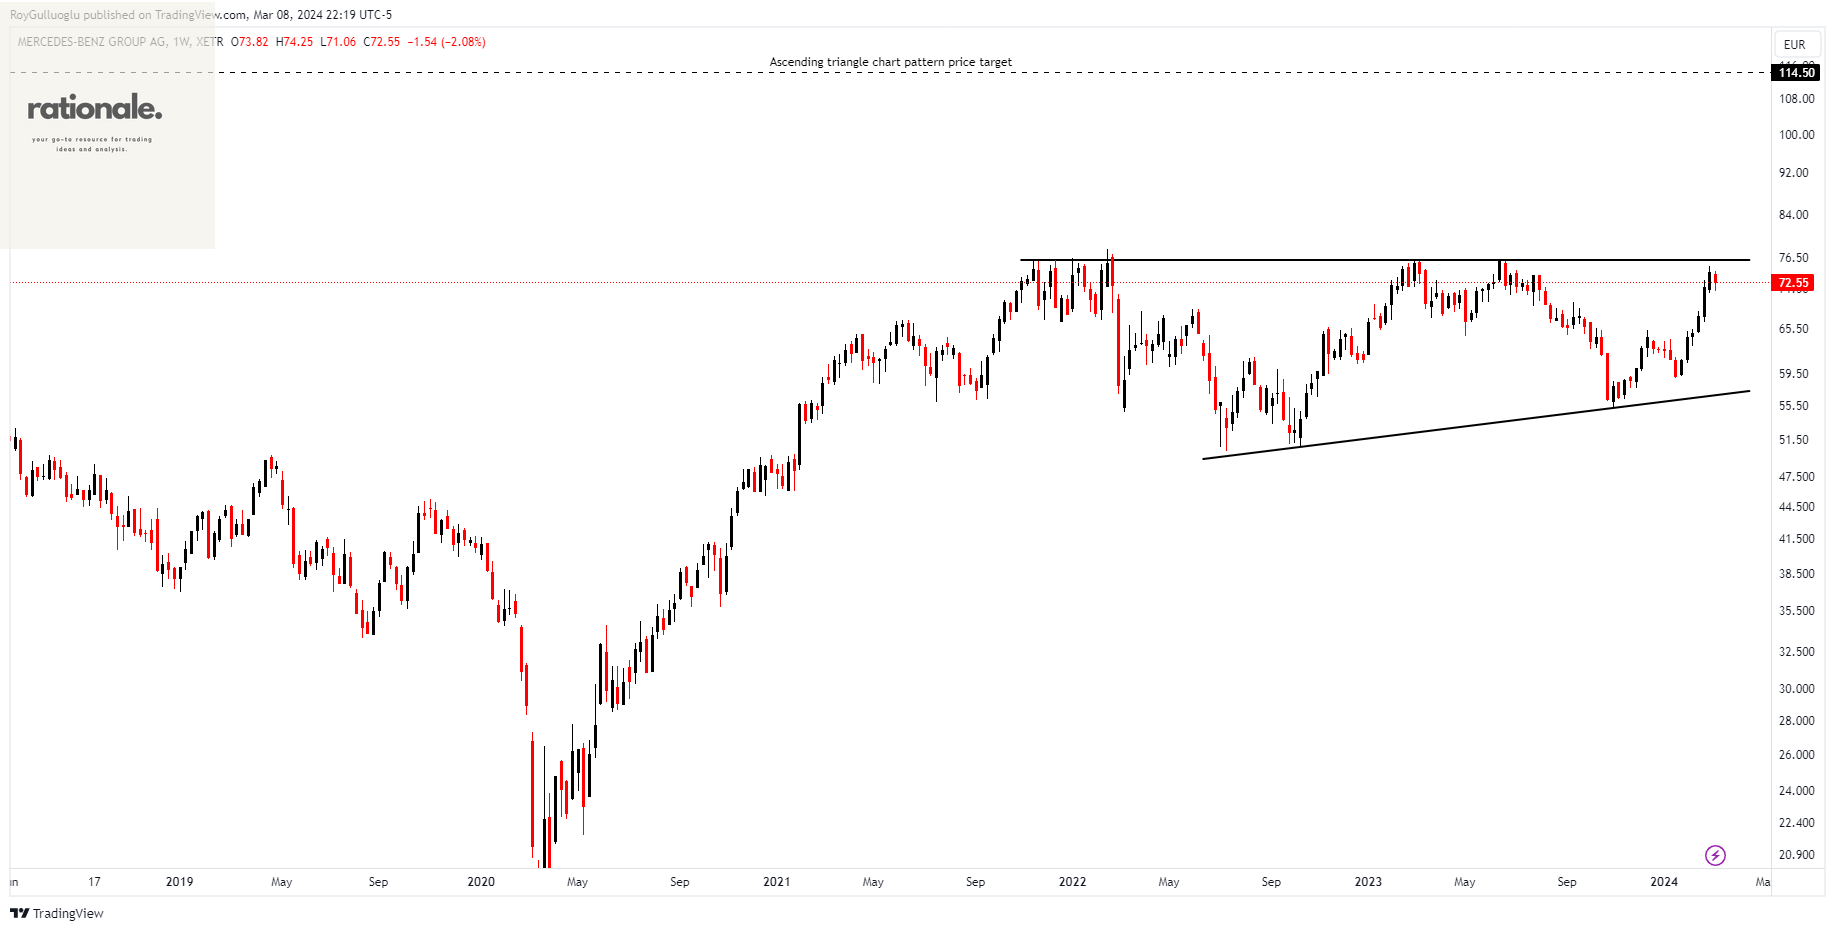
Mercedes-Benz Group AG functions as an automotive company with operations in Germany and across the globe. The company is involved in the development, manufacturing, and sales of premium and luxury cars and vans, marketed under the brands Mercedes-AMG, Mercedes-Benz, Mercedes-Maybach, and Mercedes-EQ. Additionally, the company offers associated spare parts and accessories.
The above weekly chart formed an approximately 20-month-long ascending triangle chart pattern as a bullish continuation after an uptrend.
The horizontal boundary at 76 levels acts as a resistance within this pattern.
A daily close above 78.28 levels would validate the breakout from the 20-month-long ascending triangle chart pattern.
Based on this chart pattern, the potential price target is 114.50 levels.
MBG, classified under the "consumer cyclicals" sector, falls under the “Large Cap - Growth” stock category.
L'Oréal S.A.-(OR/EURONEXT)-Long Idea
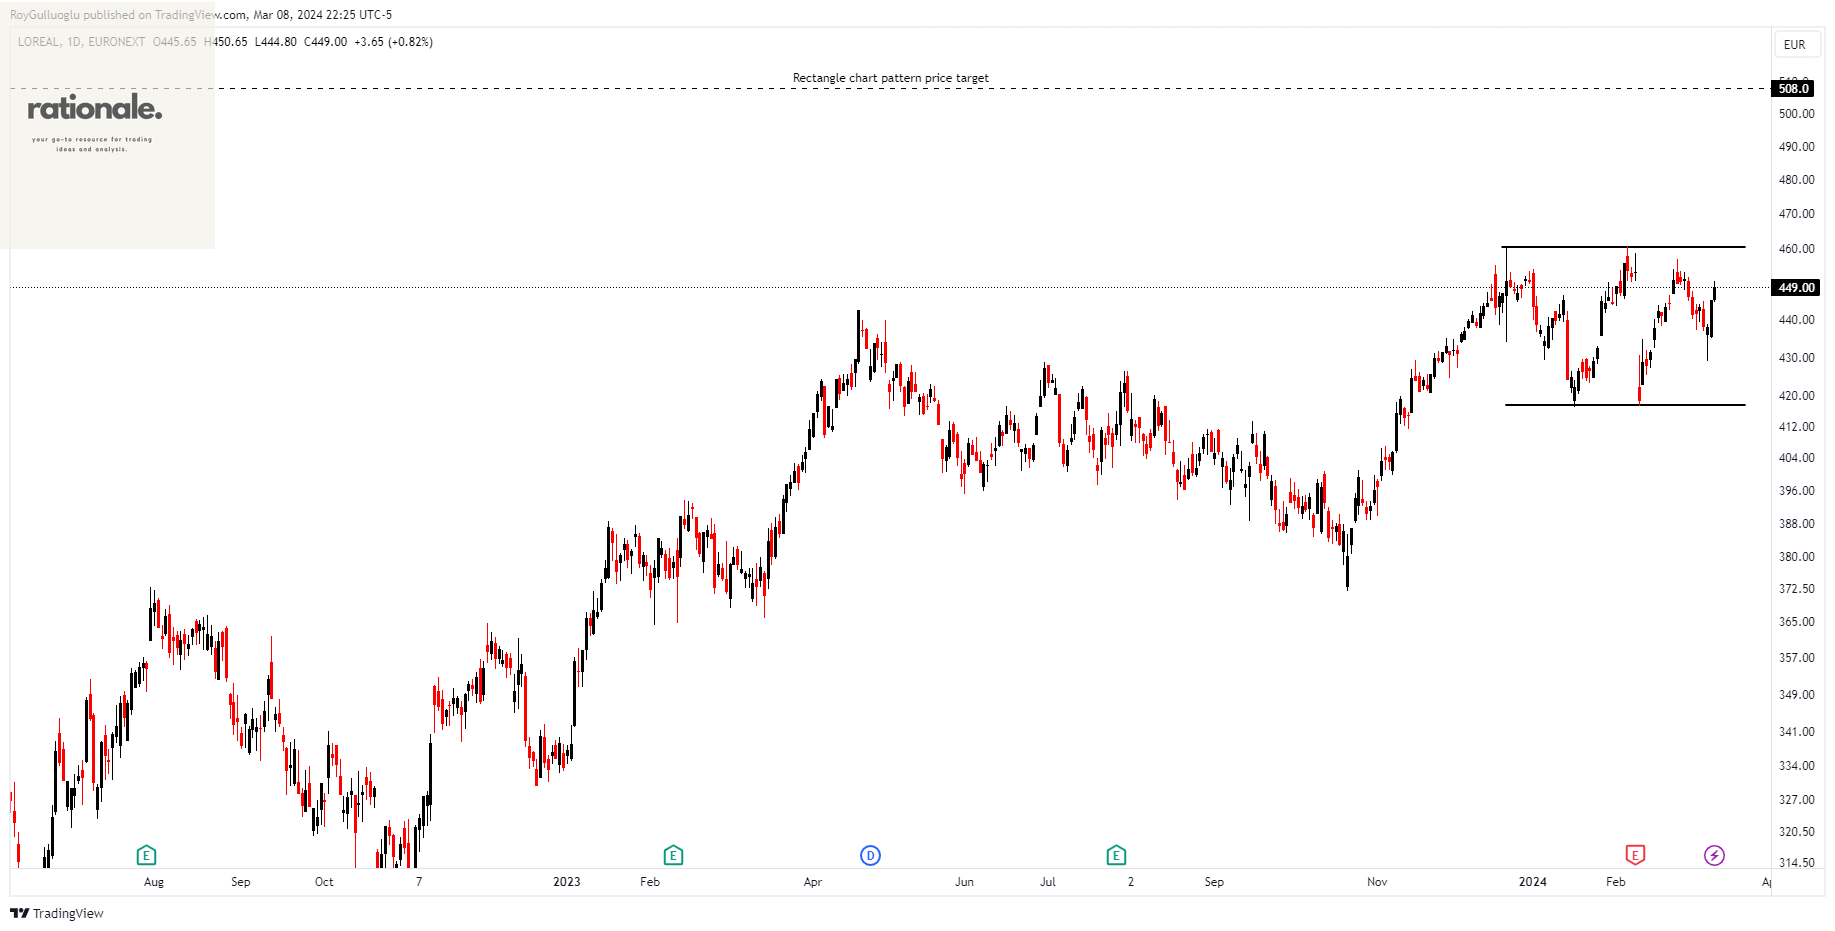
L'Oréal S.A., along with its subsidiaries, produces and markets cosmetic products catering to both women and men on a global scale.
The above daily chart formed an approximately 2-month-long rectangle chart pattern as a bullish continuation after an uptrend.
The horizontal boundary at 460.35 levels acts as a resistance within this pattern.
A daily close above 474.16 levels would validate the breakout from the 2-month-long rectangle chart pattern.
Based on this chart pattern, the potential price target is 508 levels.
hVIVO plc-(HVO/LSE)-Long/Short Idea
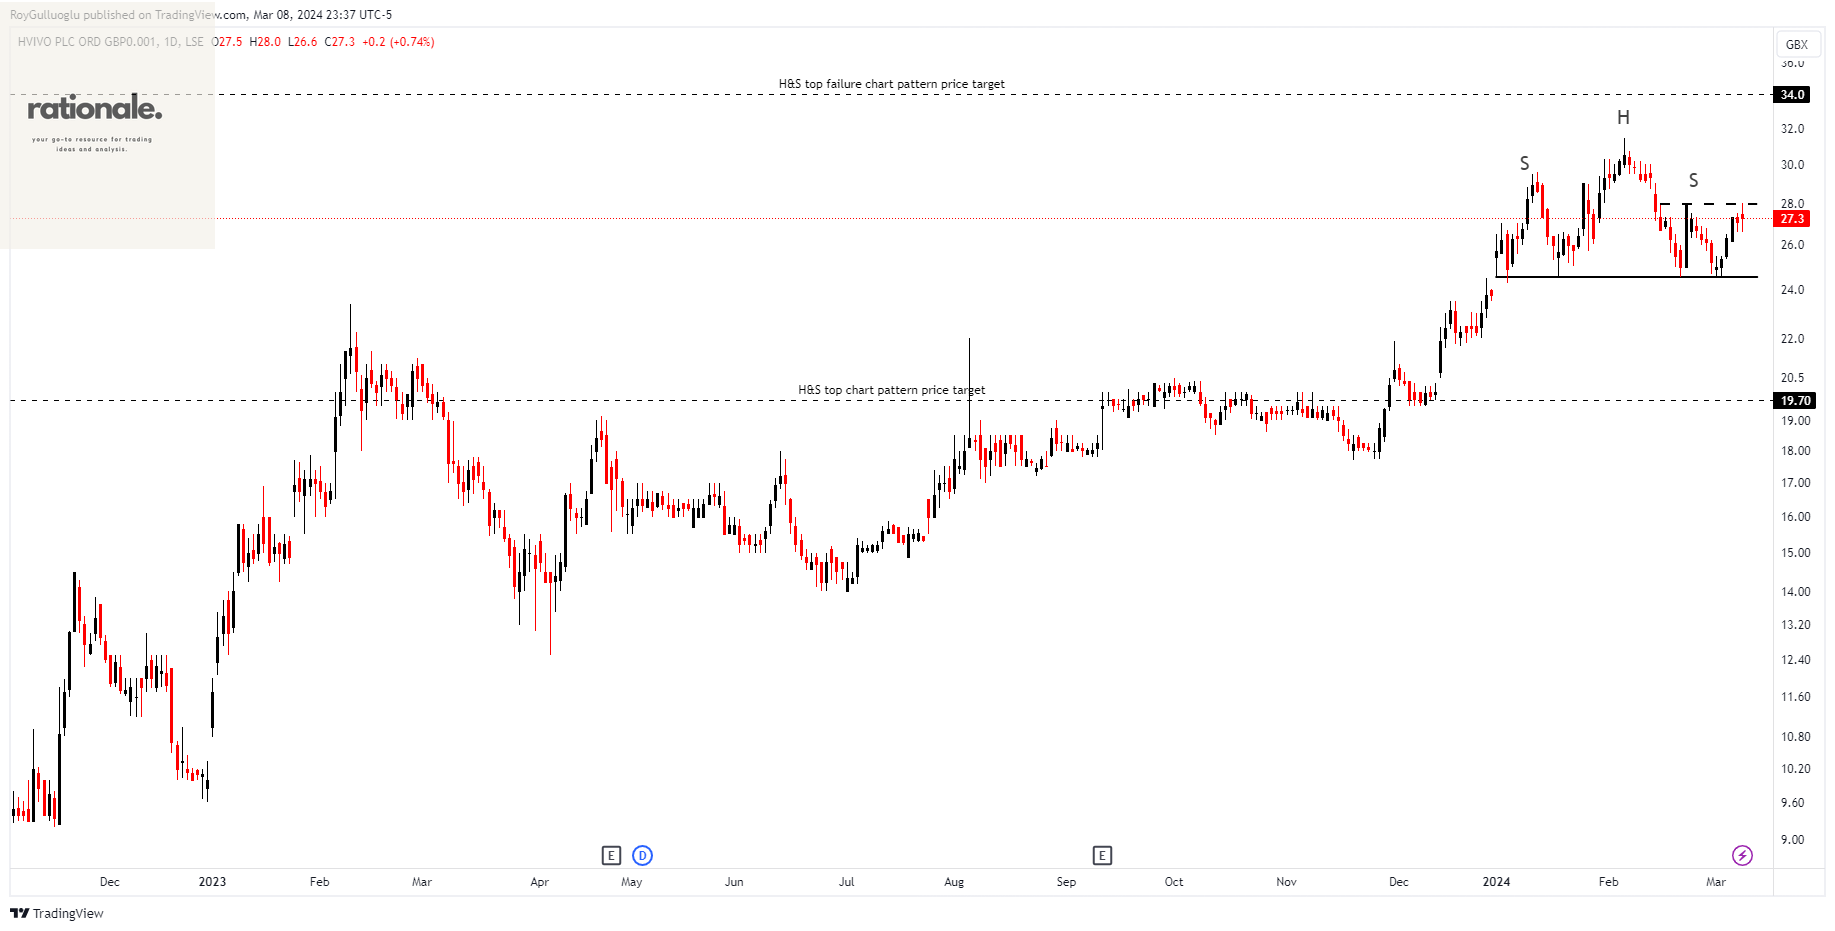
hVIVO plc functions as a pharmaceutical service and contract research company, specializing in the testing of vaccines and antivirals through human-challenge clinical trials.
The above daily chart formed an approximately 2-month-long H&S top failure chart pattern as a bullish continuation after an uptrend.
The horizontal boundary at 28 levels acts as a resistance within this pattern.
A daily close above 28.84 levels would validate the breakout from the 2-month-long H&S top failure chart pattern.
Based on this chart pattern, the potential price target is 34 levels.
Also, the daily chart might act as an H&S top bearish reversal chart pattern after an uptrend, if we see a breakdown below 23.862 levels.
Based on this chart pattern, the potential price target is 19.7 levels.
HVO, classified under the "healthcare" sector, falls under the “Small Cap - Value” stock category.
DCC plc-(DCC/LSE)-Long Idea
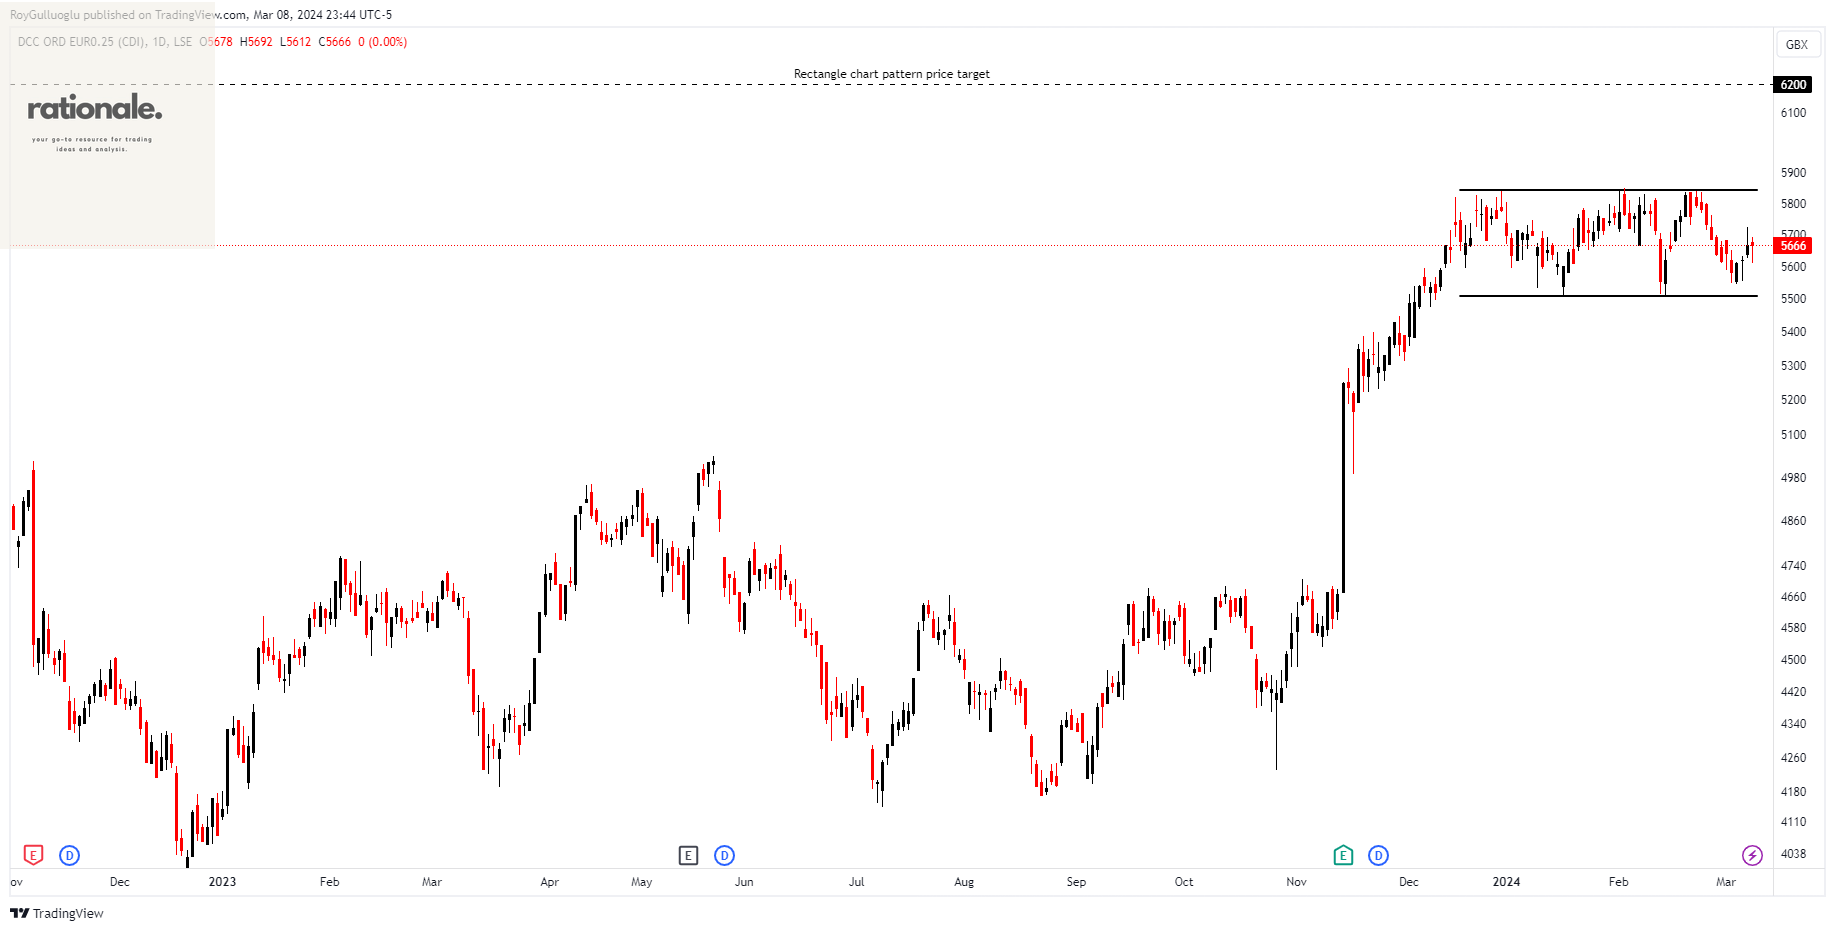
DCC plc offers global sales, marketing, and support services, operating across segments such as DCC Energy, DCC Healthcare, and DCC Technology.
The above daily chart formed an approximately 2-month-long rectangle chart pattern as a bullish continuation after an uptrend.
The horizontal boundary at 5842 levels acts as a resistance within this pattern.
A daily close above 6017 levels would validate the breakout from the 2-month-long rectangle chart pattern.
Based on this chart pattern, the potential price target is 6200 levels.
DCC, classified under the "energy" sector, falls under the “Mid Cap - Income” stock category.
Türkiye Petrol Rafinerileri A.S.-(TUPRS/BIST)-Long Idea
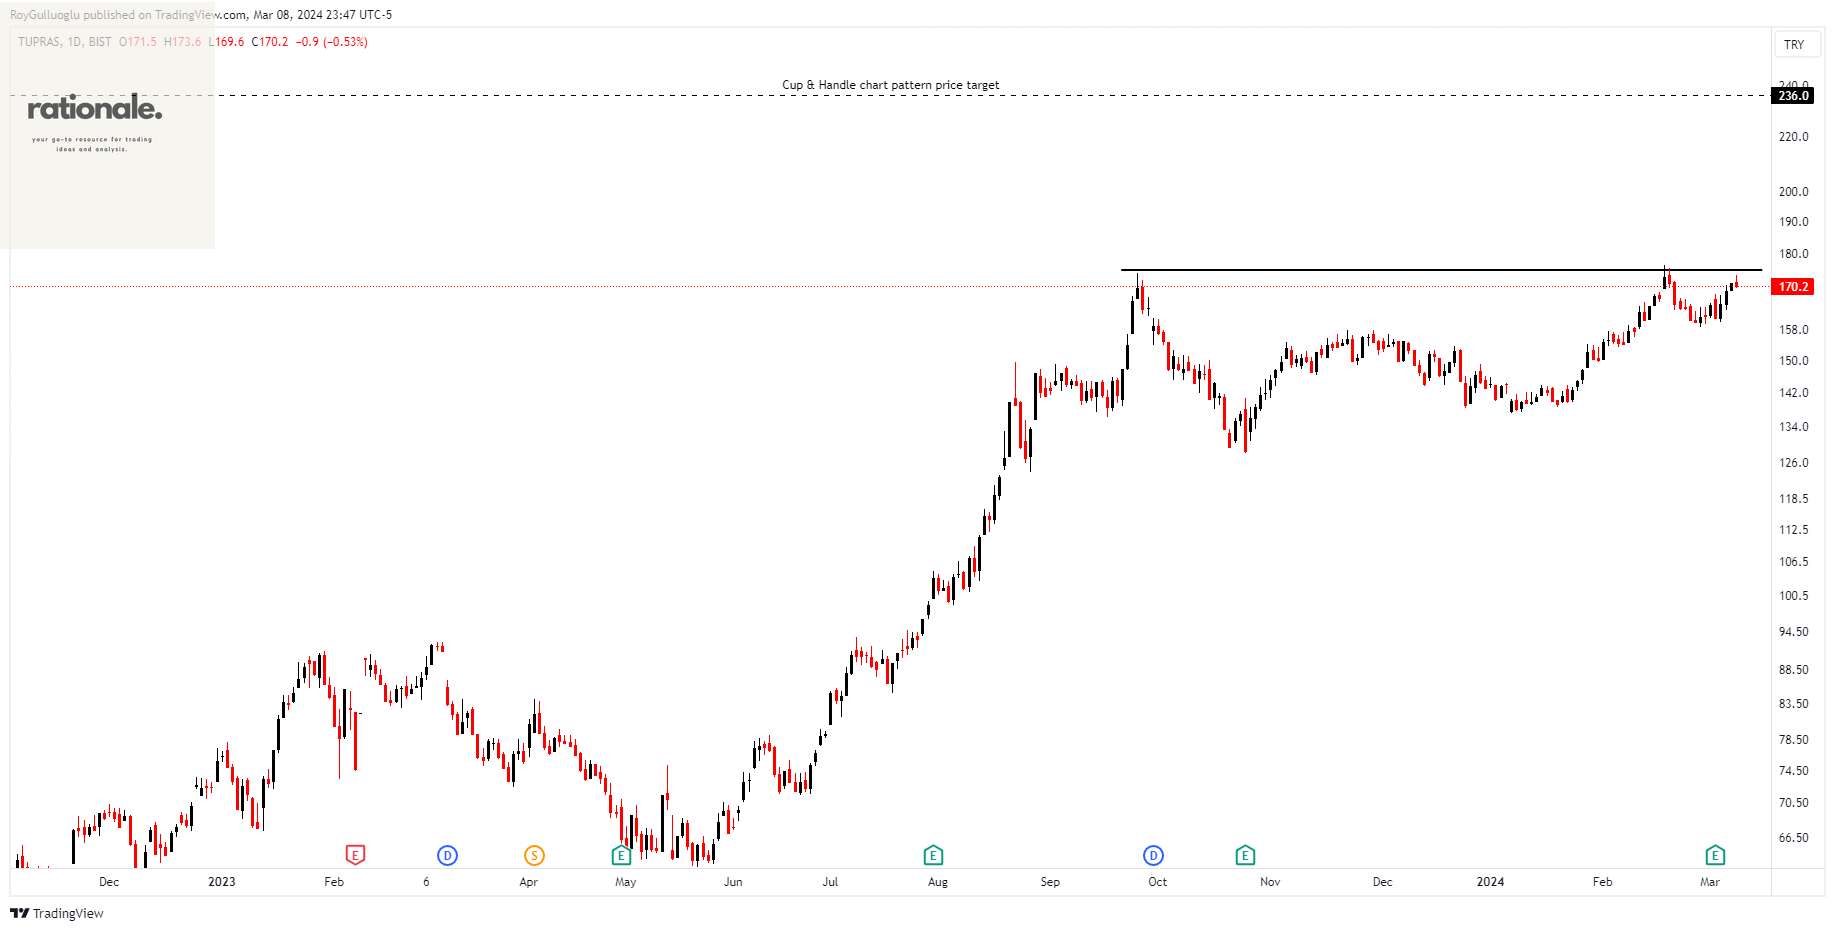
Türkiye Petrol Rafinerileri A.S., along with its subsidiaries, is involved in the refining of crude oil, petroleum, and chemical products, both in Turkey and internationally.
The above daily chart formed an approximately 4-month-long Cup & Handle chart pattern as a bullish continuation after an uptrend.
The horizontal boundary at 175.1 levels acts as a resistance within this pattern.
A daily close above 180.35 levels would validate the breakout from the 4-month-long Cup & Handle chart pattern.
Based on this chart pattern, the potential price target is 236 levels.
TUPRS, classified under the "energy" sector, falls under the “Large Cap - Income” stock category.