


New setups
NVIDIA Corporation-(NVDA/NASDAQ)-Long Idea
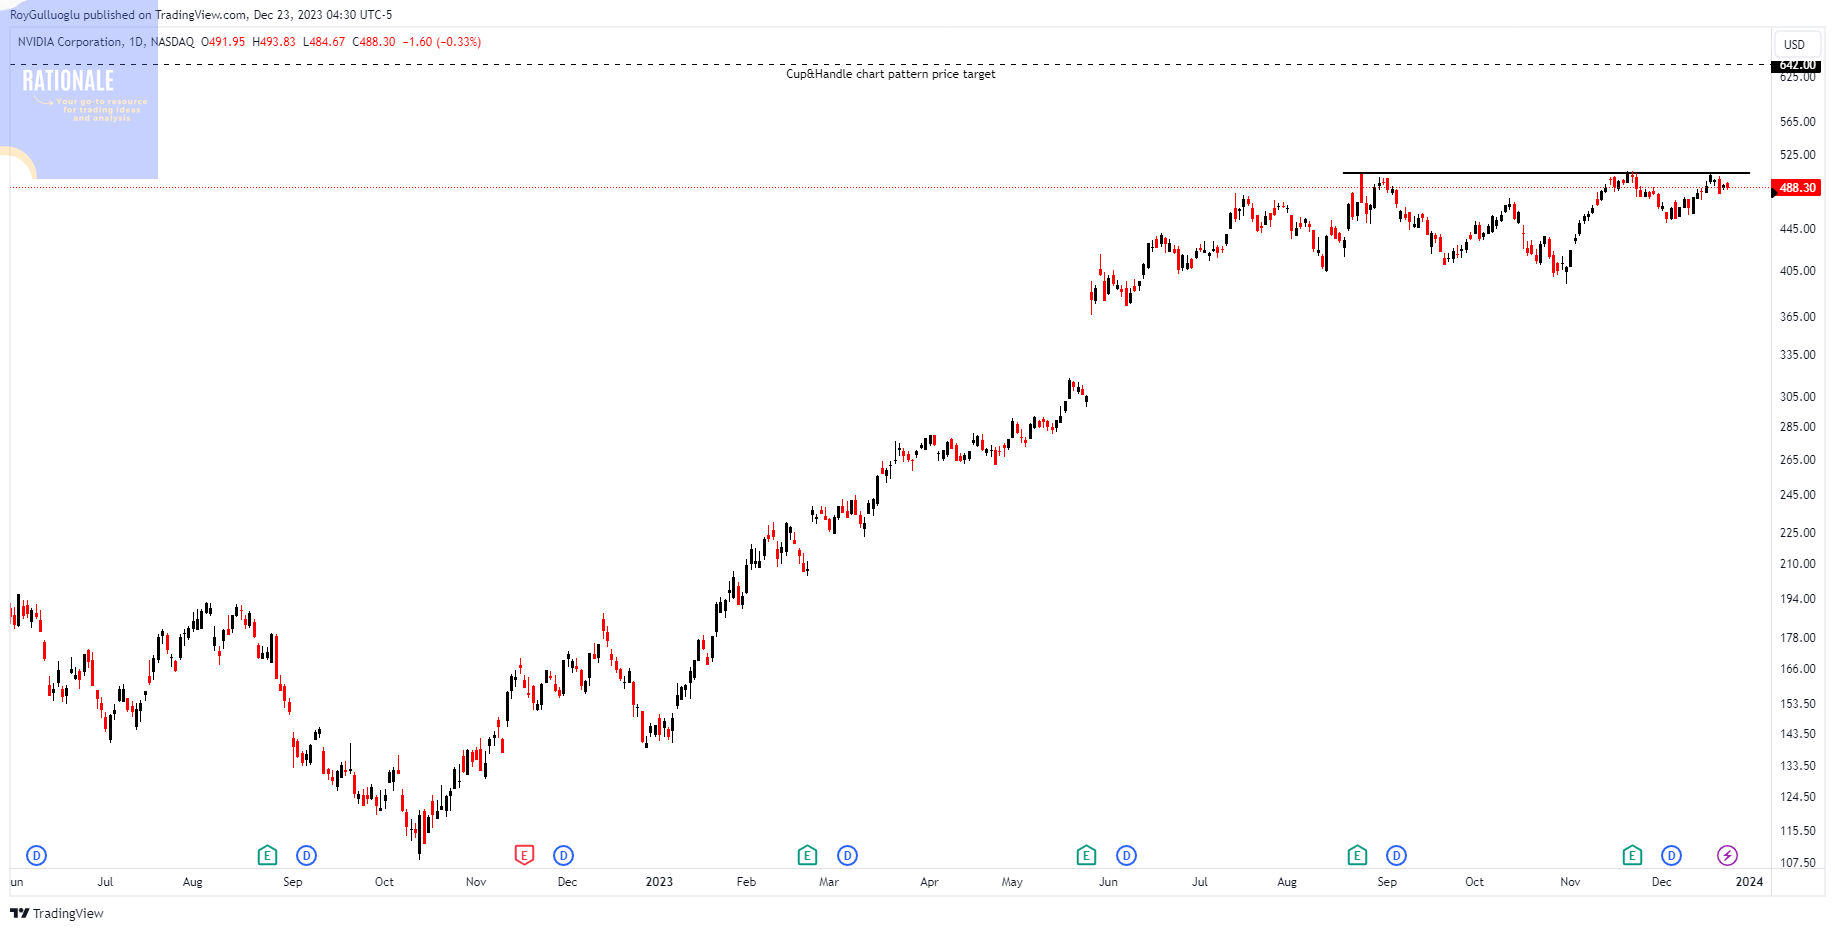
NVIDIA Corporation is a technology company that specializes in designing and manufacturing graphics processing units (GPUs) for gaming, professional markets, and data centers.
The above daily chart formed an approximately 3-month-long Cup & Handle chart pattern as a bullish continuation after an uptrend.
Within this pattern, the horizontal boundary at 503 levels acts as a resistance.
A daily close above 518 levels would validate the breakout from the 3-month-long Cup & Handle chart pattern.
Based on this chart pattern, the potential price target is 642 levels.
NVDA, classified under the "technology" sector, falls under the “Large Cap - Growth” stock category.
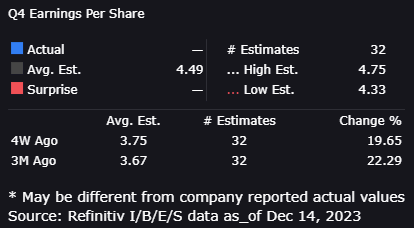
Multiple quarters of EPS, and revenue acceleration YoY in Quarterly Earnings is another strength of the stock.
Nvidia is expected to report earnings of $4.49 per share for the present quarter.

Bentley Systems, Incorporated-(BSY/NASDAQ)-Long Idea
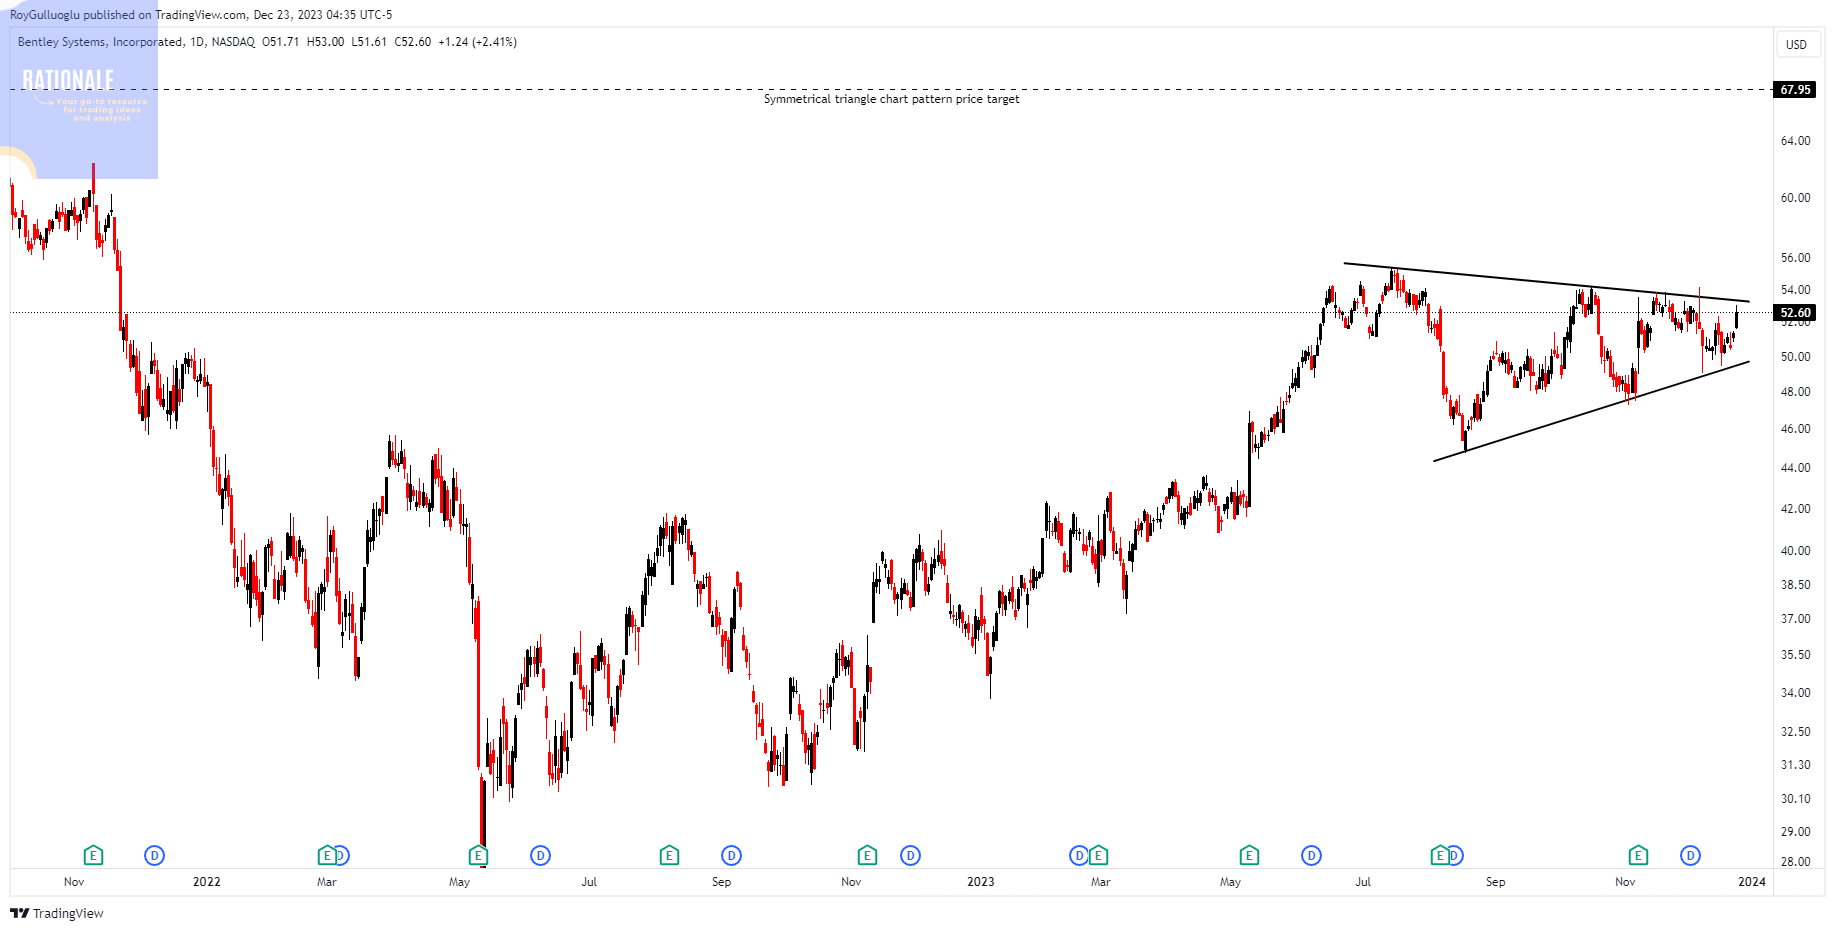
Bentley Systems, Incorporated is a software development company that specializes in providing solutions for infrastructure design, construction, and operations. The company's software offerings are widely used in architecture, engineering, construction, and operations (AECO).
The above daily chart formed an approximately 4-month-long ascending triangle chart pattern as a bullish continuation after an uptrend.
A daily close above 55 levels would validate the breakout from the 4-month-long ascending triangle chart pattern.
Based on this chart pattern, the potential price target is 67.95 levels.
BSY, classified under the "technology" sector, falls under the “Large Cap - Growth” stock category.
Carrier Global Corporation-(CARR/NYSE)-Long Idea
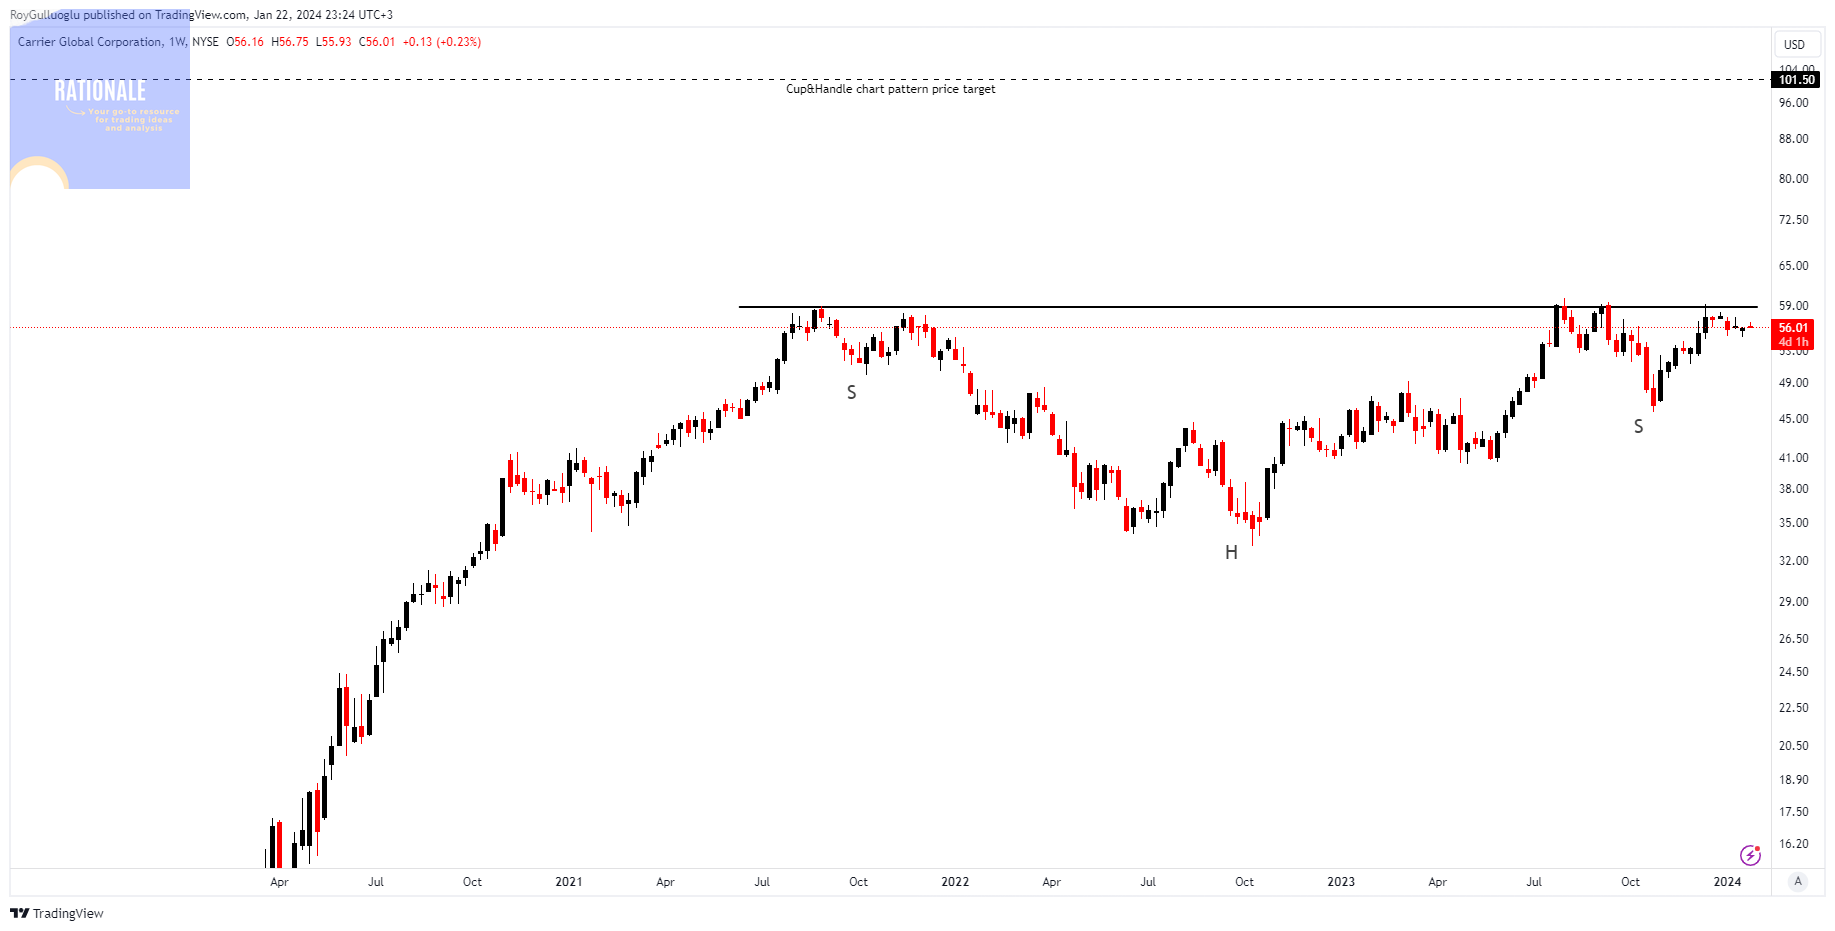
Carrier Global Corporation is a multinational company that operates in the field of heating, ventilation, air conditioning, and refrigeration (HVAC&R), as well as building and cold chain solutions.
The above weekly chart formed an approximately 30-month-long Cup & Handle chart pattern as a bullish continuation after an uptrend.
Within this pattern, the horizontal boundary at 58.76 levels acts as a resistance.
A daily close above 60.52 levels would validate the breakout from the 30-month-long Cup & Handle chart pattern.
Based on this chart pattern, the potential price target is 101.5 levels.
CARR, classified under the "industrials" sector, falls under the “Large Cap - Value” stock category.
Weatherford International plc-(WFRD/NASDAQ)-Long Idea
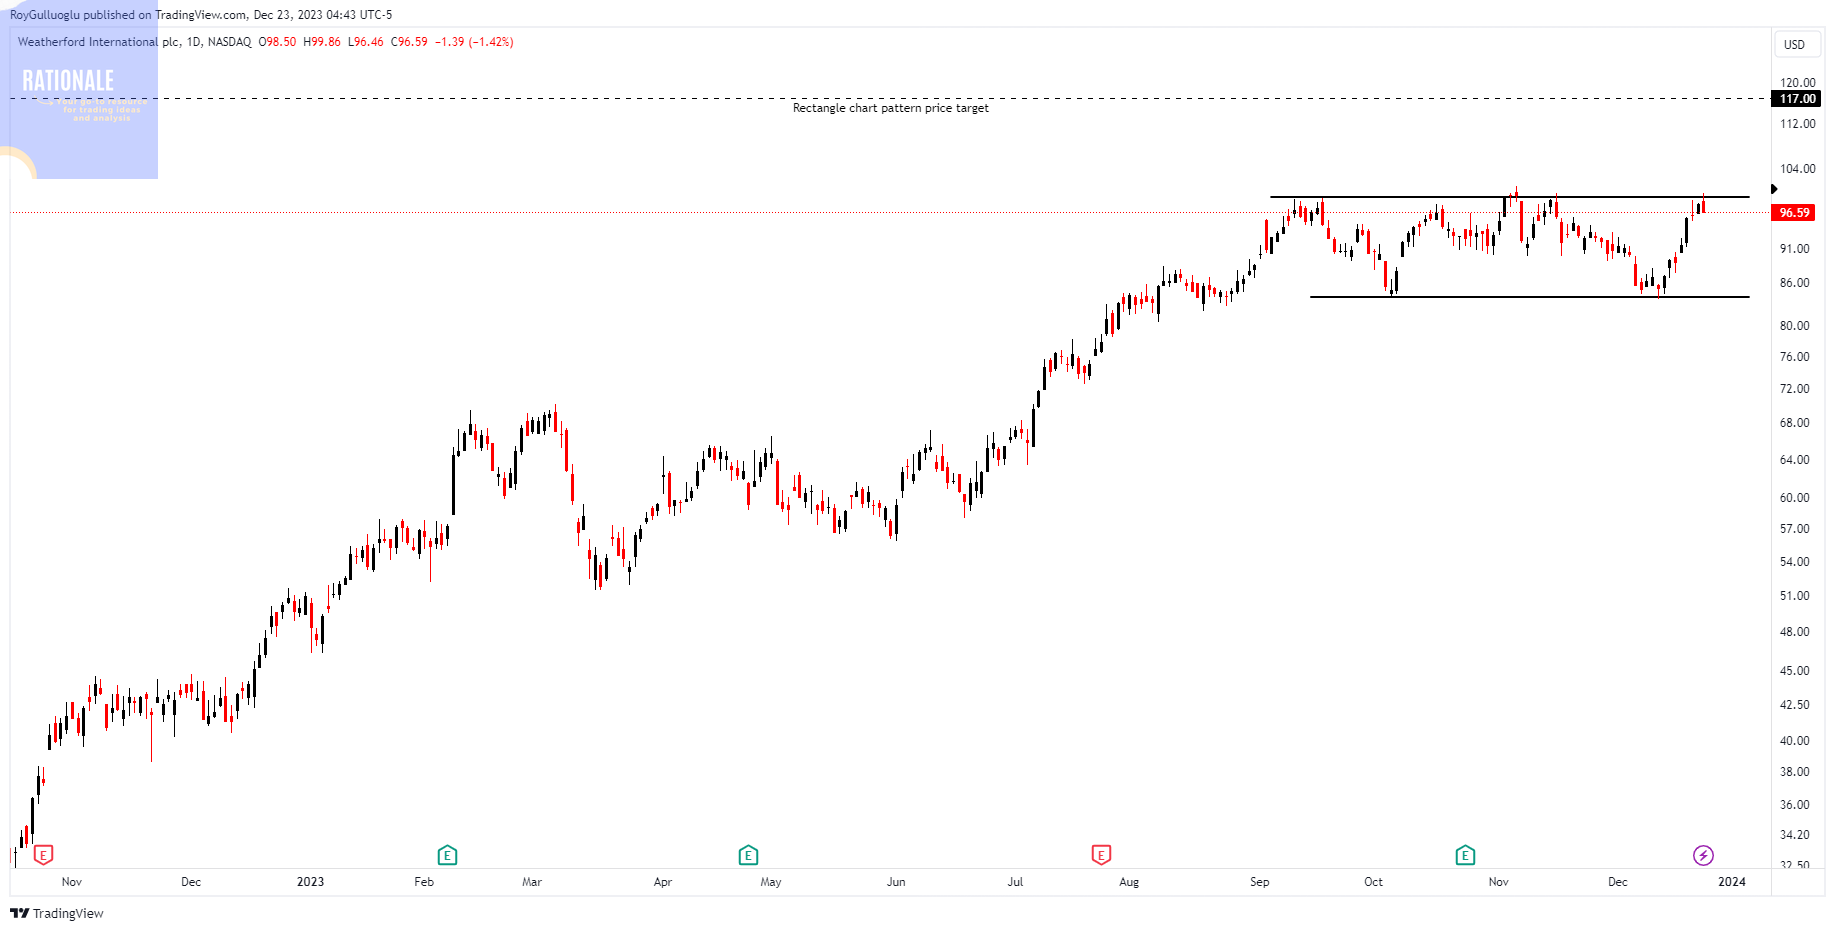
Weatherford International plc is an oilfield service company offering worldwide equipment and services for drilling, evaluating, completing, producing, and intervening oil and natural gas wells.
The above daily chart formed an approximately 2.5-month-long rectangle chart pattern as a bullish continuation after an uptrend.
Within this pattern, the horizontal boundary at 99.1 levels acts as a resistance.
A daily close above 102 levels would validate the breakout from the 2.5-month-long rectangle chart pattern.
Based on this chart pattern, the potential price target is 117 levels.
WFRD, classified under the "energy" sector, falls under the “Mid Cap - Income” stock category.
First American Corporation-(FAF/NYSE)-Long Idea
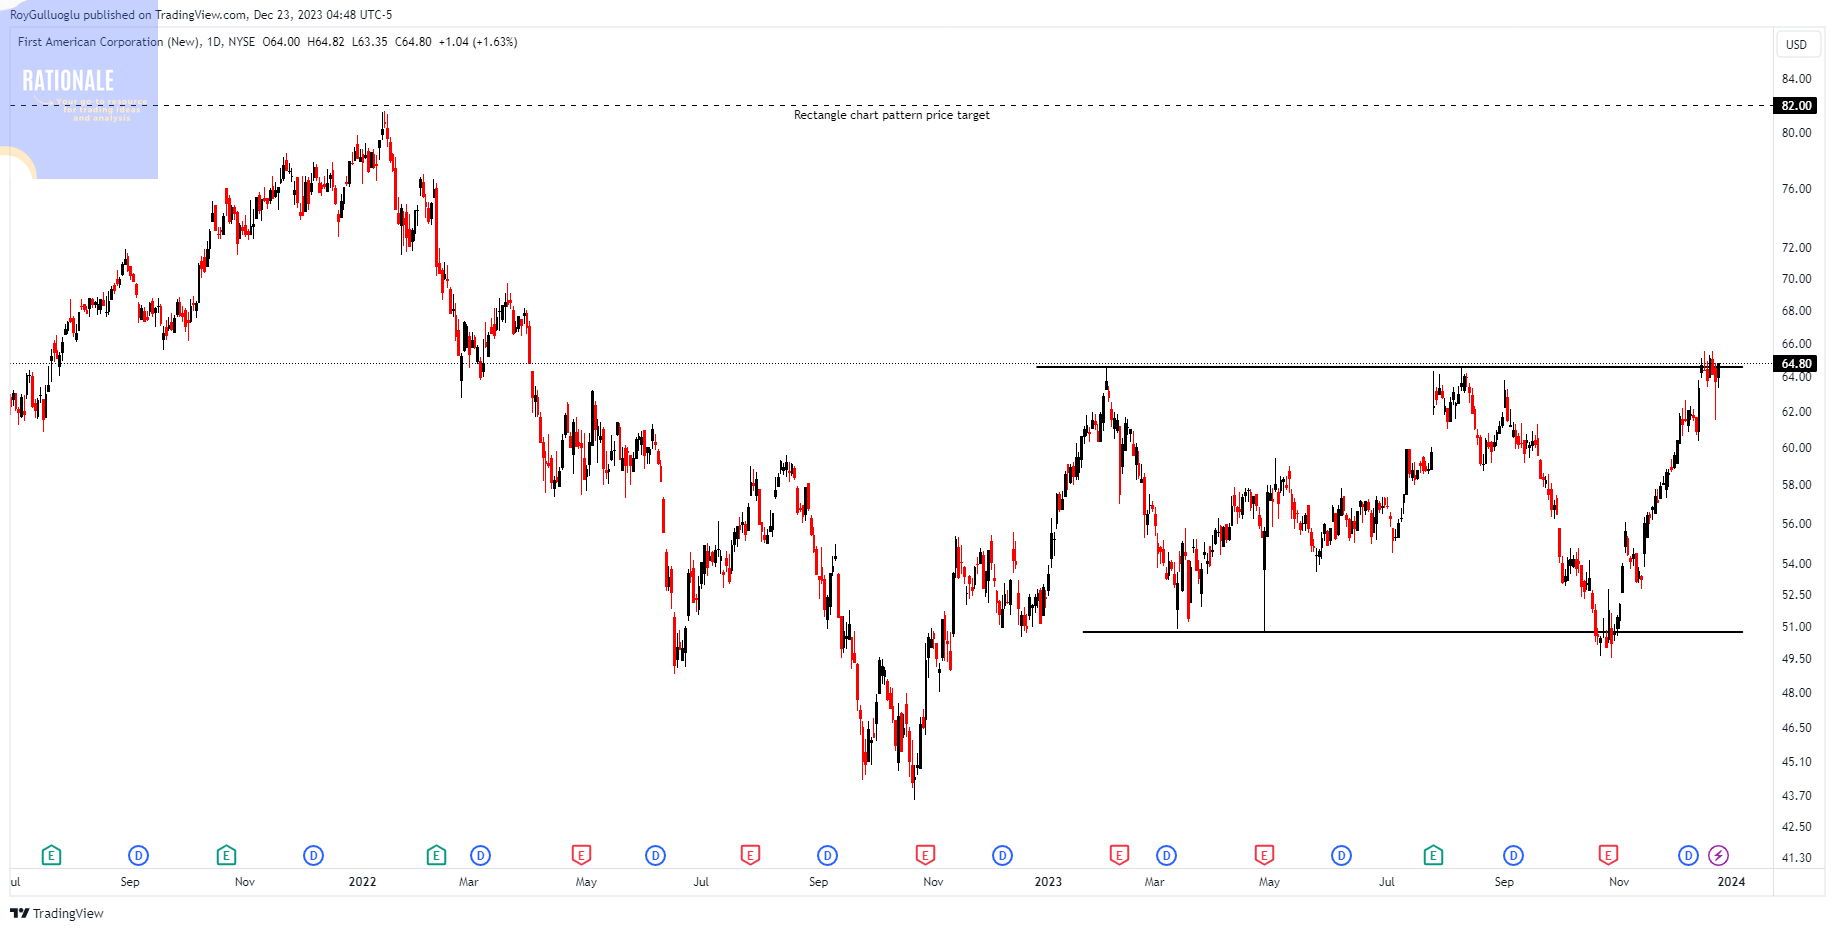
First American Corporation is a financial services company in the real estate and mortgage industries. It provides a range of services and products related to title insurance, settlement services, property data, and risk solutions.
The above daily chart formed an approximately 7-month-long rectangle chart pattern.
Within this pattern, the horizontal boundary at 64.58 levels acts as a resistance.
A daily close above 66.51 levels would validate the breakout from the 7-month-long rectangle chart pattern.
Based on this chart pattern, the potential price target is 82 levels.
FAF, classified under the "financial services" sector, falls under the “Mid Cap - Income” stock category.
Applovin Corporation-(APP/NASDAQ)-Long Idea
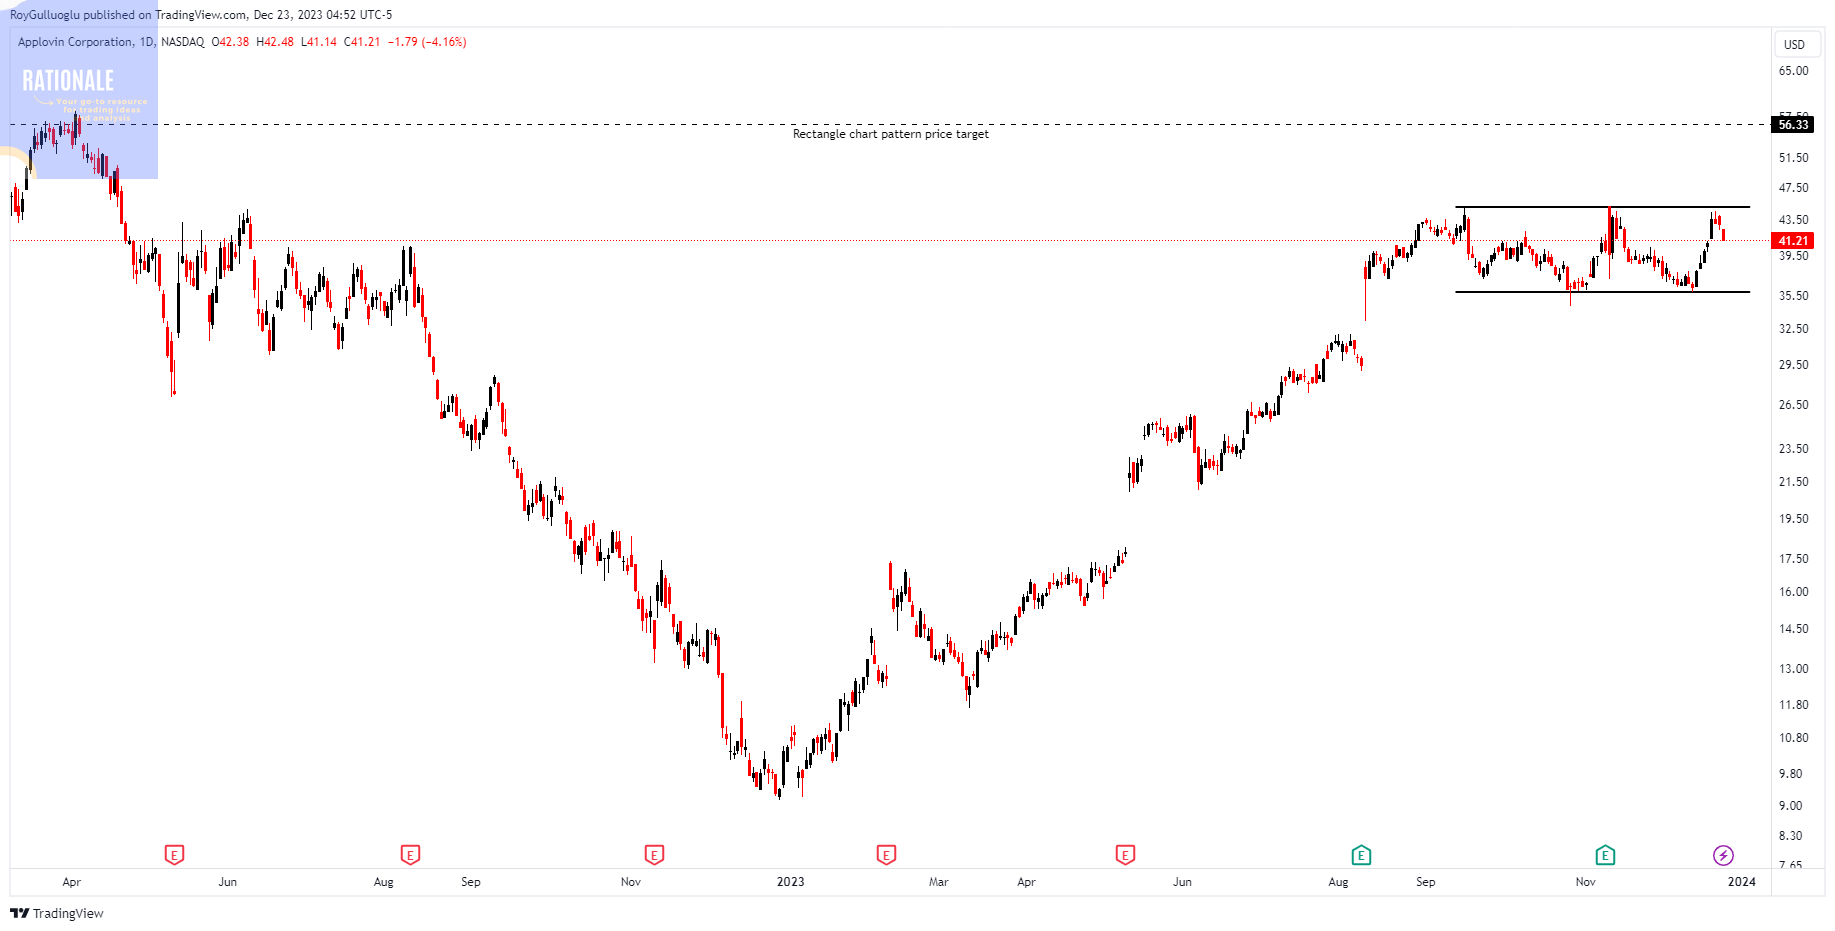
AppLovin Corporation engages in building a software-based platform for mobile app developers to enhance the marketing and monetization of their apps worldwide. The company's software solutions include AppDiscovery, a solution to automate, optimize, and manage user acquisition investments for business clients; and MAX, an in-app bidding solution that optimizes purchases of app ad inventory.
The above daily chart formed an approximately 2-month-long rectangle chart pattern.
Within this pattern, the horizontal boundary at 45 levels acts as a resistance.
A daily close above 46.35 levels would validate the breakout from the 2-month-long rectangle chart pattern.
Based on this chart pattern, the potential price target is 56.3 levels.
APP, classified under the "technology" sector, falls under the “Large Cap - Growth” stock category.
Multiple quarters of revenue acceleration YoY in Quarterly Earnings is another strength of the stock.
CBRE Group Inc.-(CBRE/NYSE)-Long Idea
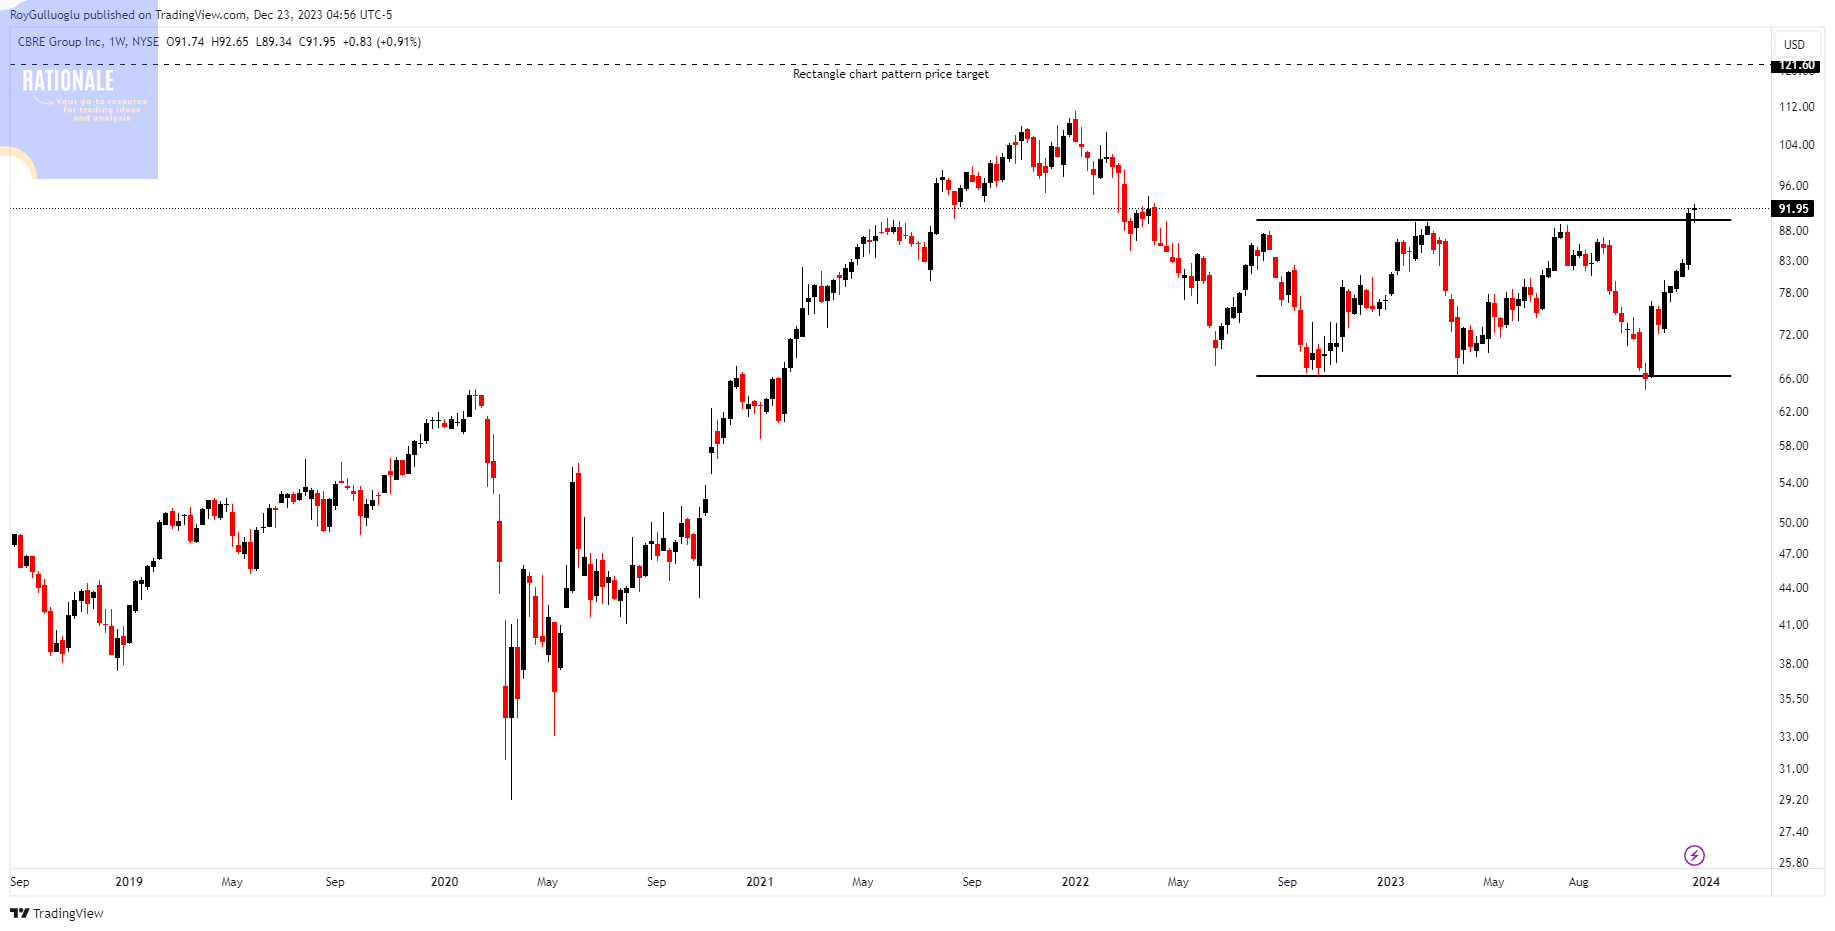
CBRE Group Inc. is a company specializing in commercial real estate services and investment. Its offerings encompass facilities management, property management, transaction management, and strategic consulting services.
The above weekly chart formed an approximately 15-month-long rectangle chart pattern.
Within this pattern, the horizontal boundary at 90 levels acts as a resistance.
A daily close above 92.7 levels would validate the breakout from the 15-month-long rectangle chart pattern.
Based on this chart pattern, the potential price target is 121.6 levels.
CBRE, classified under the "real estate" sector, falls under the “Large Cap - Income” stock category.
Follow-ups
Anadolu Efes-(AEFES/BIST)-Long Idea
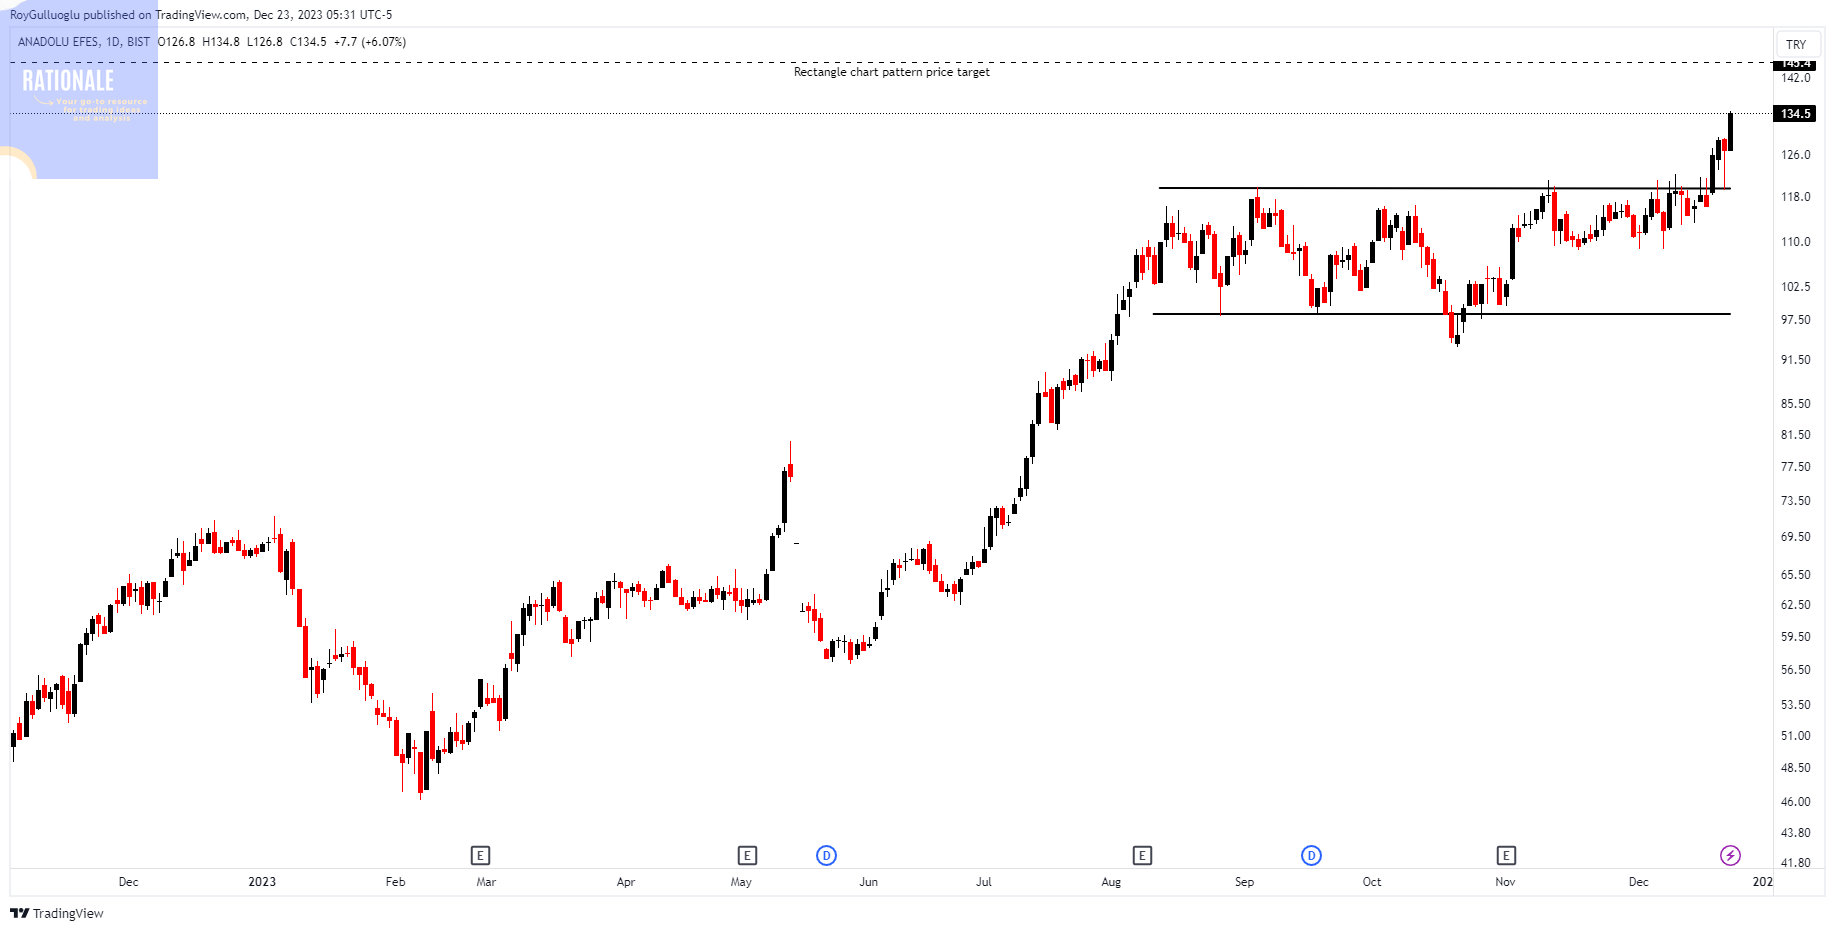
You can click the AEFES ticker above to access the first report explaining the RATIONALE behind the trade idea.
Ardmore Shipping Corporation-(ASC/NYSE)-Long Idea
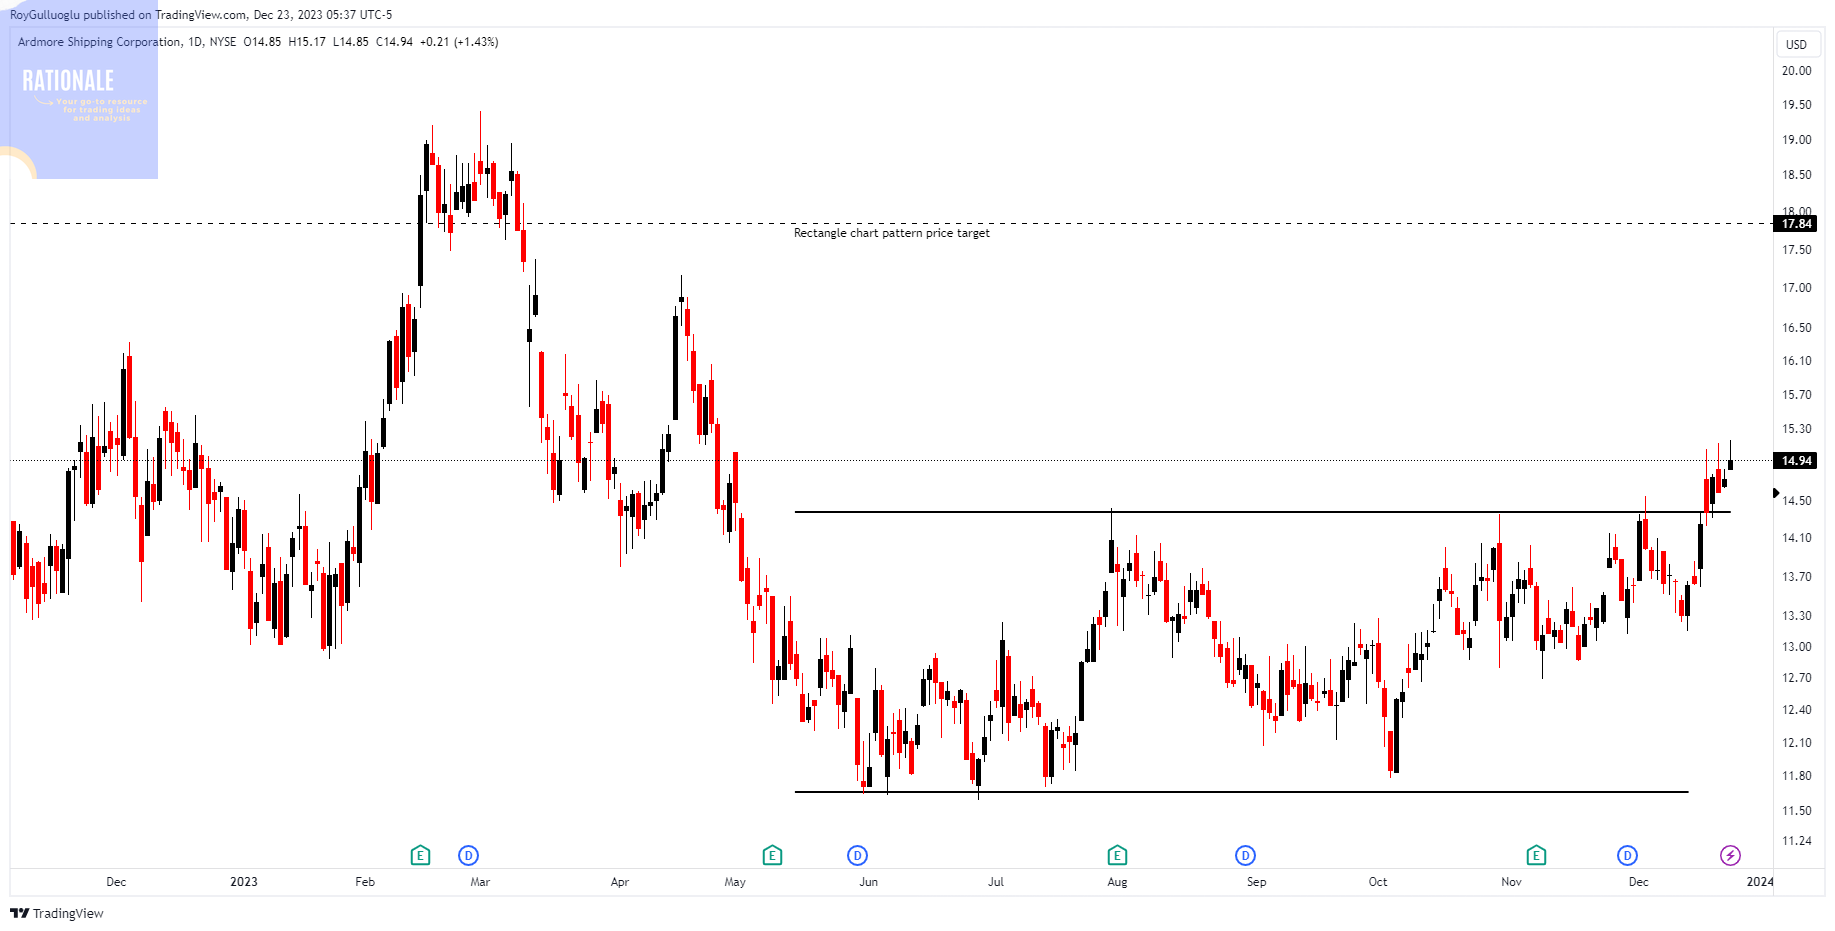
You can click the ASC ticker above to access the first report explaining the RATIONALE behind the trade idea.
Netflix, Inc.-(NFLX/NASDAQ)-Long Idea
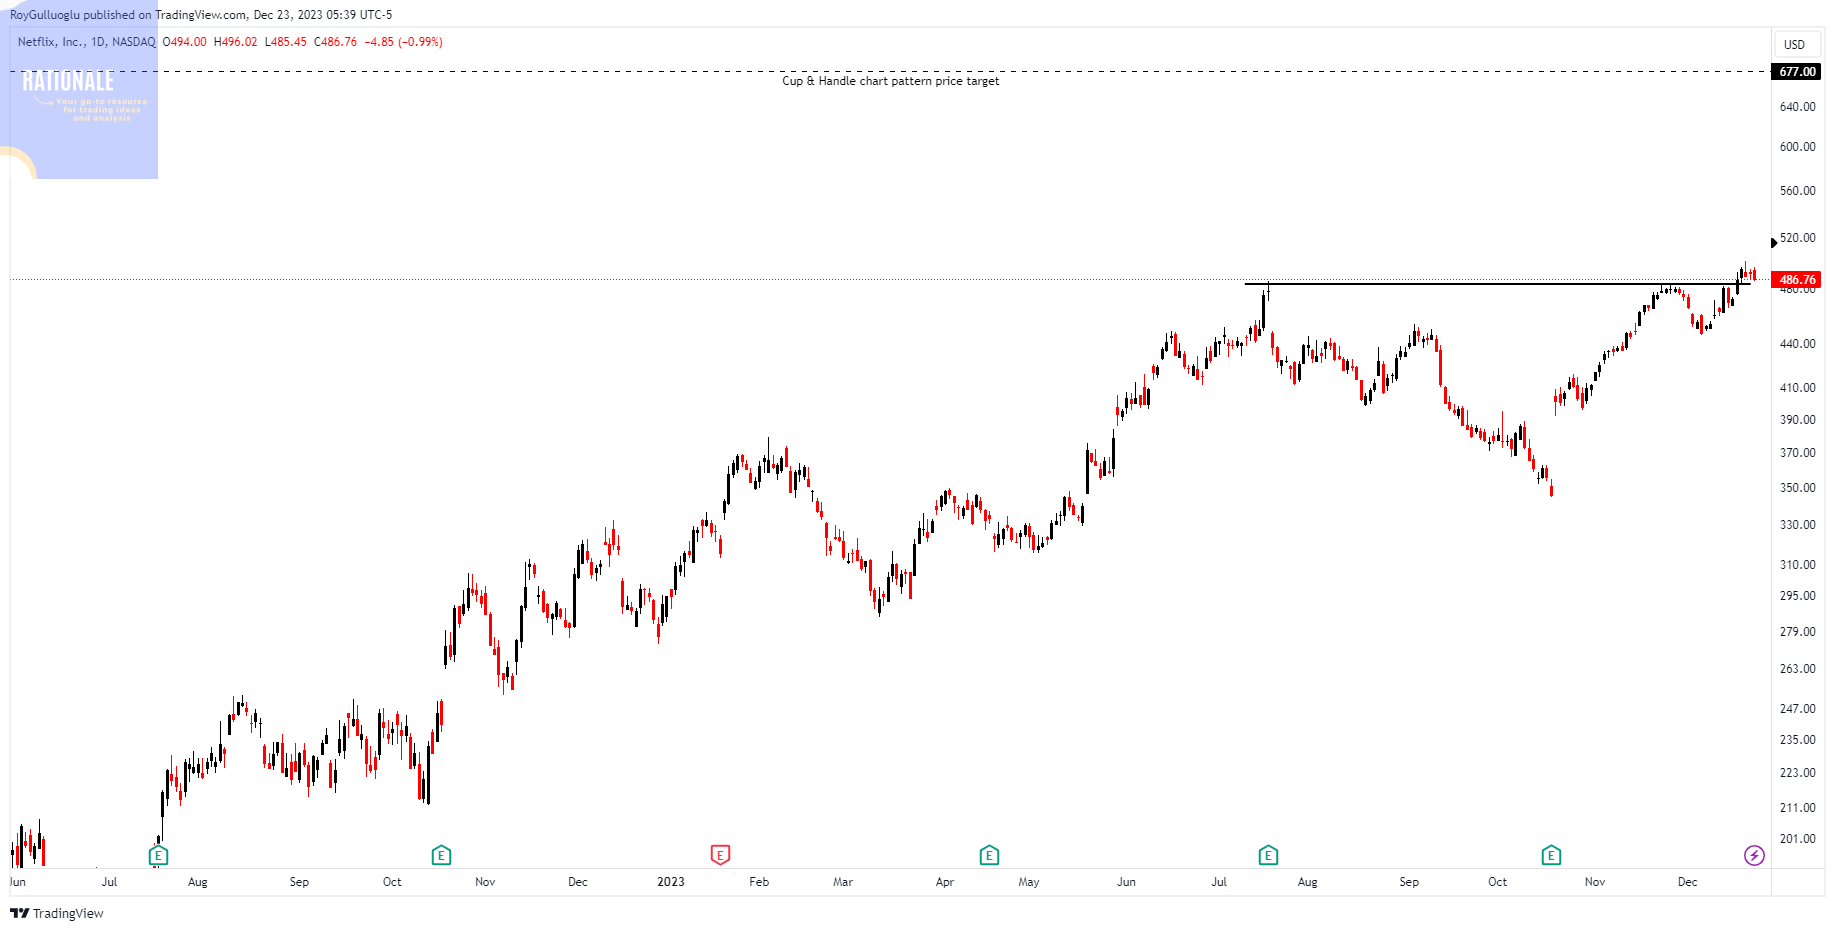
You can click the NFLX ticker above to access the first report explaining the RATIONALE behind the trade idea.
The price pulled back to the horizontal boundary after the breakout.
Illinois Tool Works Inc.-(ITW/NYSE) - Long Idea
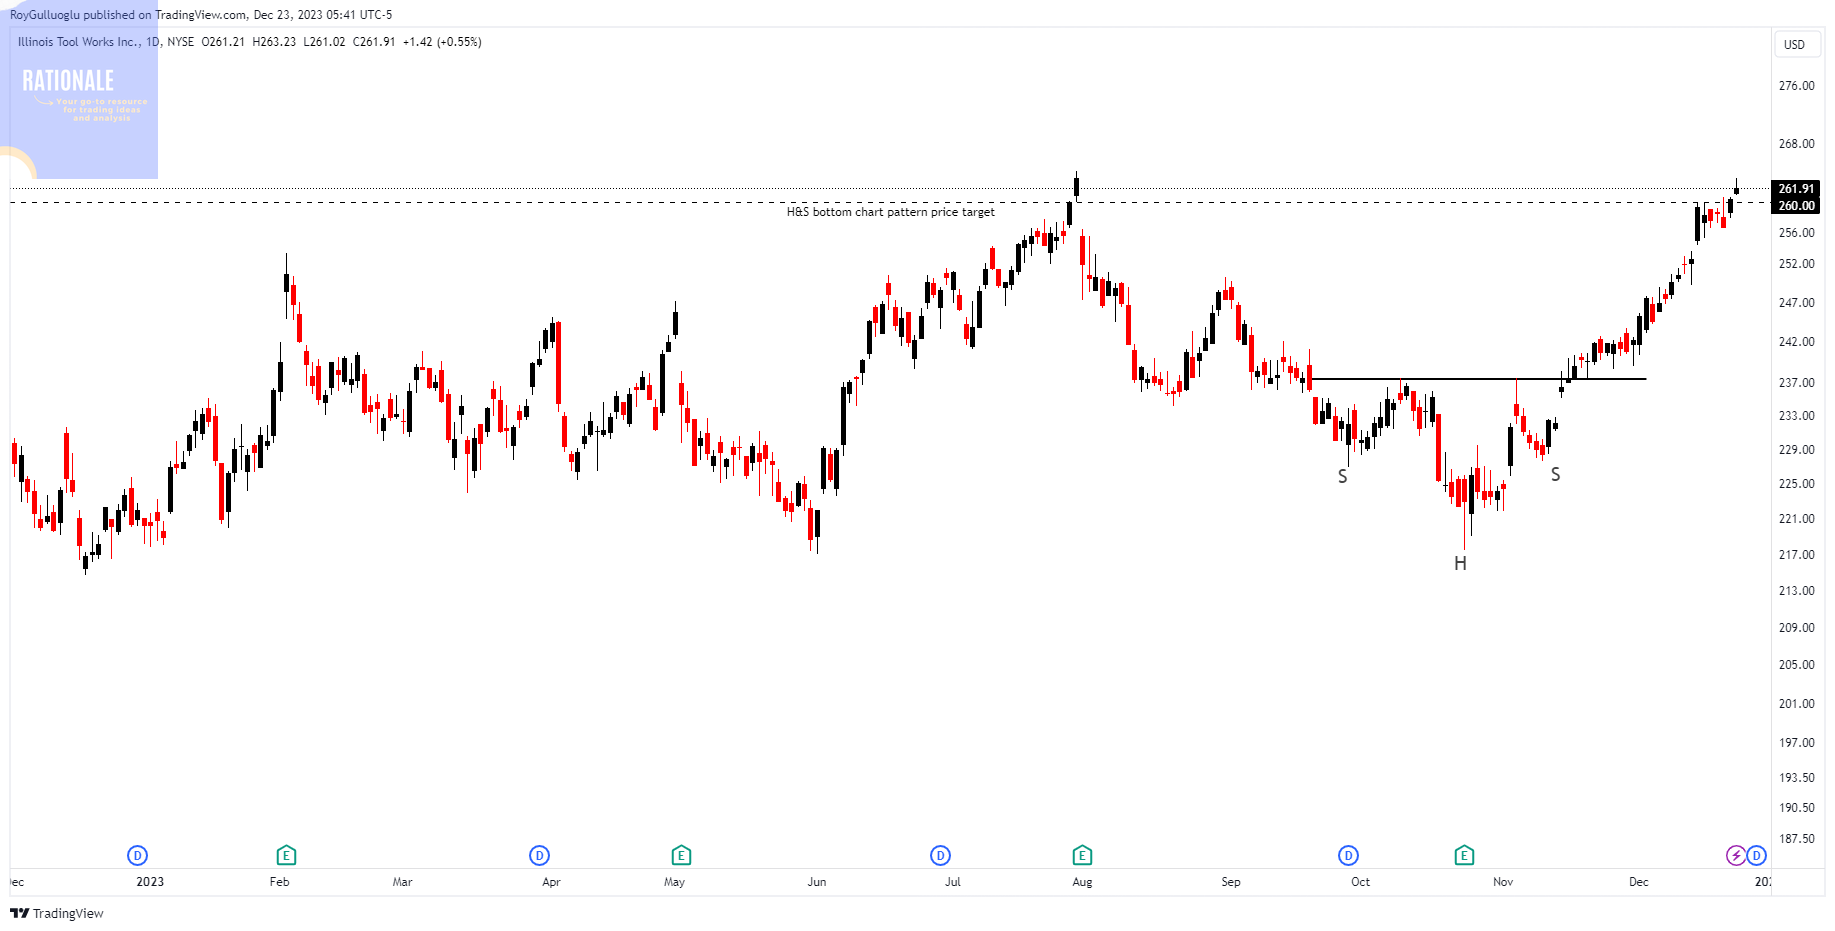
You can click the ITW ticker above to access the first report explaining the RATIONALE behind the trade idea.
The H&S bottom chart pattern price target is reached.
Disc Medicine, Inc-(IRON/NASDAQ)-Long Idea
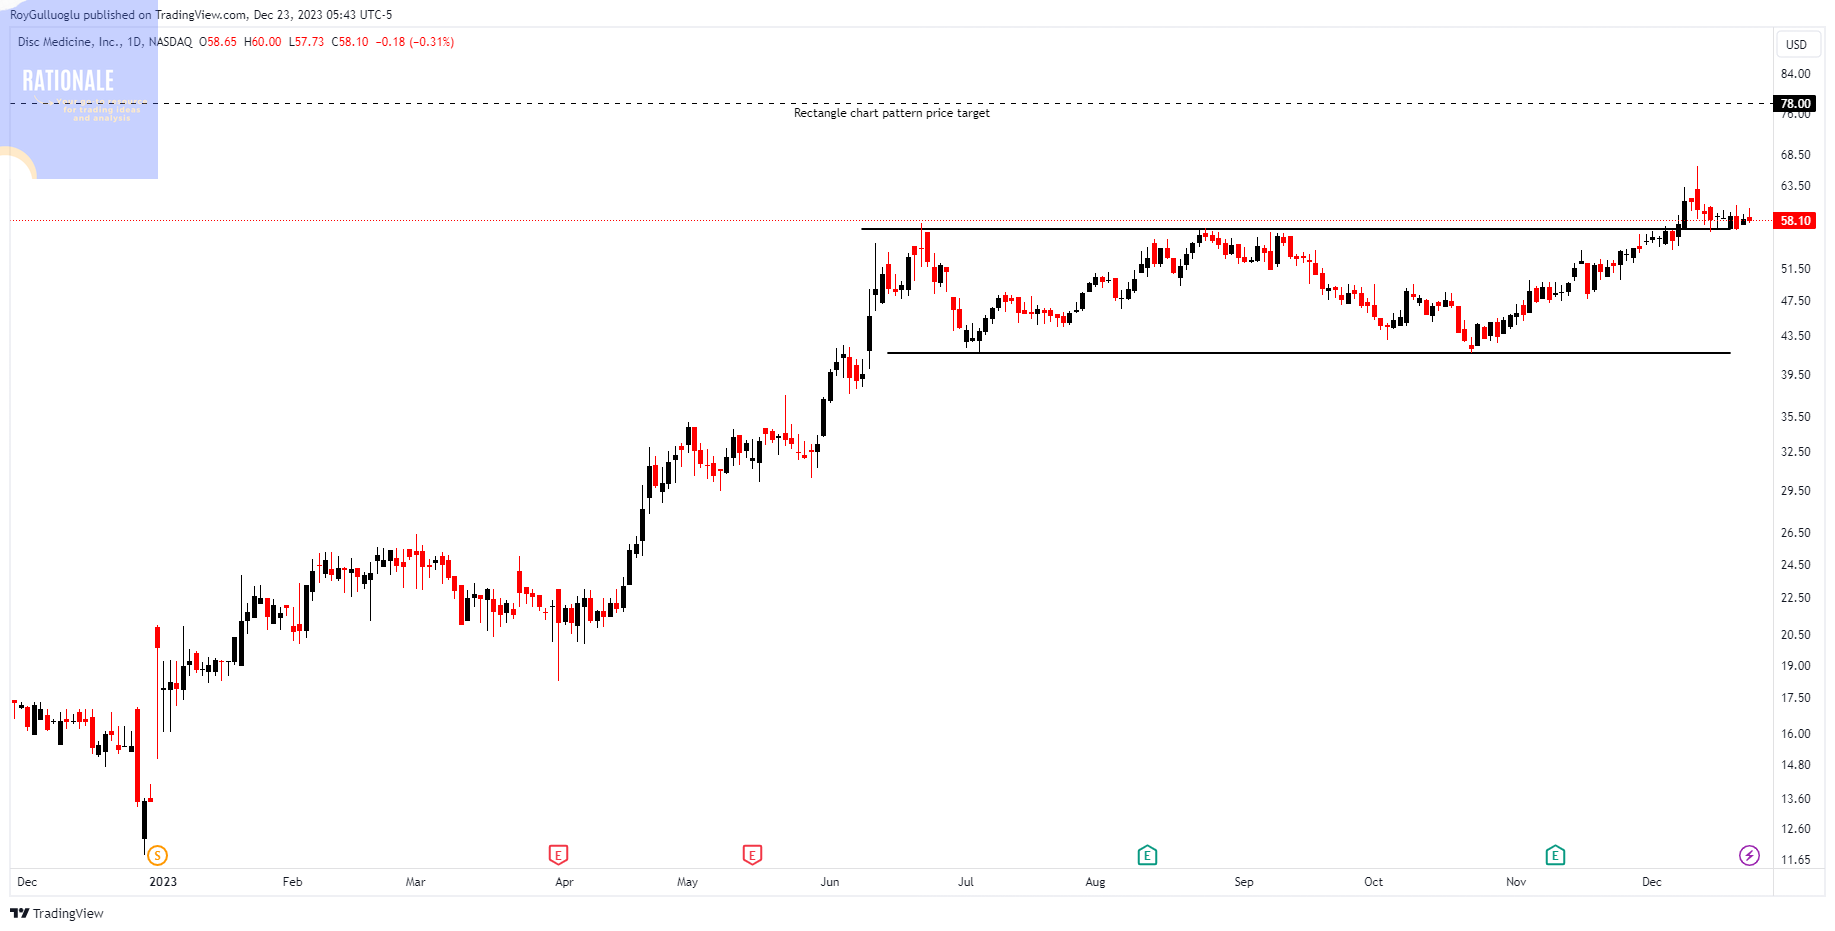
You can click the IRON ticker above to access the first report explaining the RATIONALE behind the trade idea.
The price pulled back to the horizontal boundary after the breakout.