


DoorDash, Inc.-(DASH/NASDAQ)-Long Idea
DoorDash, Inc., together with its subsidiaries, operates a commerce platform that connects merchants, consumers, and dashers in the United States and internationally.
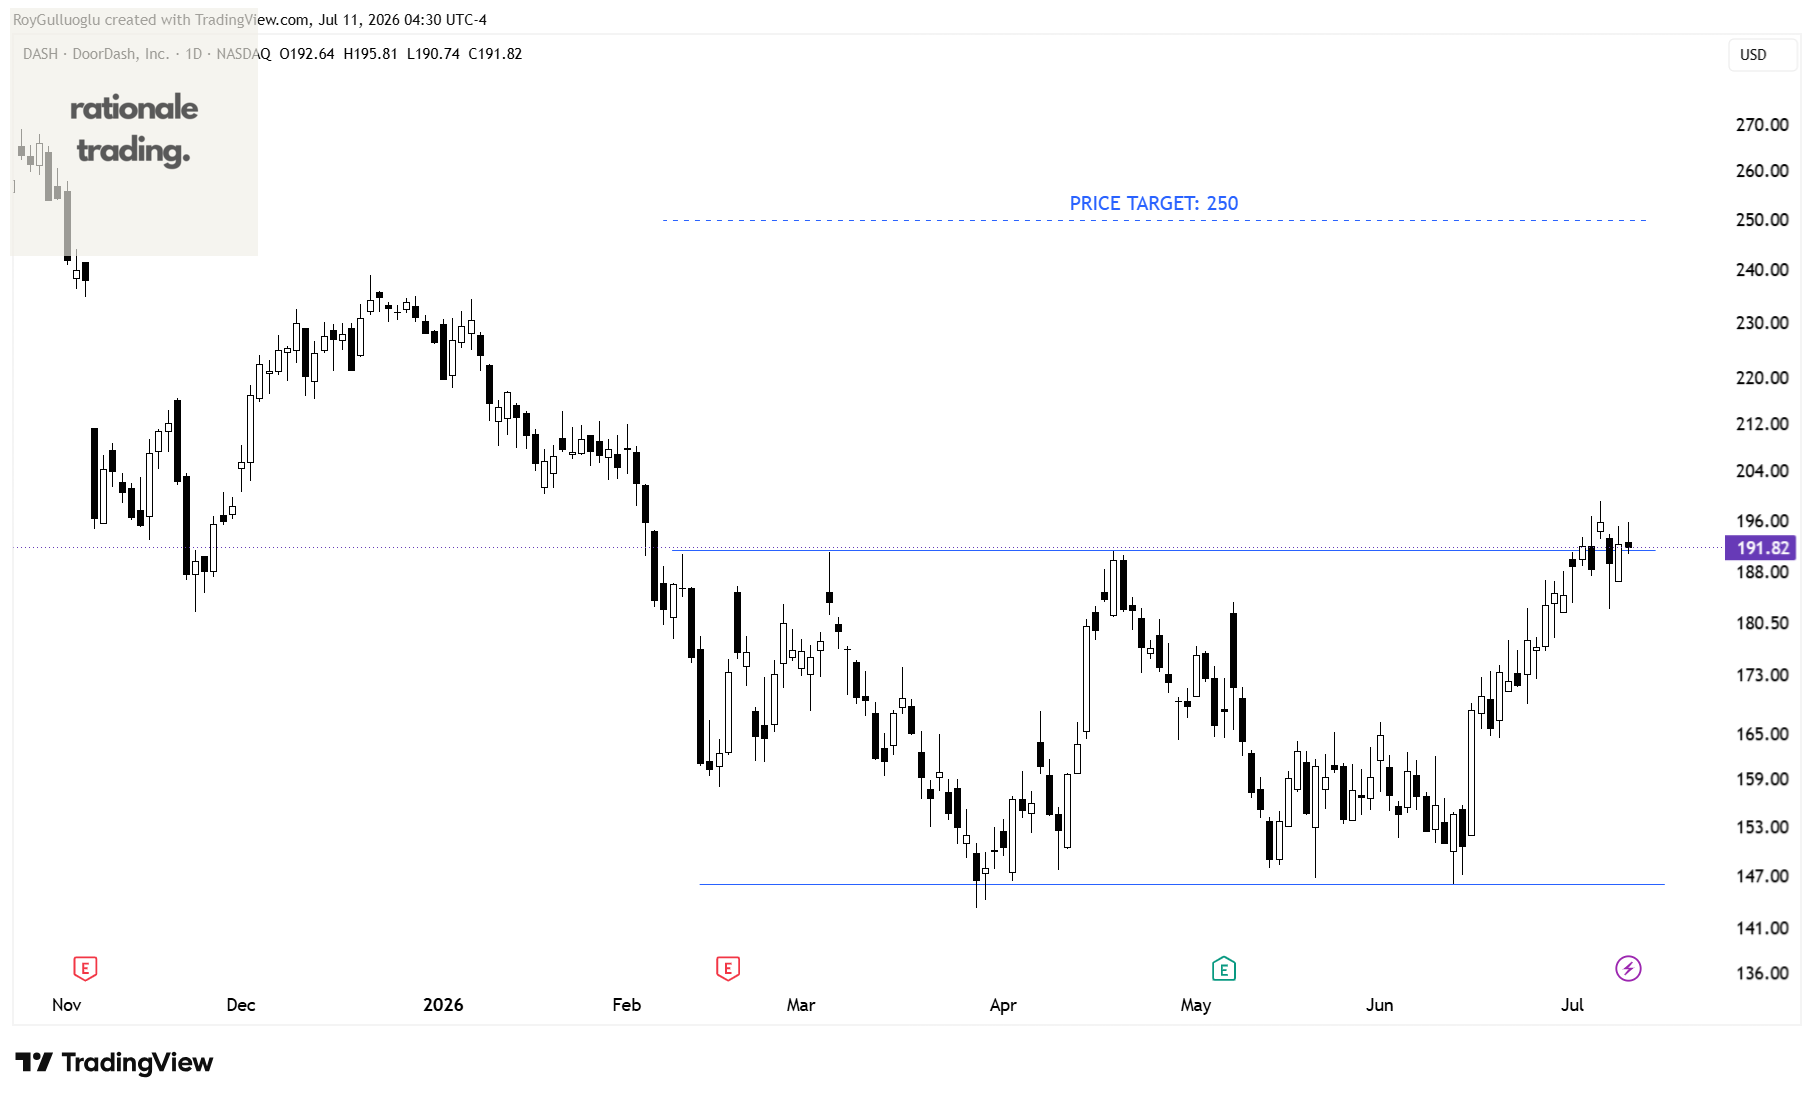
The above daily chart formed an approximately 3-month-long rectangle chart pattern as a bullish reversal after a downtrend.
Within this pattern, the horizontal boundary at 191.39 levels acts as a resistance.
A daily close above 197.13 levels would validate the breakout from the 3-month-long rectangle chart pattern .
Based on this chart pattern, the potential price target is 250 levels.
Expeditors International of Washington, Inc.-(EXPD/NYSE)-Long Idea
Expeditors International of Washington, Inc., together with its subsidiaries, provides logistics services in the Americas, North Asia, South Asia, Europe, and Middle East, Africa, and India.
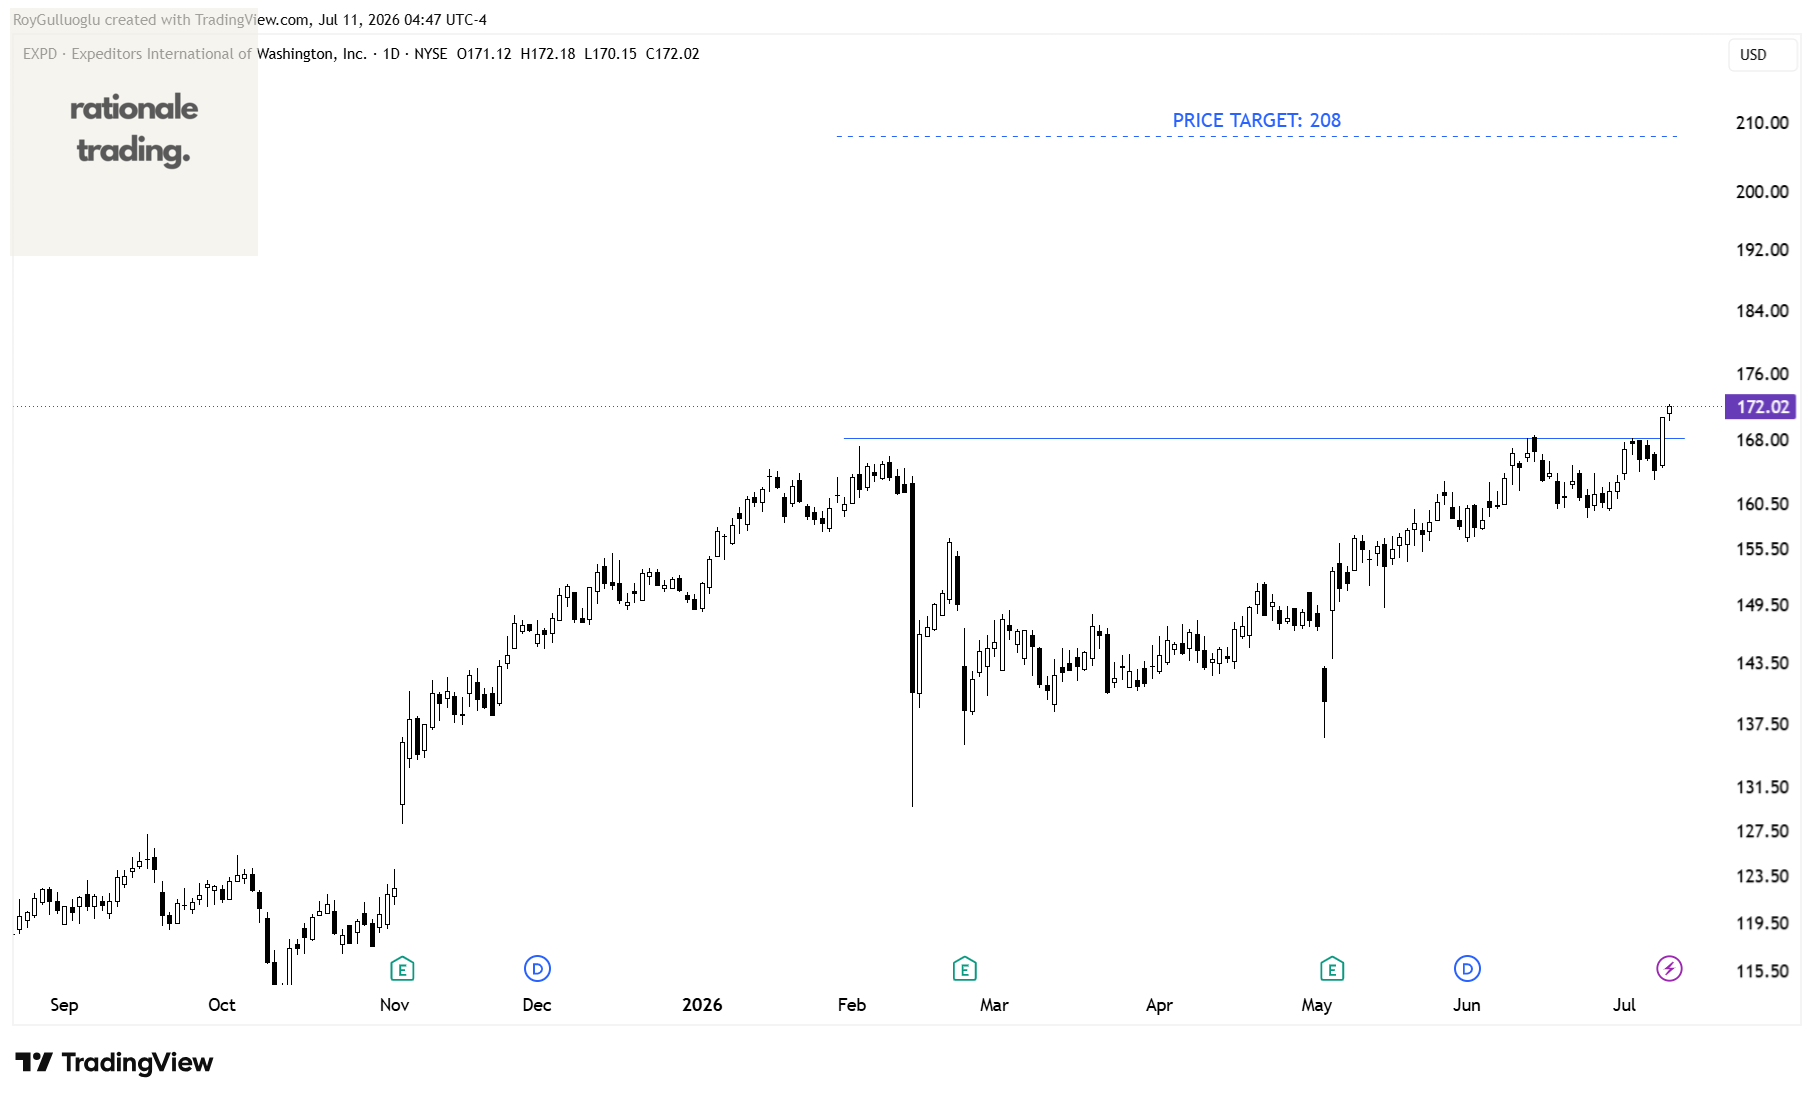
The above daily chart formed an approximately 3-month-long cup & handle chart pattern as a bullish continuation after an uptrend.
Within this pattern, the horizontal boundary at 168.21 levels acts as a resistance.
A daily close above 173.25 levels would validate the breakout from the 3-month-long cup & handle chart pattern.
Based on this chart pattern, the potential price target is 208 levels.
C.H. Robinson Worldwide, Inc.-(CHRW/NASDAQ)-Long Idea
C.H. Robinson Worldwide, Inc., together with its subsidiaries, provides freight transportation and related logistics and supply chain services in the United States and internationally.
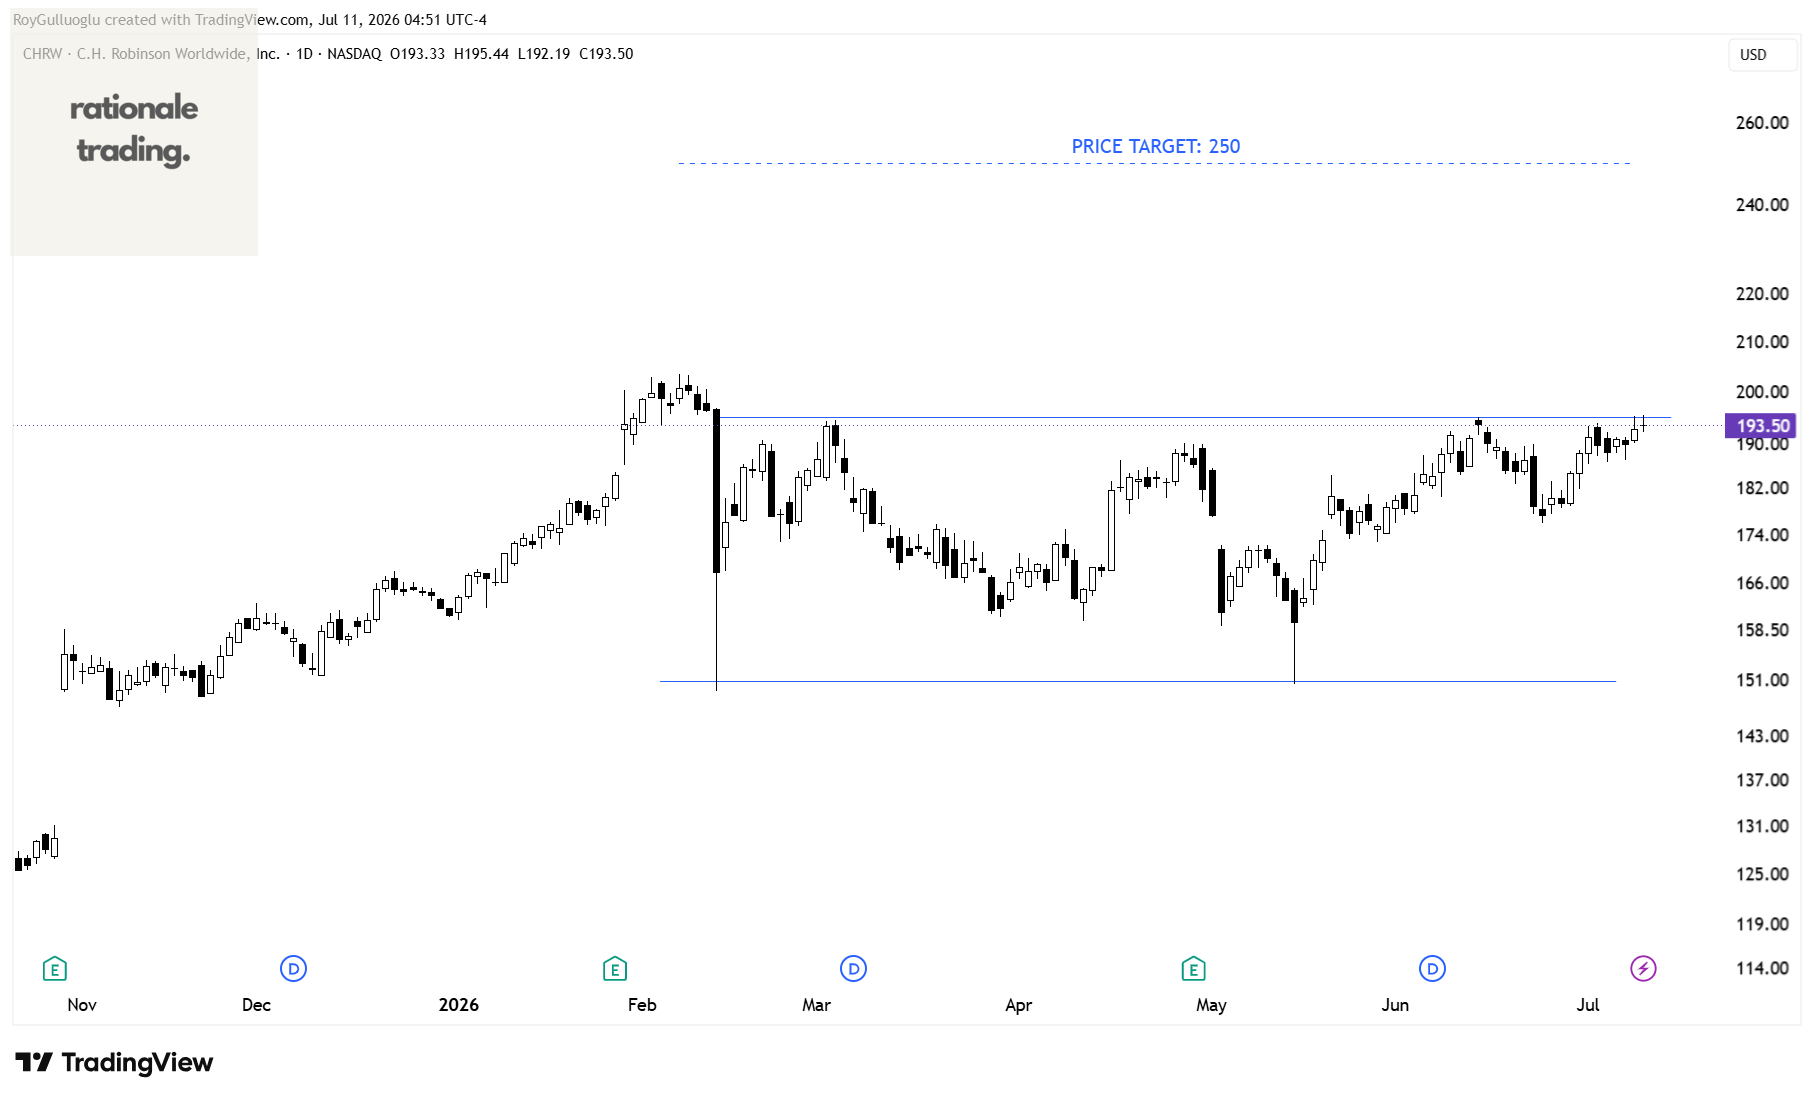
The above daily chart formed an approximately 3-month-long rectangle chart pattern as a bullish reversal after a downtrend.
Within this pattern, the horizontal boundary at 195 levels acts as a resistance.
A daily close above 200.85 levels would validate the breakout from the 3-month-long rectangle chart pattern .
Based on this chart pattern, the potential price target is 250 levels.
G-III Apparel Group, Ltd.-(GIII/NASDAQ)-Long Idea
G-III Apparel Group, Ltd. designs, sources, and markets women’s and men’s apparel in the United States and internationally.
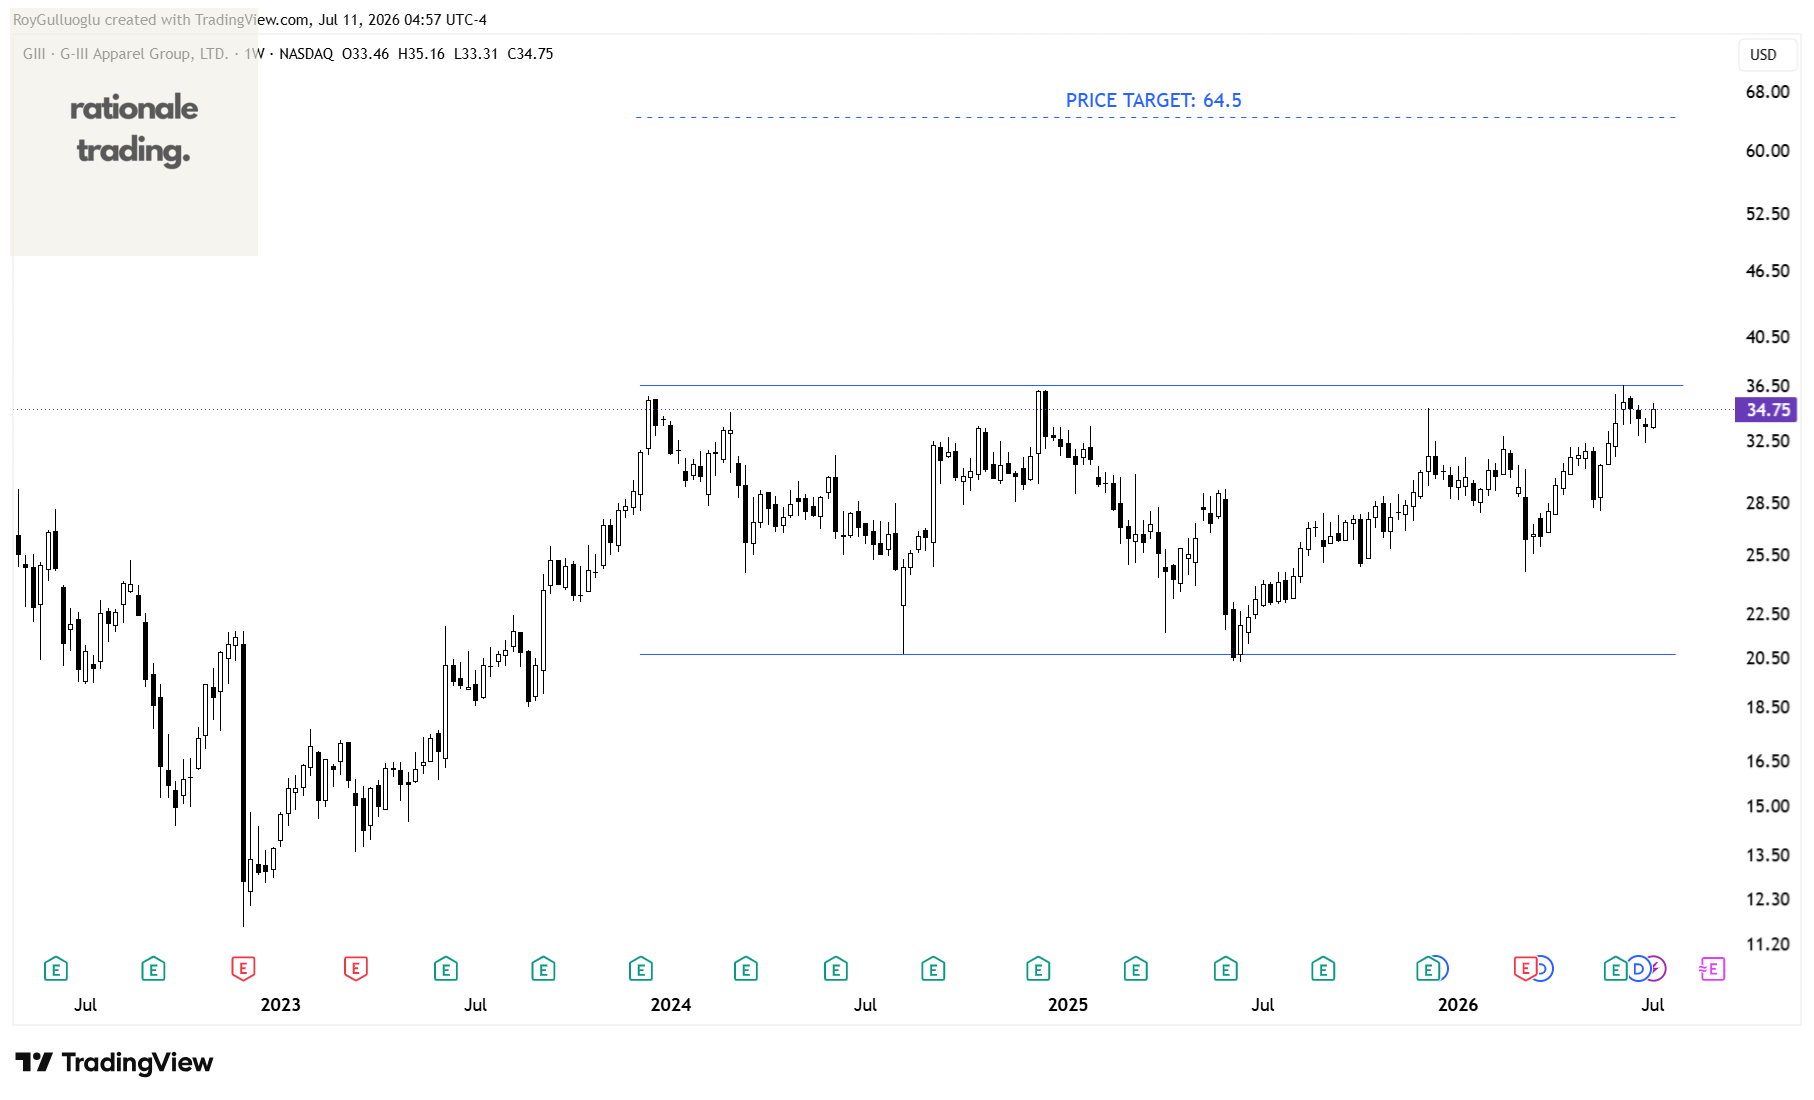
The above weekly chart formed an approximately 33-month-long rectangle chart pattern as a bullish continuation after an uptrend.
Within this pattern, the horizontal boundary at 36.53 levels acts as a resistance.
A daily close above 37.62 levels would validate the breakout from the 33-month-long rectangle chart pattern.
Based on this chart pattern, the potential price target is 64.5 levels.
AMETEK, Inc.-(AME/NYSE)-Long Idea
AMETEK, Inc. manufactures and sells electronic instruments (EIG) and electromechanical (EMG) devices in the United States and internationally.
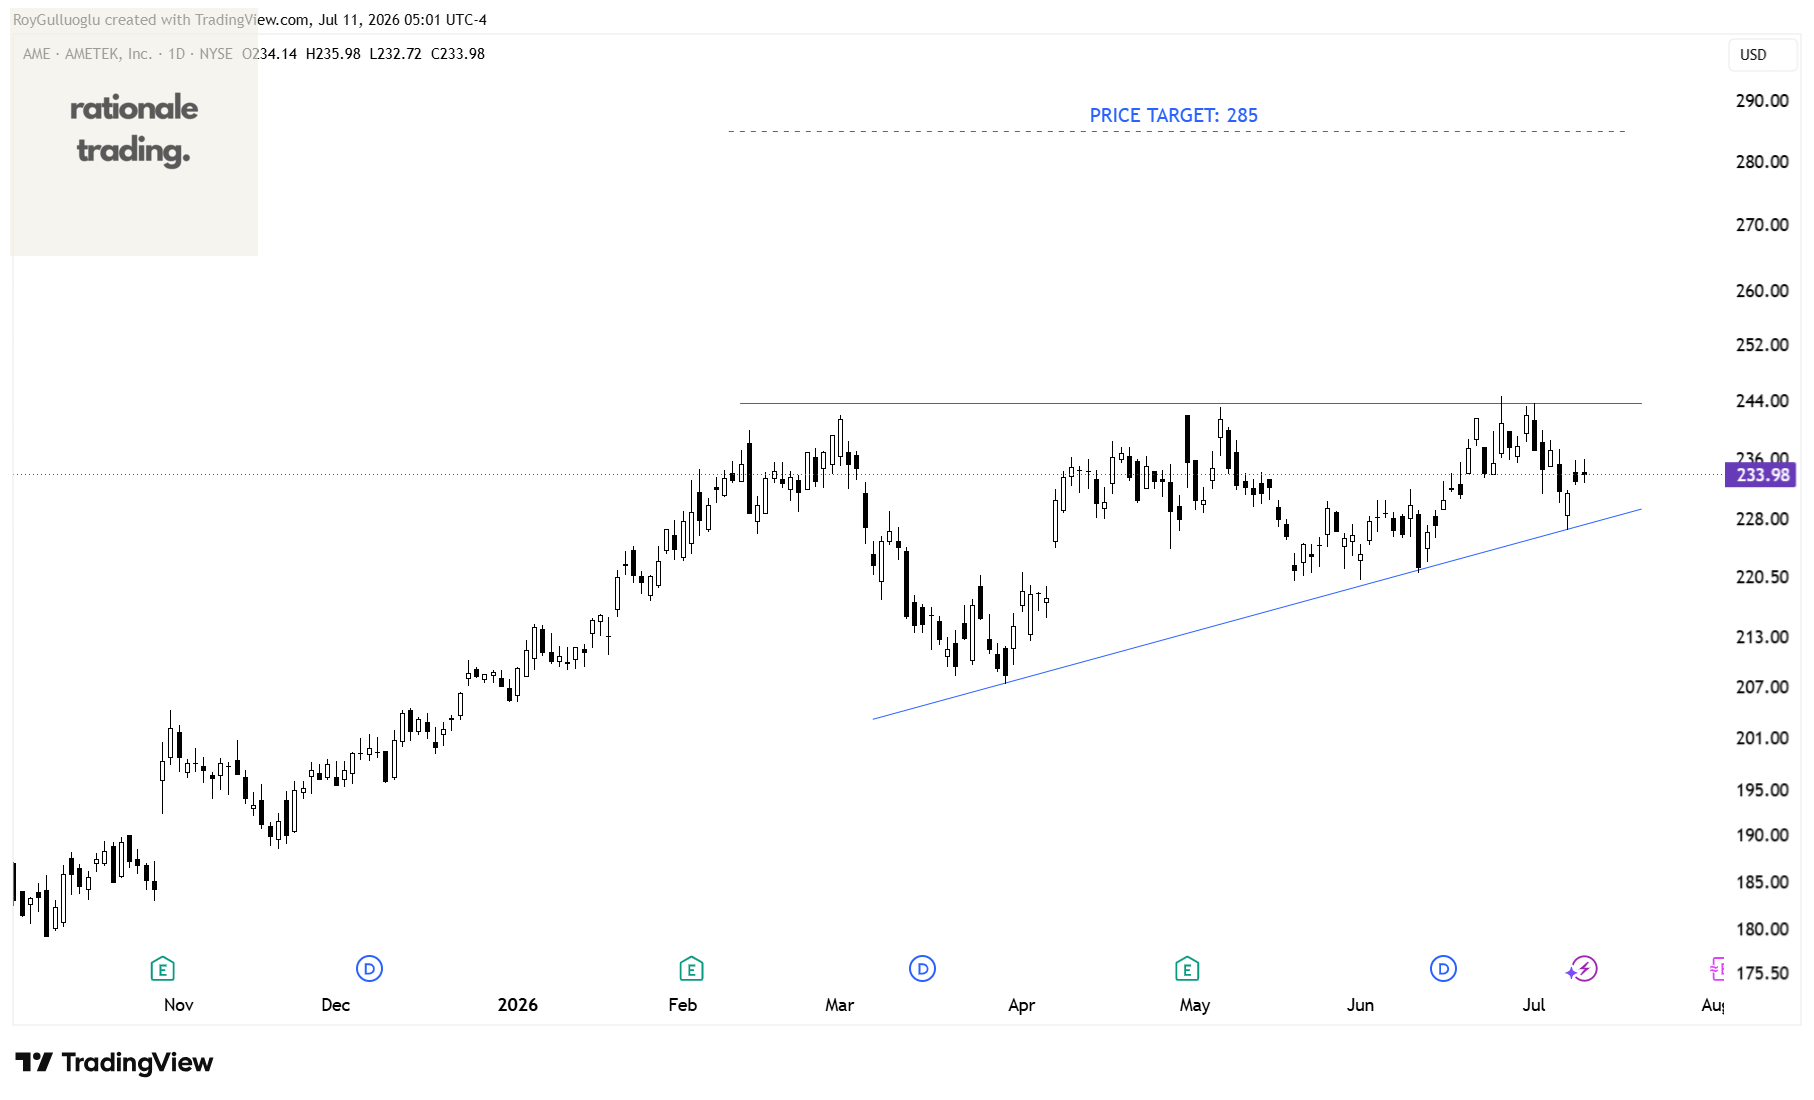
The above daily chart formed an approximately 3-month-long ascending triangle chart pattern as a bullish continuation after an uptrend.
Within this pattern, the horizontal boundary at 243.63 levels acts as a resistance.
A daily close above 251 levels would validate the breakout from the 3-month-long ascending triangle chart pattern.
Based on this chart pattern, the potential price target is 285 levels.
Suprajit Engineering Limited-(SUPRAJIT/NSE)-Long Idea
Suprajit Engineering Limited manufactures and sells automotive cables, halogen lamps, speedometers, and other automotive components in India, the United States, and internationally.
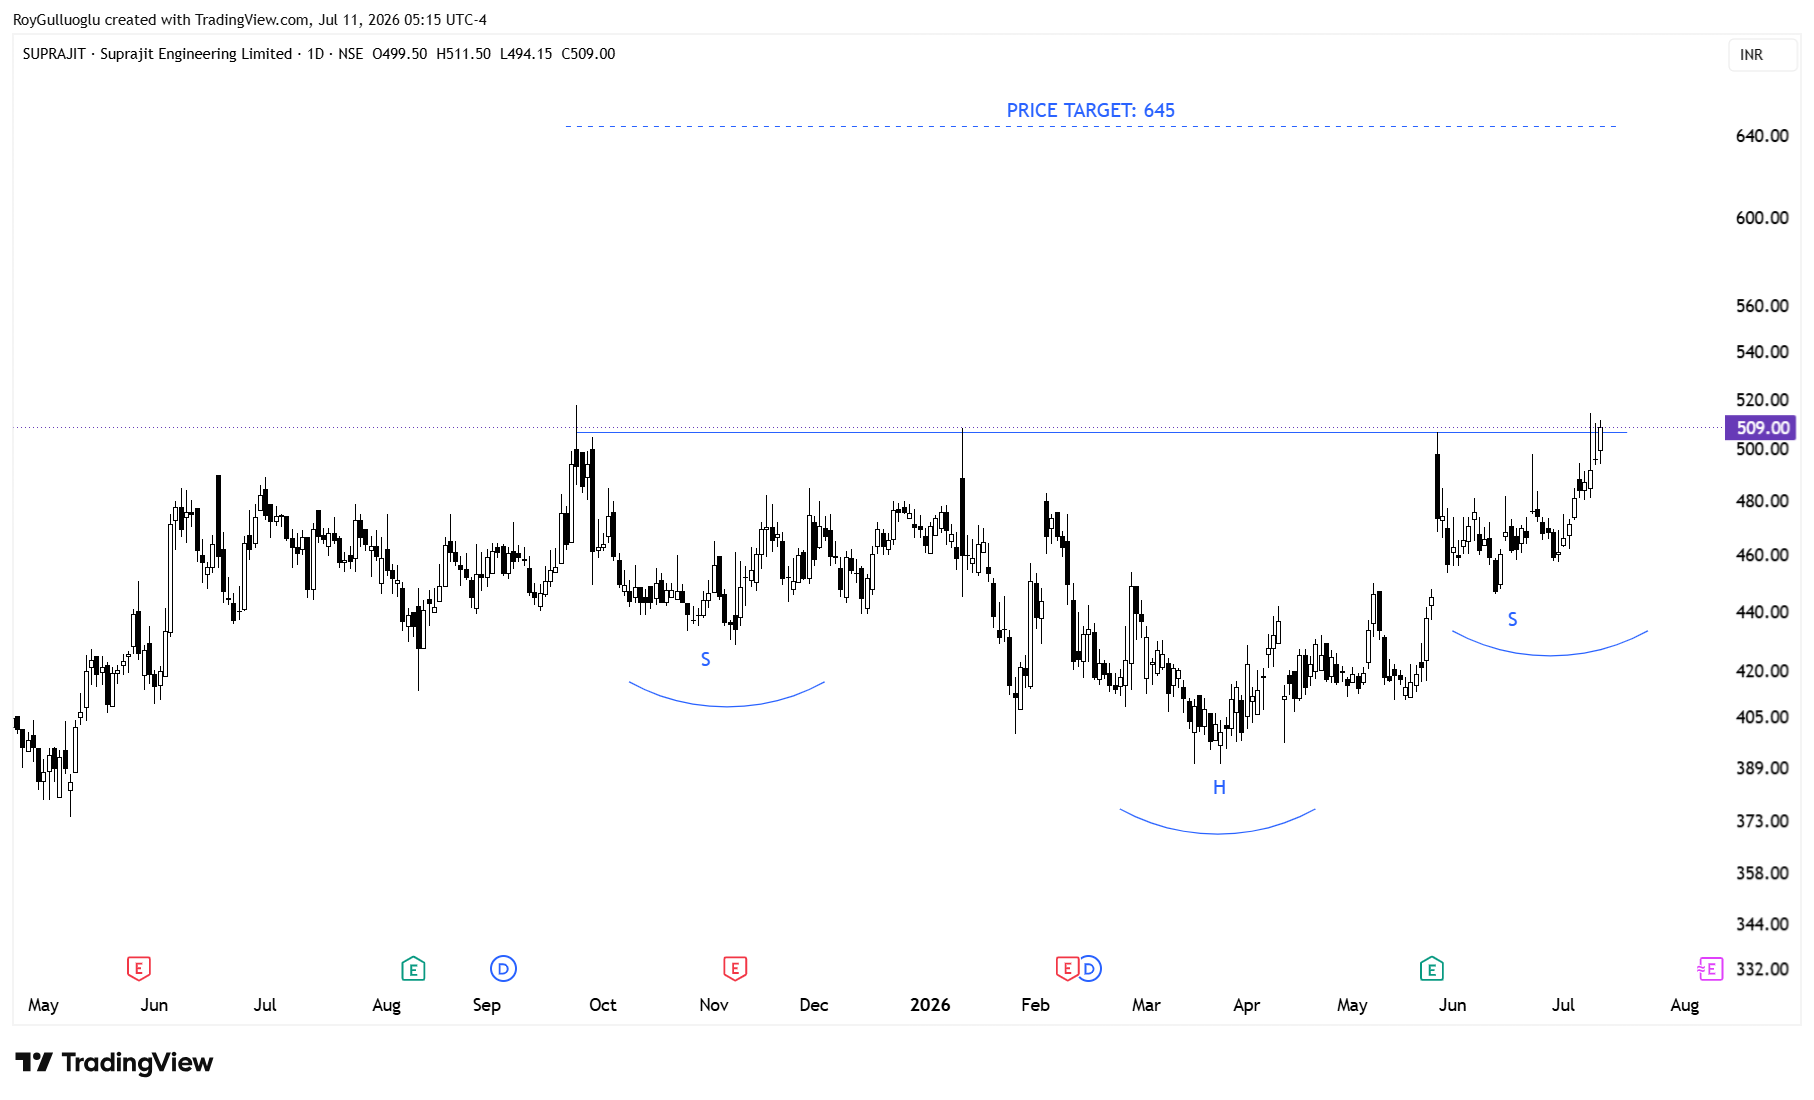
The above daily chart formed an approximately 6-month-long H&S continuation chart pattern as a bullish continuation after an uptrend.
Within this pattern, the horizontal boundary at 509 levels acts as a resistance.
A daily close above 524.2 levels would validate the breakout from the 6-month-long H&S continuation chart pattern.
Based on this chart pattern, the potential price target is 645 levels.
Pricol Limited-(PRICOLLTD/NSE)-Long Idea
Pricol Limited, together with its subsidiaries, manufactures and sells instrument clusters and other allied automobile components to original equipment manufacturers and replacement markets in India and internationally
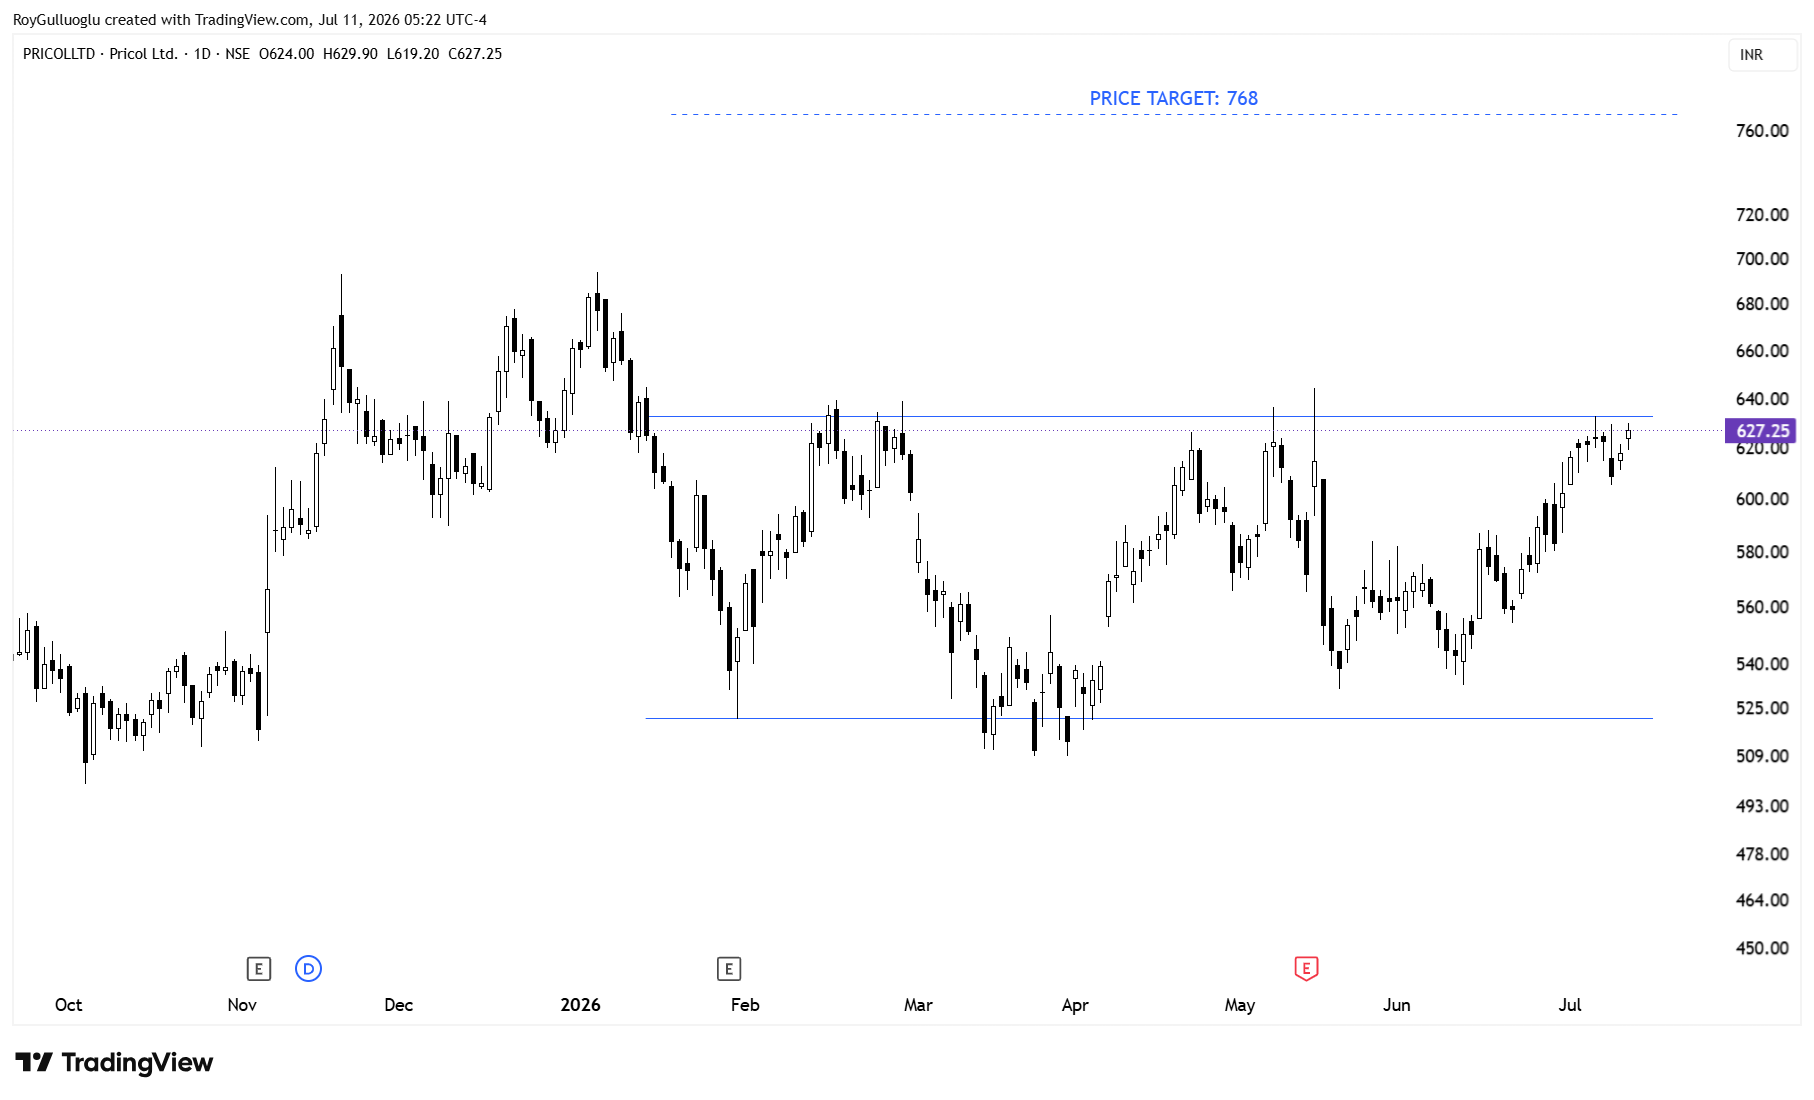
The above daily chart formed an approximately 3-month-long rectangle chart pattern as a bullish reversal after a downtrend.
Within this pattern, the horizontal boundary at 632.75 levels acts as a resistance.
A daily close above 651.75 levels would validate the breakout from the 3-month-long rectangle chart pattern .
Based on this chart pattern, the potential price target is 768 levels.