

Trade Ideas Equities
GSF(NASDAQ), CLFD(NASDAQ), LDOS(NYSE), GSL(NYSE), TAVHL(BIST), SCR(TSX)

GlobalFoundries Inc.-(GFS/NASDAQ)-Long Idea
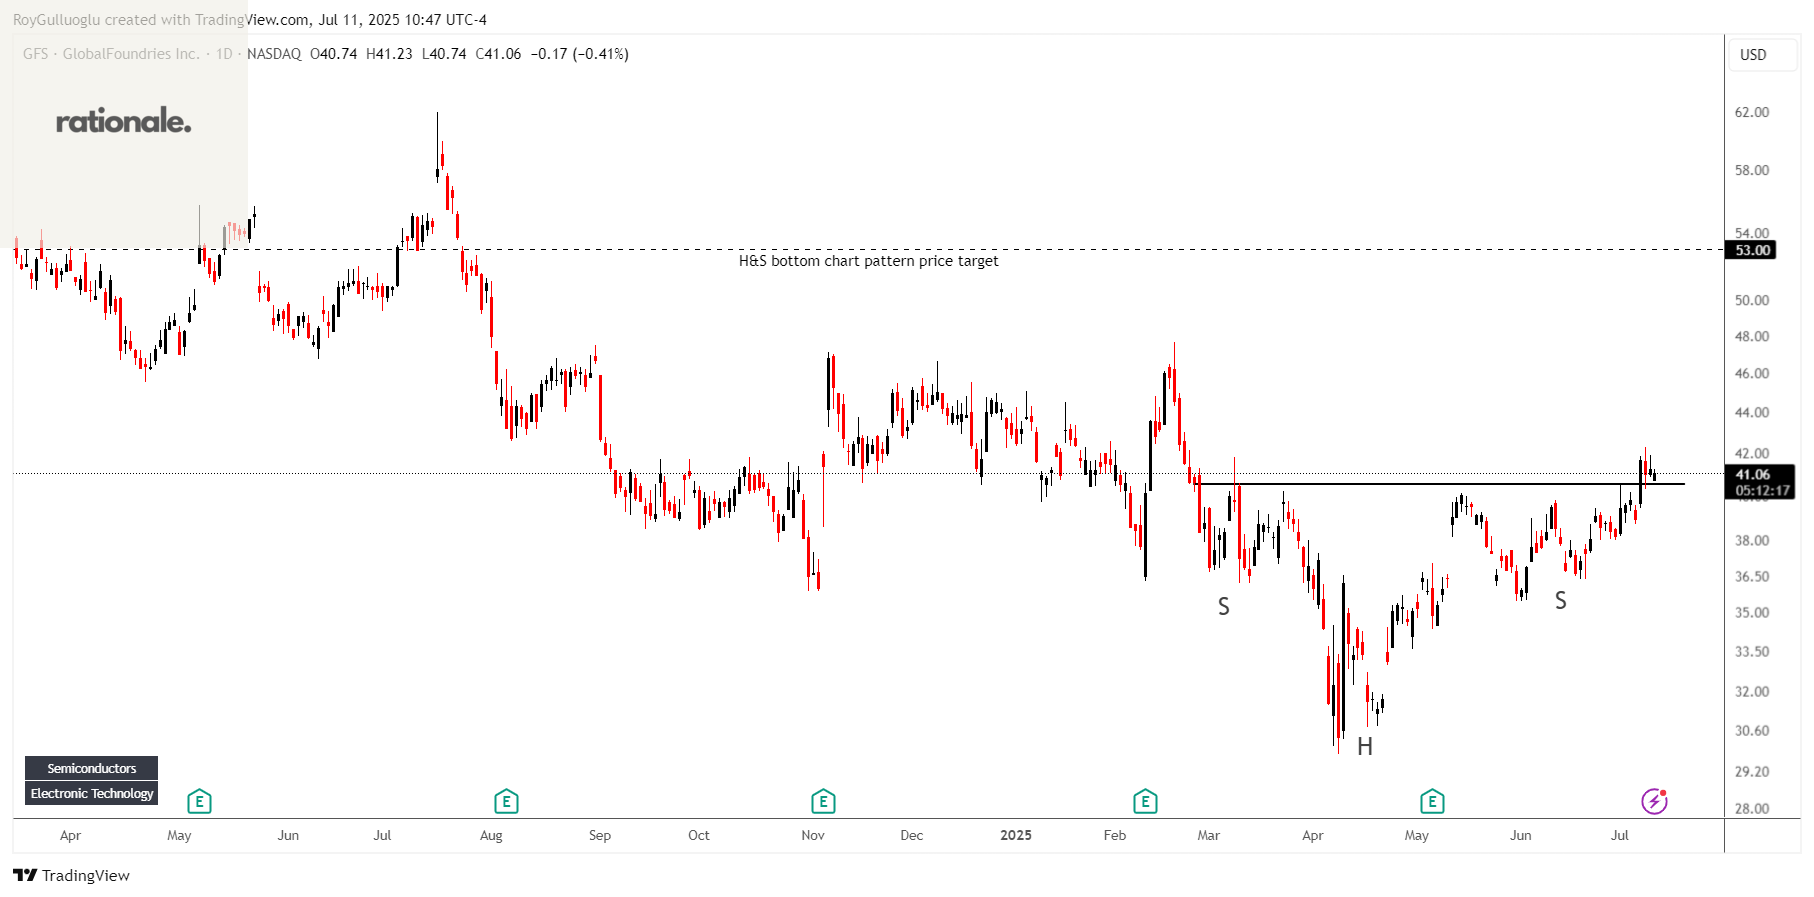
GlobalFoundries Inc., a semiconductor foundry, provides range of mainstream wafer fabrication services and technologies worldwide.
The above daily chart formed an approximately 3-month-long H&S bottom chart pattern as a bullish reversal after a downtrend.
The horizontal boundary at 40.5 levels acts as a resistance within this pattern.
A daily close above 41.7 levels would validate the breakout from the 3-month-long H&S bottom chart pattern.
Based on this chart pattern, the potential price target is 53 levels.
GFS, classified under the "technology" sector, falls under the “Large Cap - Growth” stock category.
Clearfield, Inc.-(CLFD/NASDAQ)-Long Idea
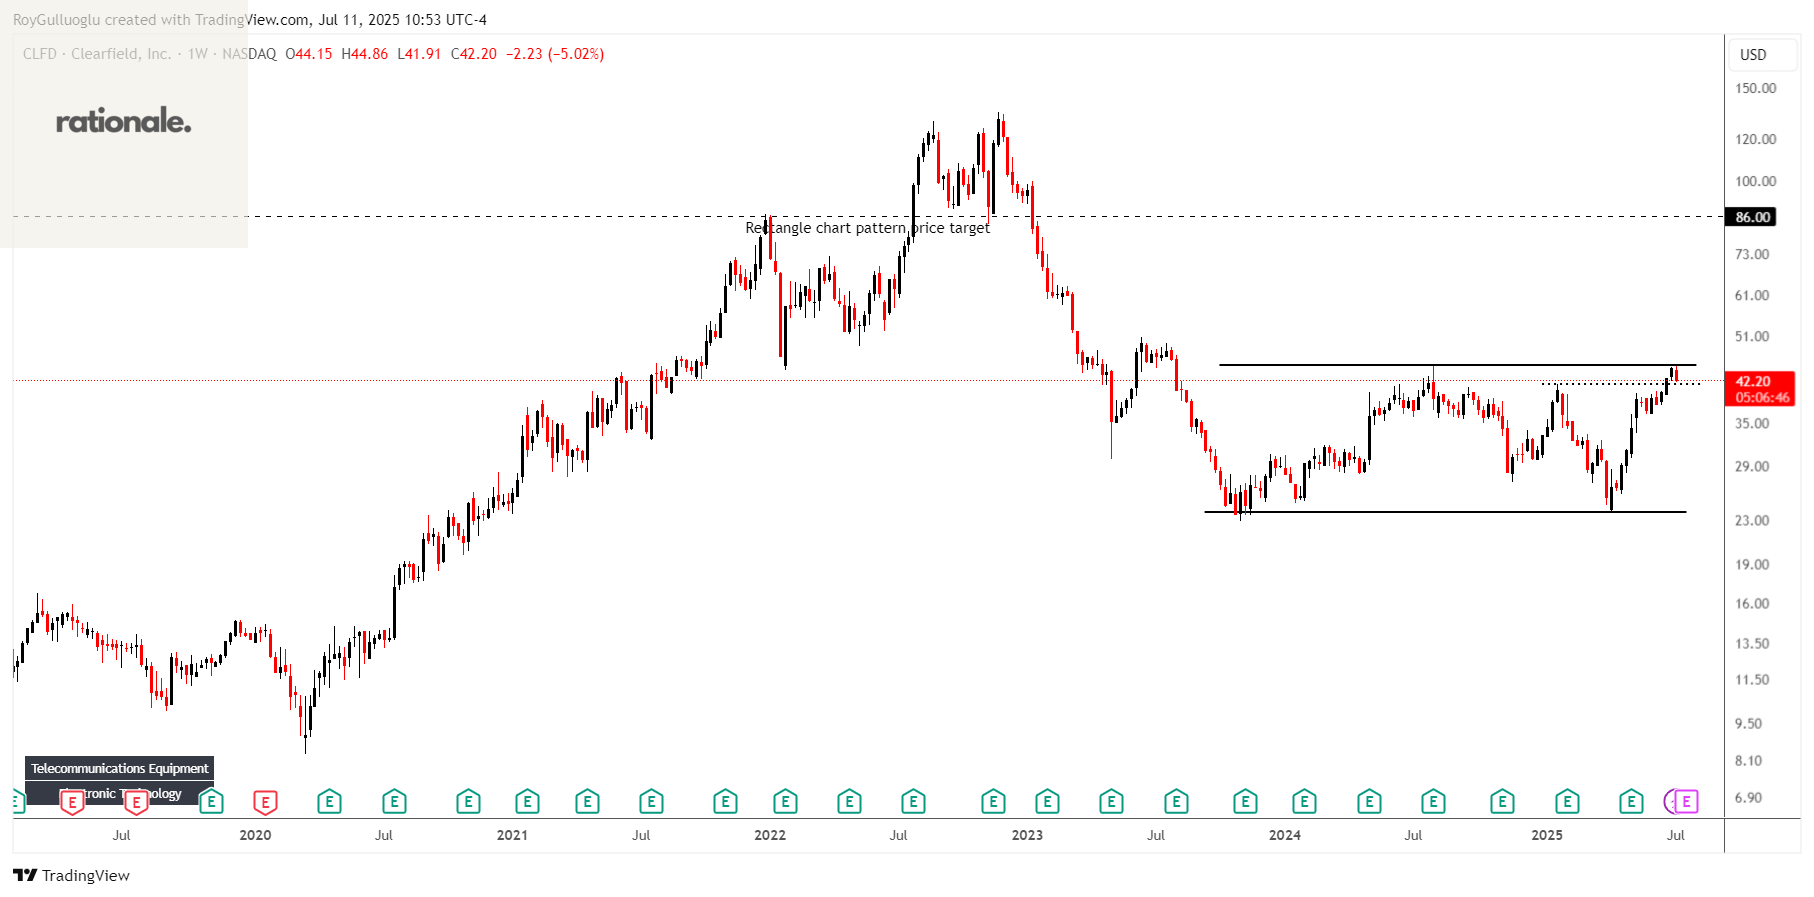
Clearfield, Inc. manufactures and sells various fiber connectivity products in the United States and internationally.
The above weekly chart formed an approximately 22-month-long rectangle chart pattern as a bullish reversal after a downtrend.
The horizontal boundary at 45 levels acts as a resistance within this pattern.
A daily close above 46.35 levels would validate the breakout from the 22-month-long rectangle chart pattern.
Based on this chart pattern, the potential price target is 86 levels.
CLFD, classified under the "technology" sector, falls under the “Small Cap - Growth” stock category.
Leidos Holdings, Inc.-(LDOS/NYSE)-Long Idea
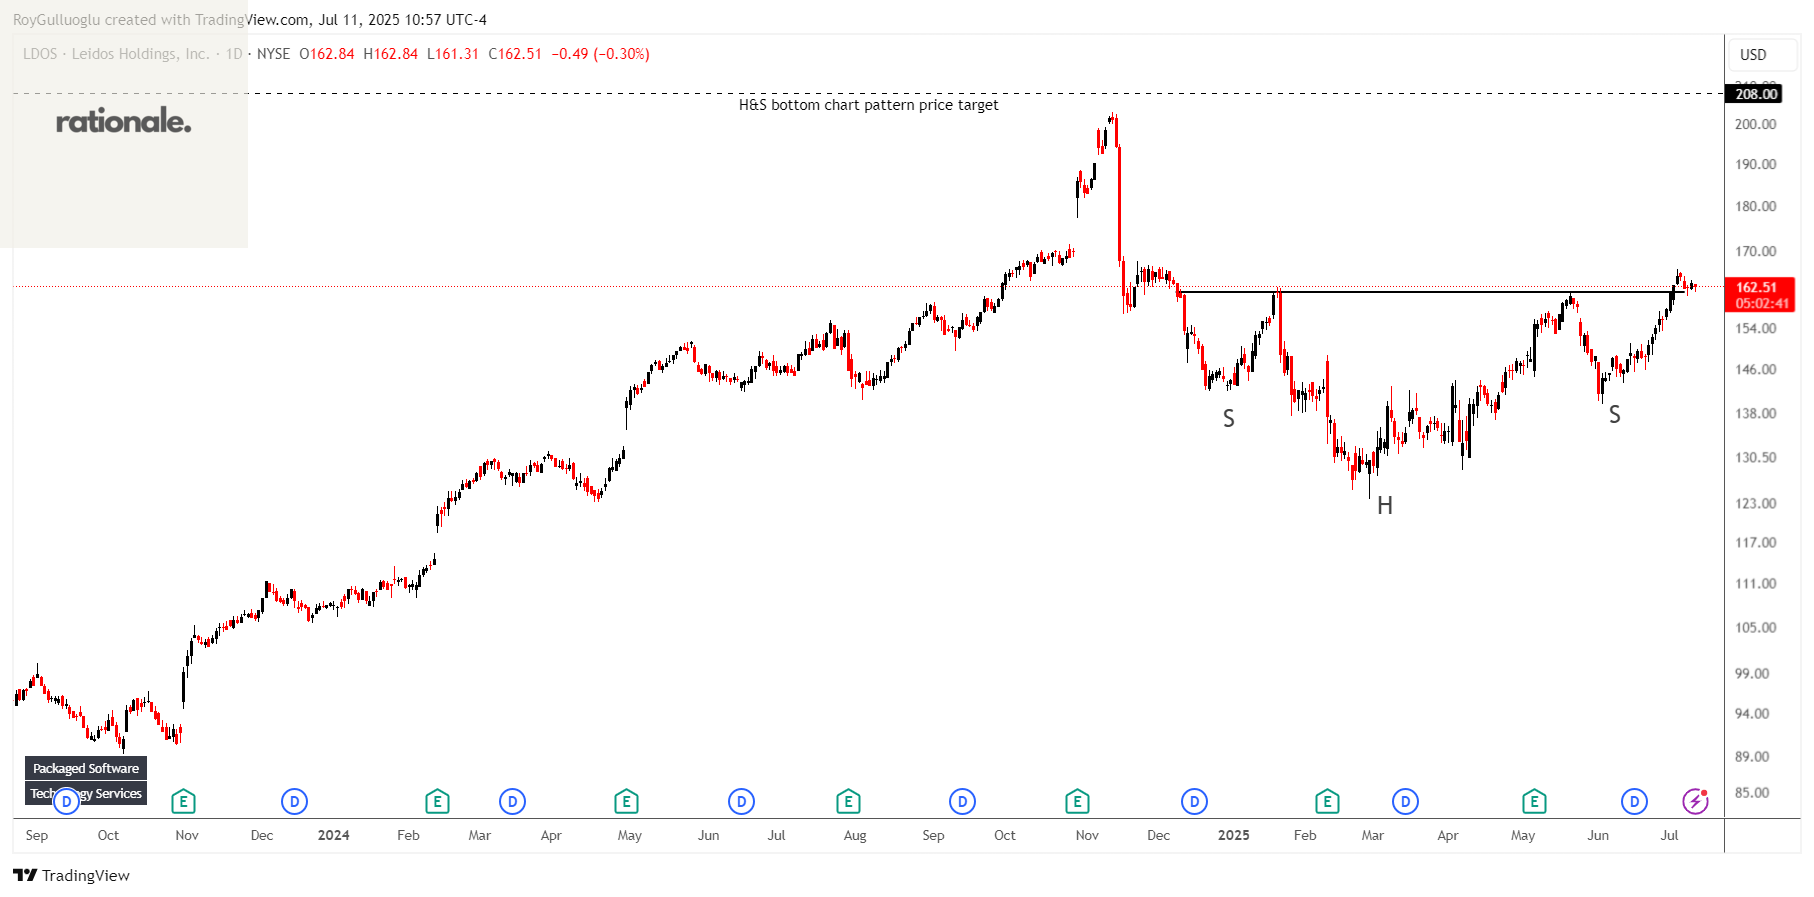
Leidos Holdings, Inc., together with its subsidiaries, provides services and solutions for government and commercial customers in the United States and internationally.
The above daily chart formed an approximately 4-month-long H&S bottom chart pattern as a bullish reversal after a downtrend.
The horizontal boundary at 161 levels acts as a resistance within this pattern.
A daily close above 165.8 levels would validate the breakout from the 4-month-long H&S bottom chart pattern.
Based on this chart pattern, the potential price target is 208 levels.
LDOS, classified under the "technology" sector, falls under the “Large Cap - Growth” stock category.
Global Ship Lease, Inc.-(GSL/NYSE)-Long Idea
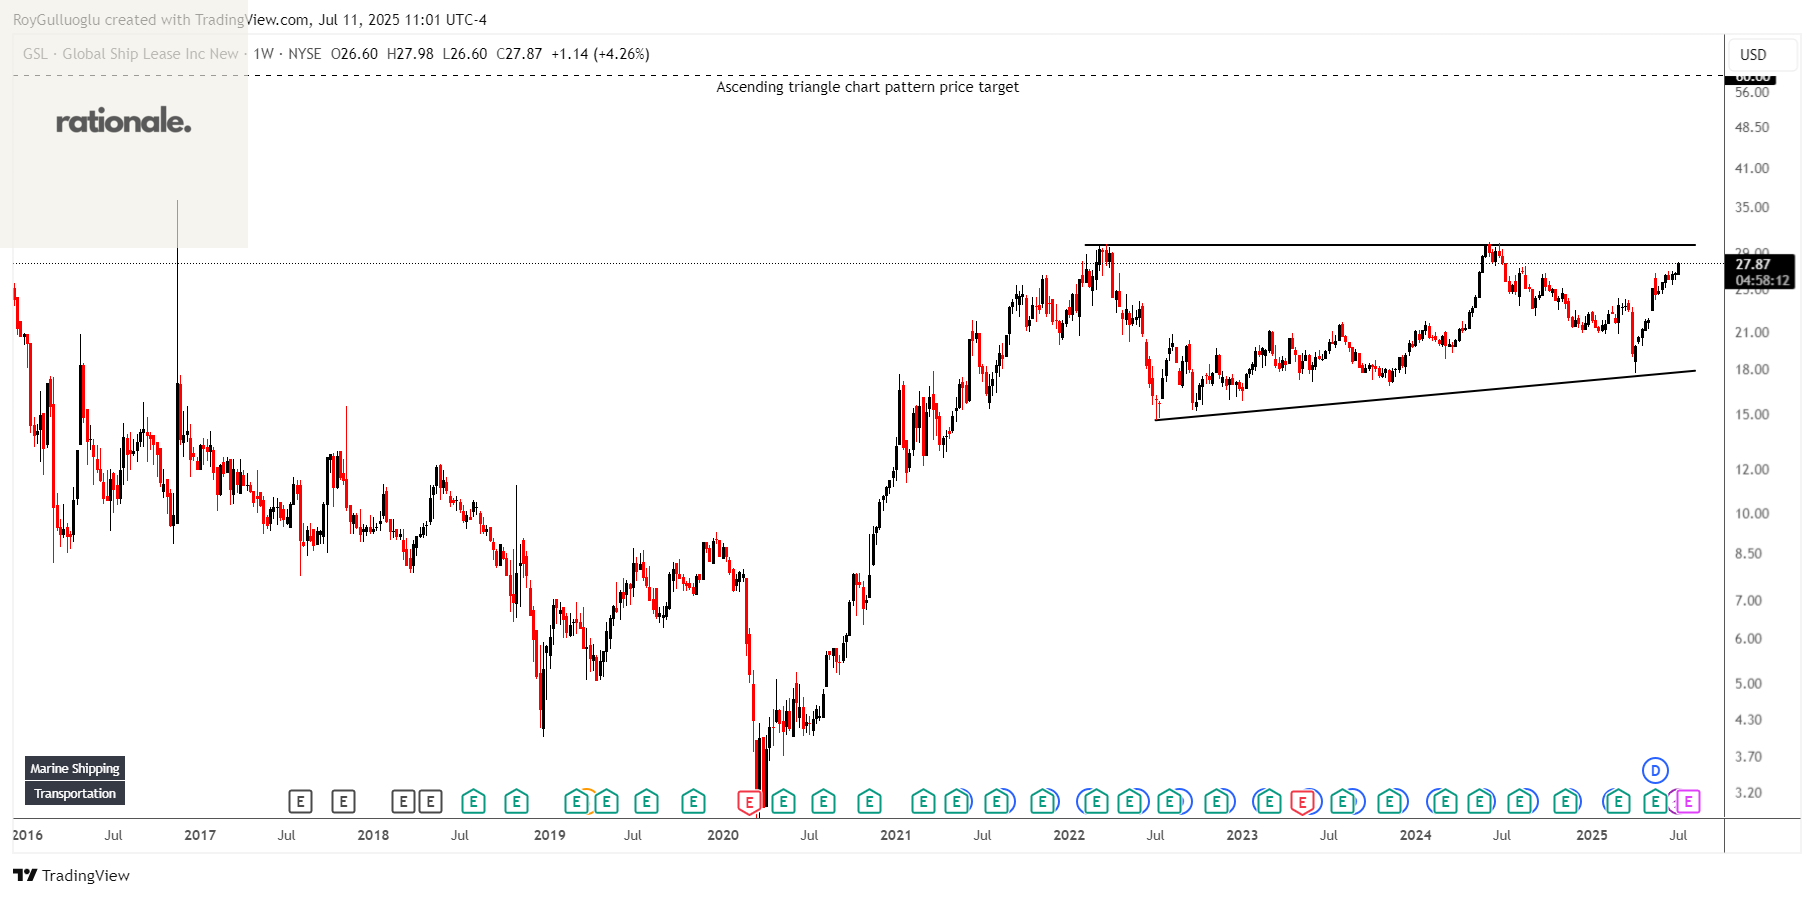
Global Ship Lease, Inc., together with its subsidiaries, engages in owning and chartering of containerships under fixed-rate charters to container shipping companies worldwide.
The above daily chart formed an approximately 45-month-long ascending triangle chart pattern as a bullish continuation after an uptrend.
The horizontal boundary at 30 levels acts as a resistance within this pattern.
A daily close above 30.9 levels would validate the breakout from the 45-month-long ascending triangle chart pattern.
Based on this chart pattern, the potential price target is 60 levels.
GSL, classified under the "industrials" sector, falls under the “Small Cap - Value” stock category.
TAV Havalimanlari Holding A.S.-(TAVHL/BIST)-Long Idea
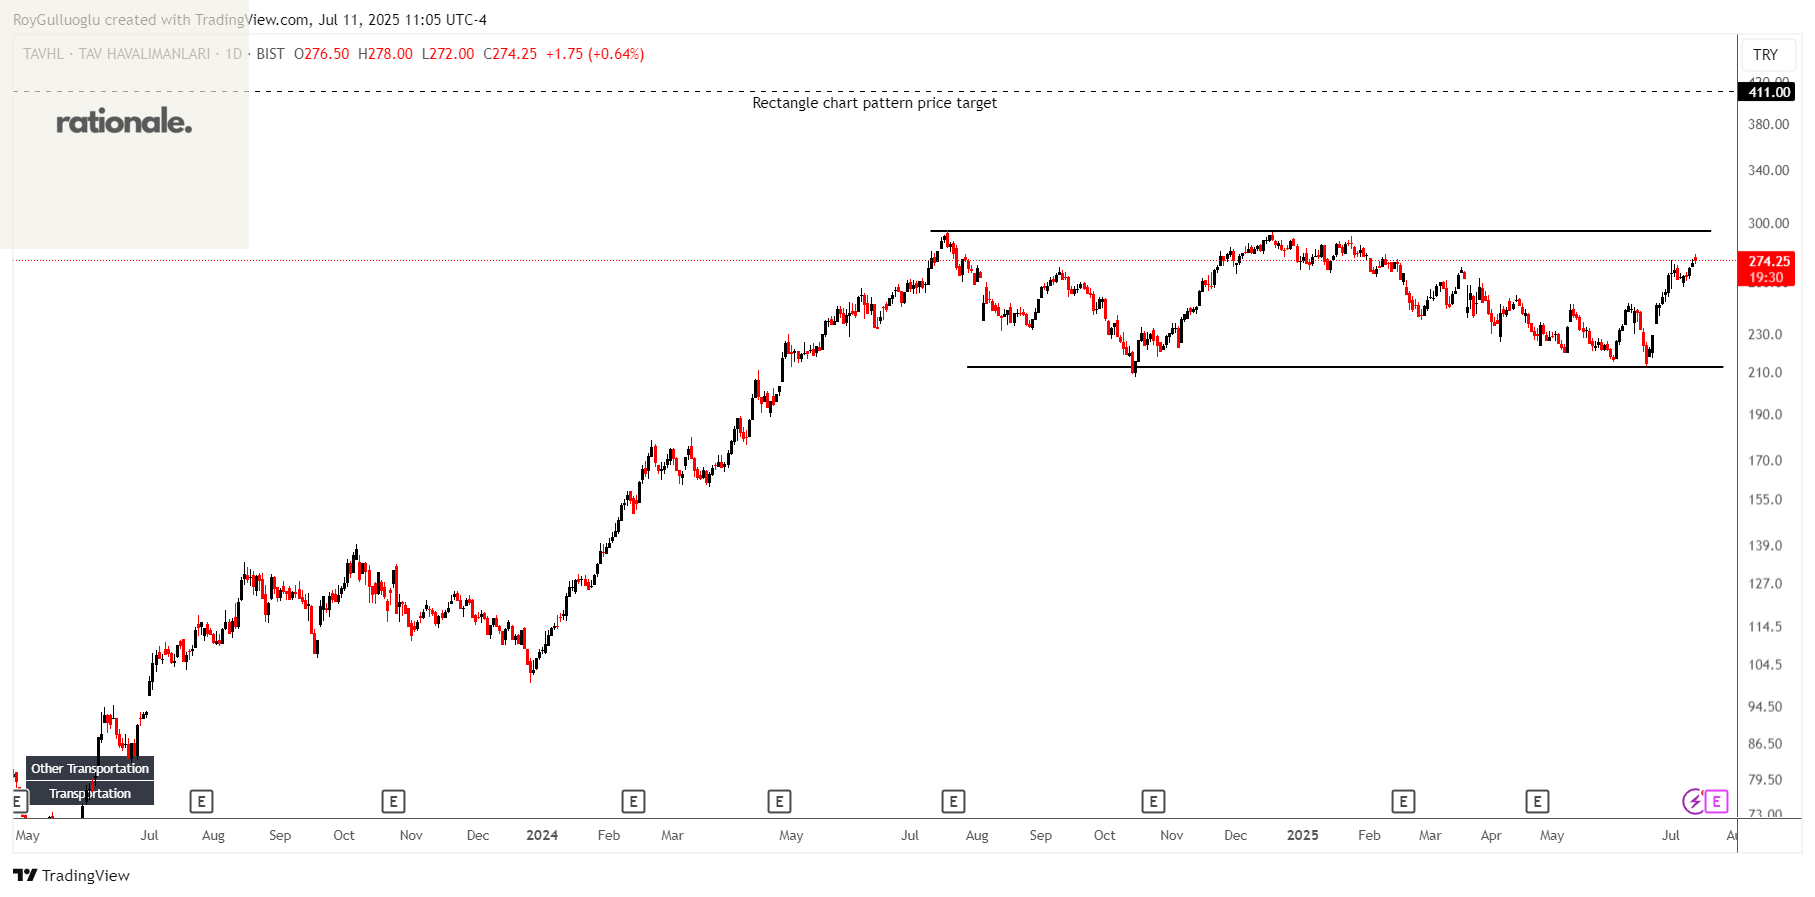
TAV Havalimanlari Holding A.S., together with its subsidiaries, constructs terminal buildings, and manages and operates terminals or airports in Turkey, Georgia, Kazakhstan, Macedonia, Tunisia, Croatia, Oman, Latvia, Spain, Qatar, Saudi Arabia, and internationally.
The above daily chart formed an approximately 8-month-long rectangle chart pattern as a bullish continuation after an uptrend.
The horizontal boundary at 294 levels acts as a resistance within this pattern.
A daily close above 302.8 levels would validate the breakout from the 8-month-long rectangle chart pattern.
Based on this chart pattern, the potential price target is 411 levels.
TAVHL, classified under the "industrials" sector, falls under the “Small Cap - Value” stock category.
Strathcona Resources Ltd.-(SCR/TSX)-Long Idea
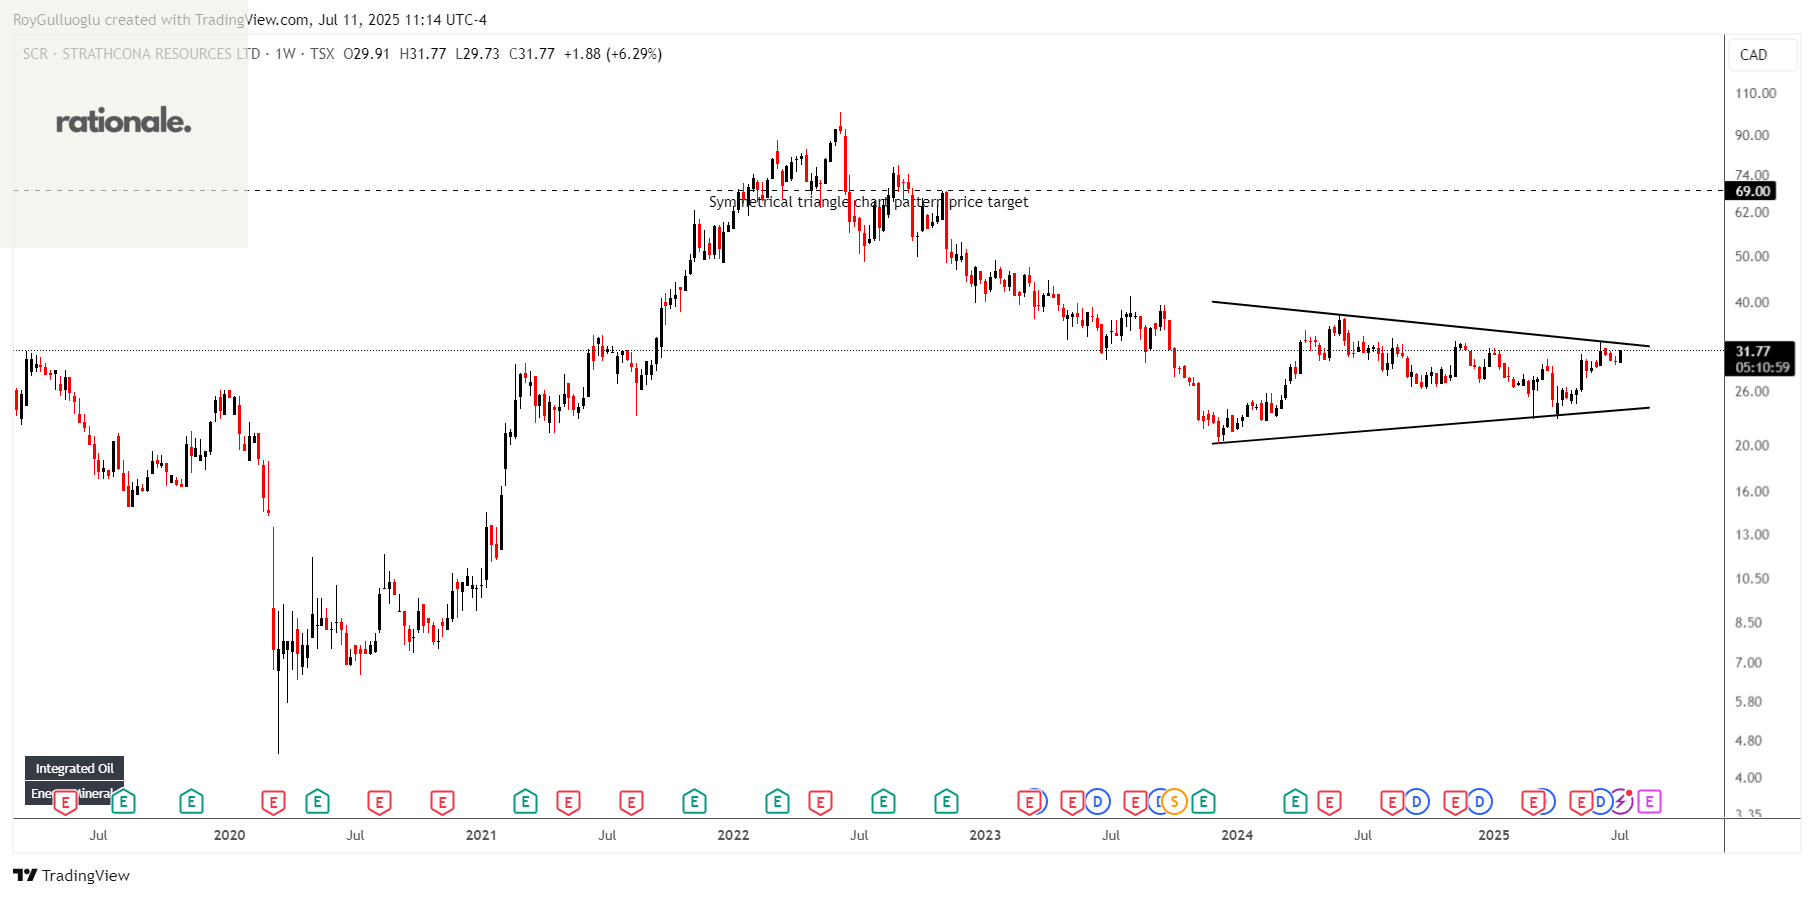
Strathcona Resources Ltd. acquires, explores, develops, and produces petroleum and natural gas reserves in Canada
The above daily chart formed an approximately 20-month-long symmetrical triangle chart pattern as a bullish reversal after a downtrend.
A daily close above 34.1 levels would validate the breakout from the 20-month-long symmetrical triangle chart pattern.
Based on this chart pattern, the potential price target is 69 levels.
SCR, classified under the "energy" sector, falls under the “Mid Cap - Income” stock category.