


New setups
TICKERS: NRIM(NASDAQ), OFG(NYSE), AMAL(NASDAQ), HWC(NASDAQ), NMRK(NASDAQ), SSBK(NASDAQ)
Northrim BanCorp, Inc.-(NRIM/NASDAQ)-Long Idea
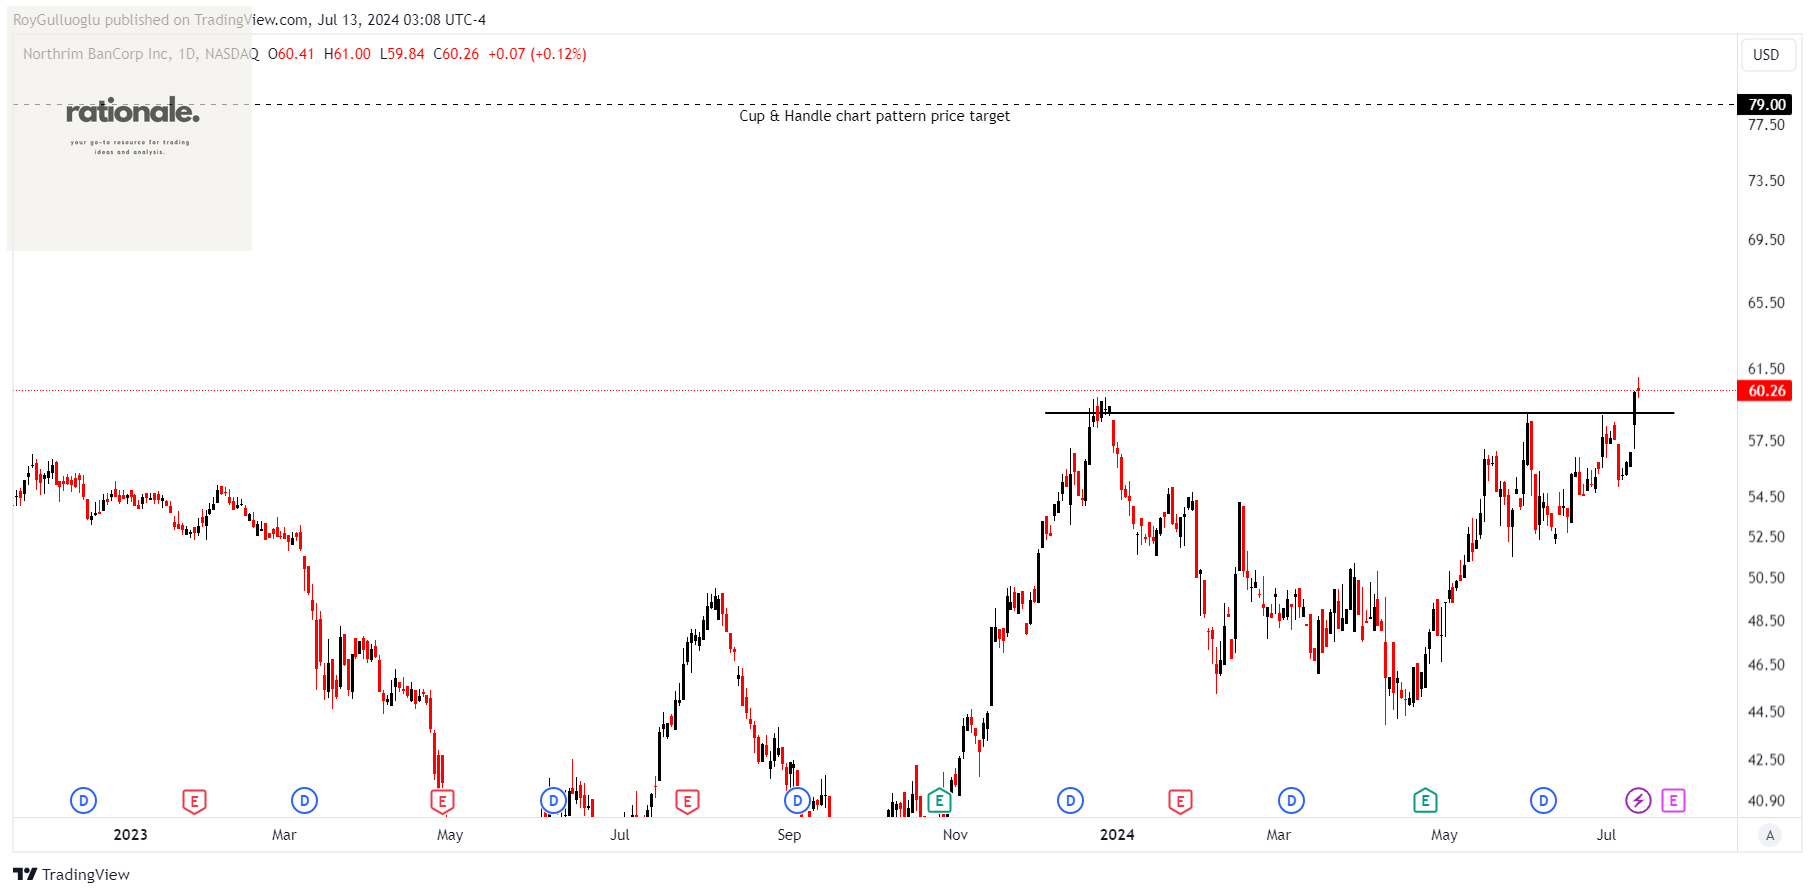
Northrim BanCorp, Inc. is the holding company for Northrim Bank, which offers commercial banking products and services to businesses and professionals.
The above daily chart formed an approximately 5-month-long cup & handle chart pattern as a bullish continuation after an uptrend.
The horizontal boundary at 59 levels acts as a resistance within this pattern.
A daily close above 60.77 levels would validate the breakdown from the 5-month-long cup & handle chart pattern.
Based on this chart pattern, the potential price target is 79 levels.
NRIM, classified under the "financial services" sector, falls under the “Small Cap - Income” stock category.
OFG Bancorp-(OFG/NYSE)-Long Idea
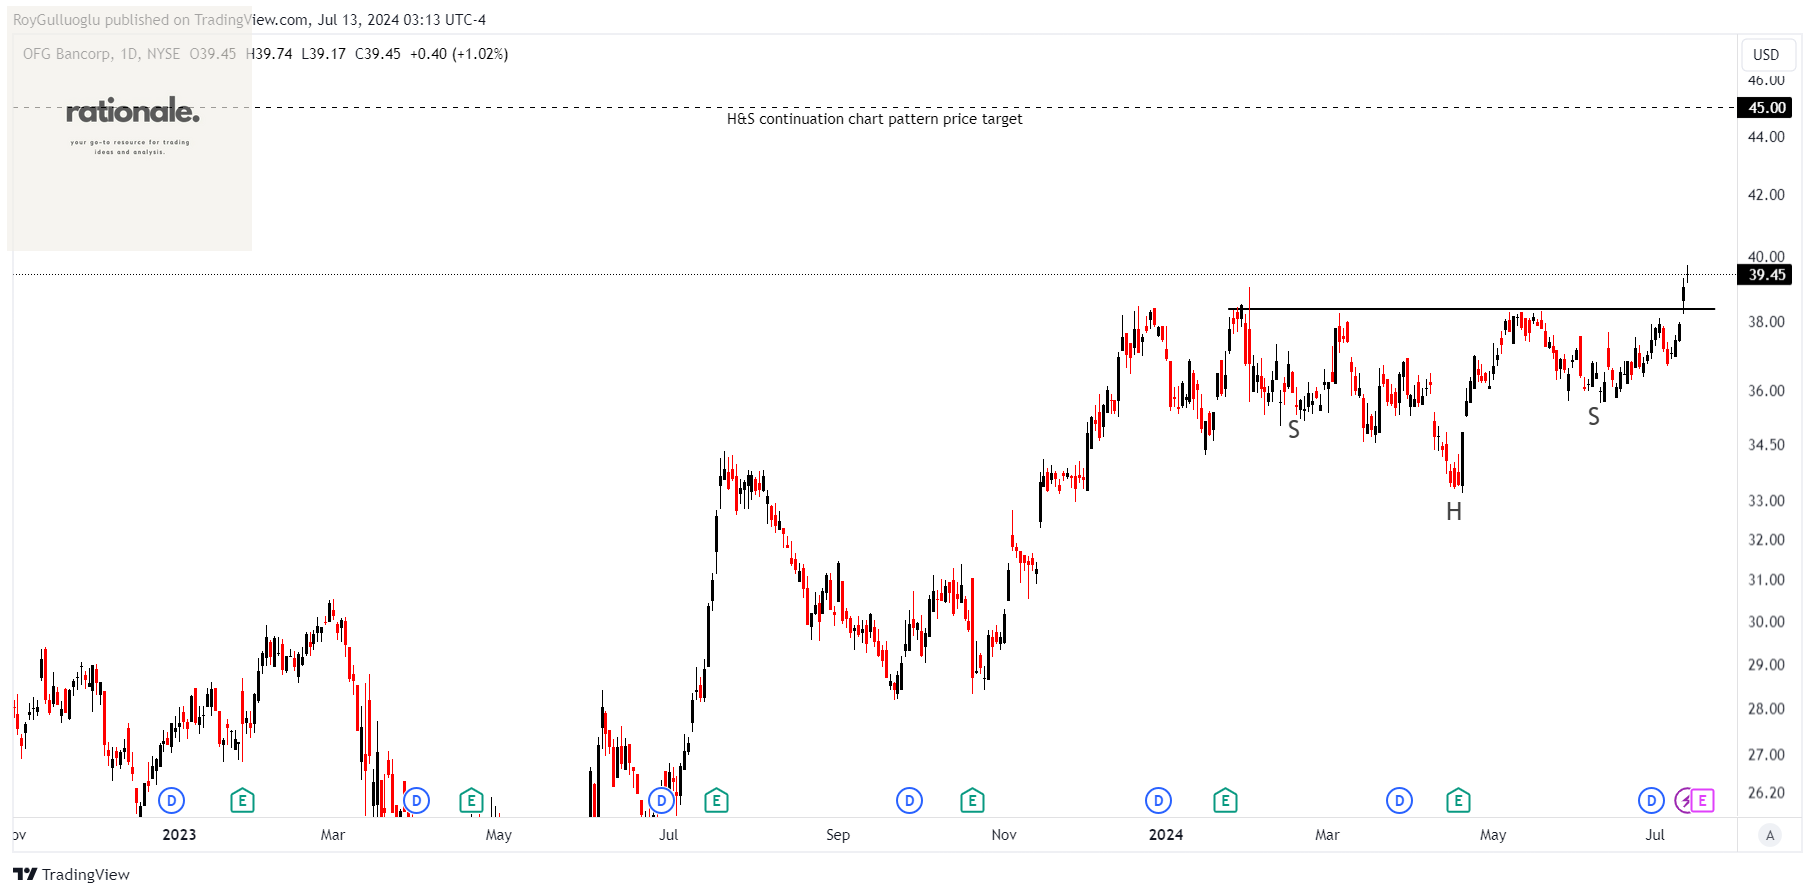
OFG Bancorp, a financial holding company, offers a variety of banking and financial services. It operates through three segments: Banking, Wealth Management, and Treasury.
The above daily chart formed an approximately 4-month-long H&S continuation chart pattern as a bullish continuation after an uptrend.
The horizontal boundary at 38.38 levels acts as a resistance within this pattern.
A daily close above 39.53 levels would validate the breakout from the 4-month-long H&S continuation chart pattern.
Based on this chart pattern, the potential price target is 45 levels.
OFG, classified under the "financial services" sector, falls under the “Small Cap - Income” stock category.
Amalgamated Financial Corp.-(AMAL/NASDAQ)-Long Idea
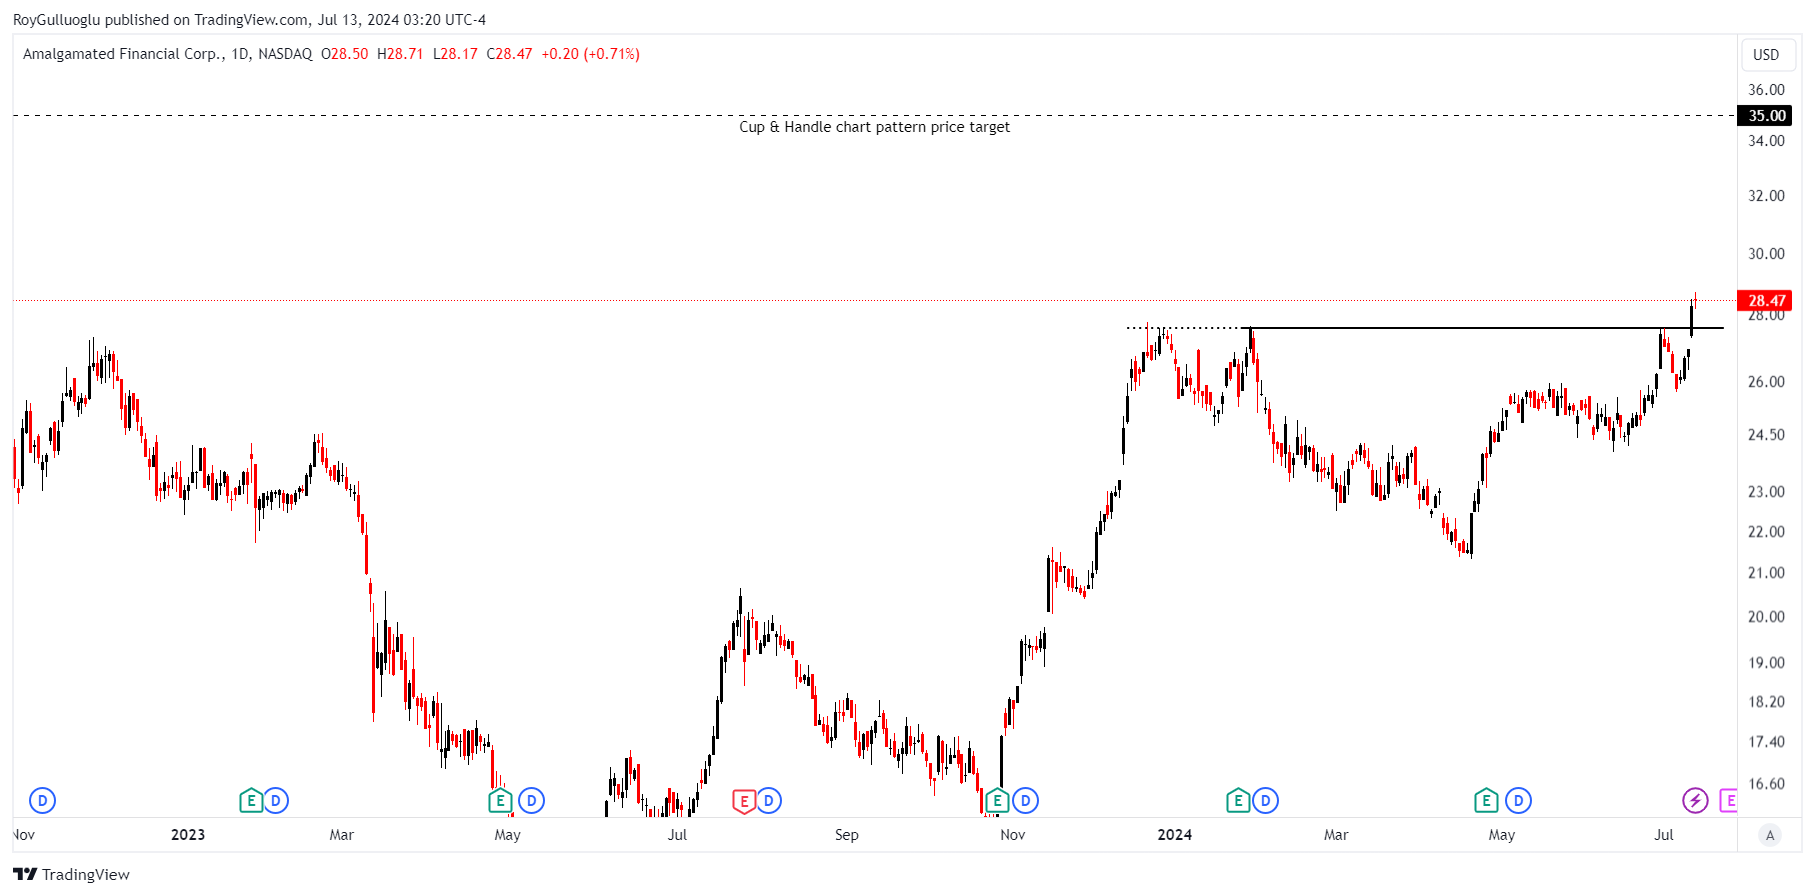
Amalgamated Financial Corp. is the bank holding company for Amalgamated Bank, which provides commercial and retail banking, investment management, and trust and custody services to customers in the United States.
The above daily chart formed an approximately 4-month-long cup & handle chart pattern as a bullish continuation after an uptrend.
The horizontal boundary at 27.6 levels acts as a resistance within this pattern.
A daily close above 28.42 levels would validate the breakdown from the 4-month-long cup & handle chart pattern.
Based on this chart pattern, the potential price target is 35 levels.
AMAL, classified under the "financial services" sector, falls under the “Small Cap - Income” stock category.
Hancock Whitney Corporation-(HWC/NASDAQ)-Long Idea
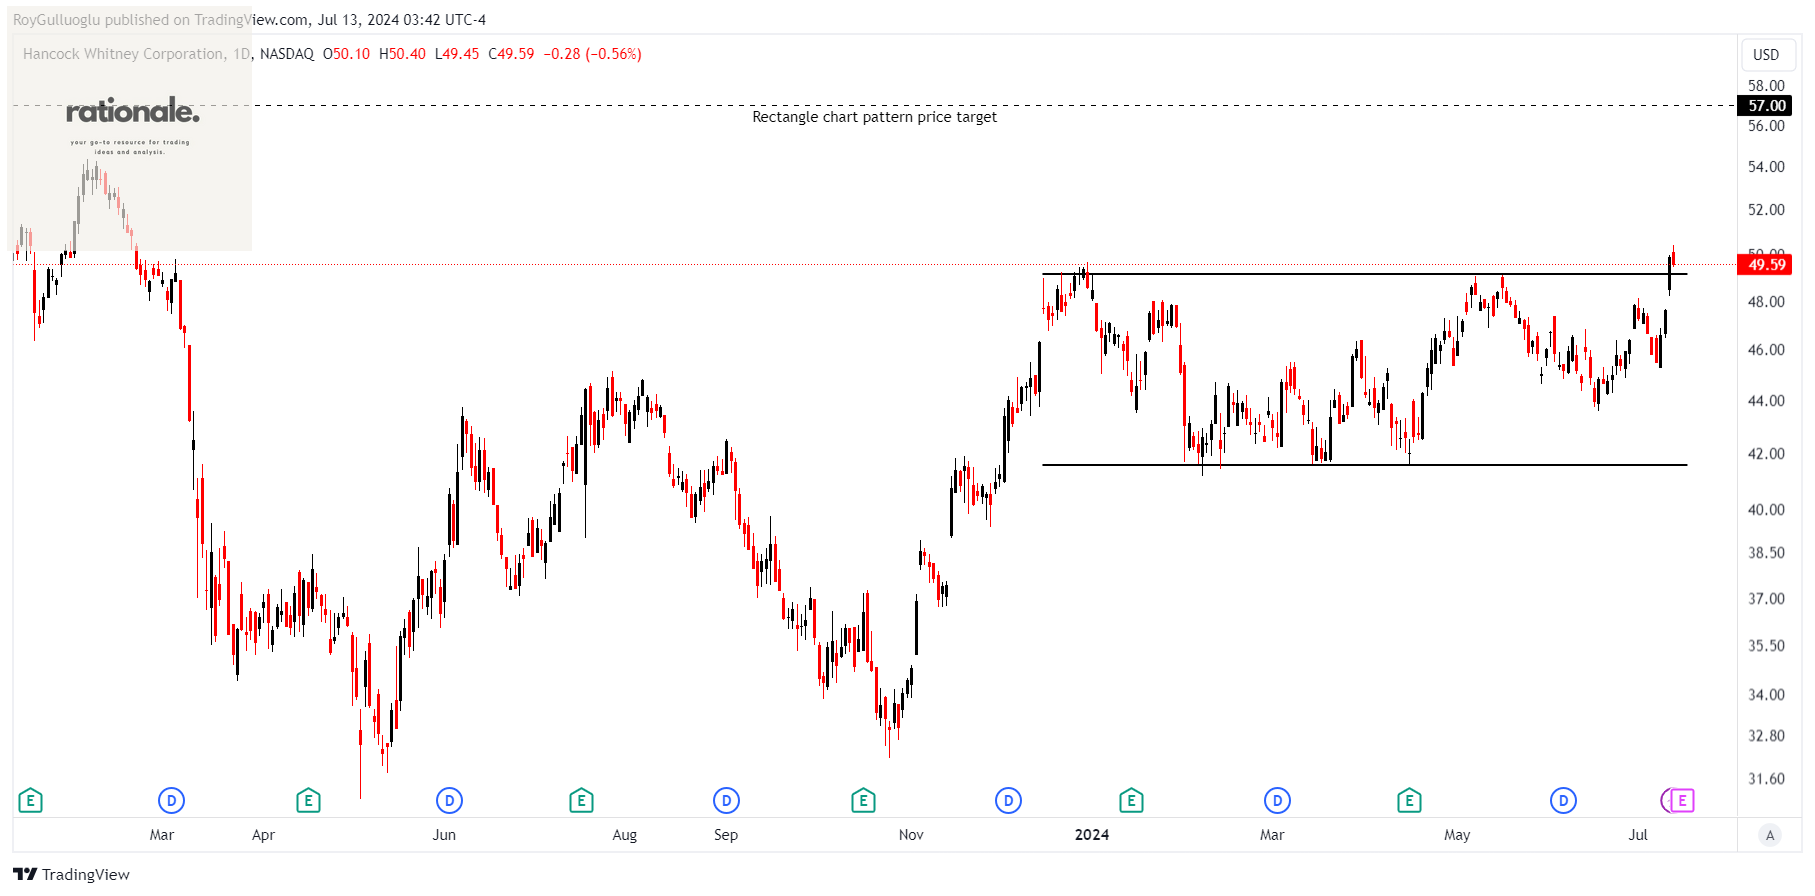
Hancock Whitney Corporation is the financial holding company for Hancock Whitney Bank, offering traditional and online banking services to commercial, small business, and retail customers.
The above daily chart formed an approximately 5-month-long rectangle chart pattern as a bullish continuation after an uptrend.
The horizontal boundary at 49.15 levels acts as a resistance within this pattern.
A daily close above 50.62 levels would validate the breakout from the 5-month-long rectangle chart pattern.
Based on this chart pattern, the potential price target is 57 levels.
HWC, classified under the "financial services" sector, falls under the “Mid Cap - Income” stock category.
Newmark Group, Inc.-(NMRK/NASDAQ)-Long Idea
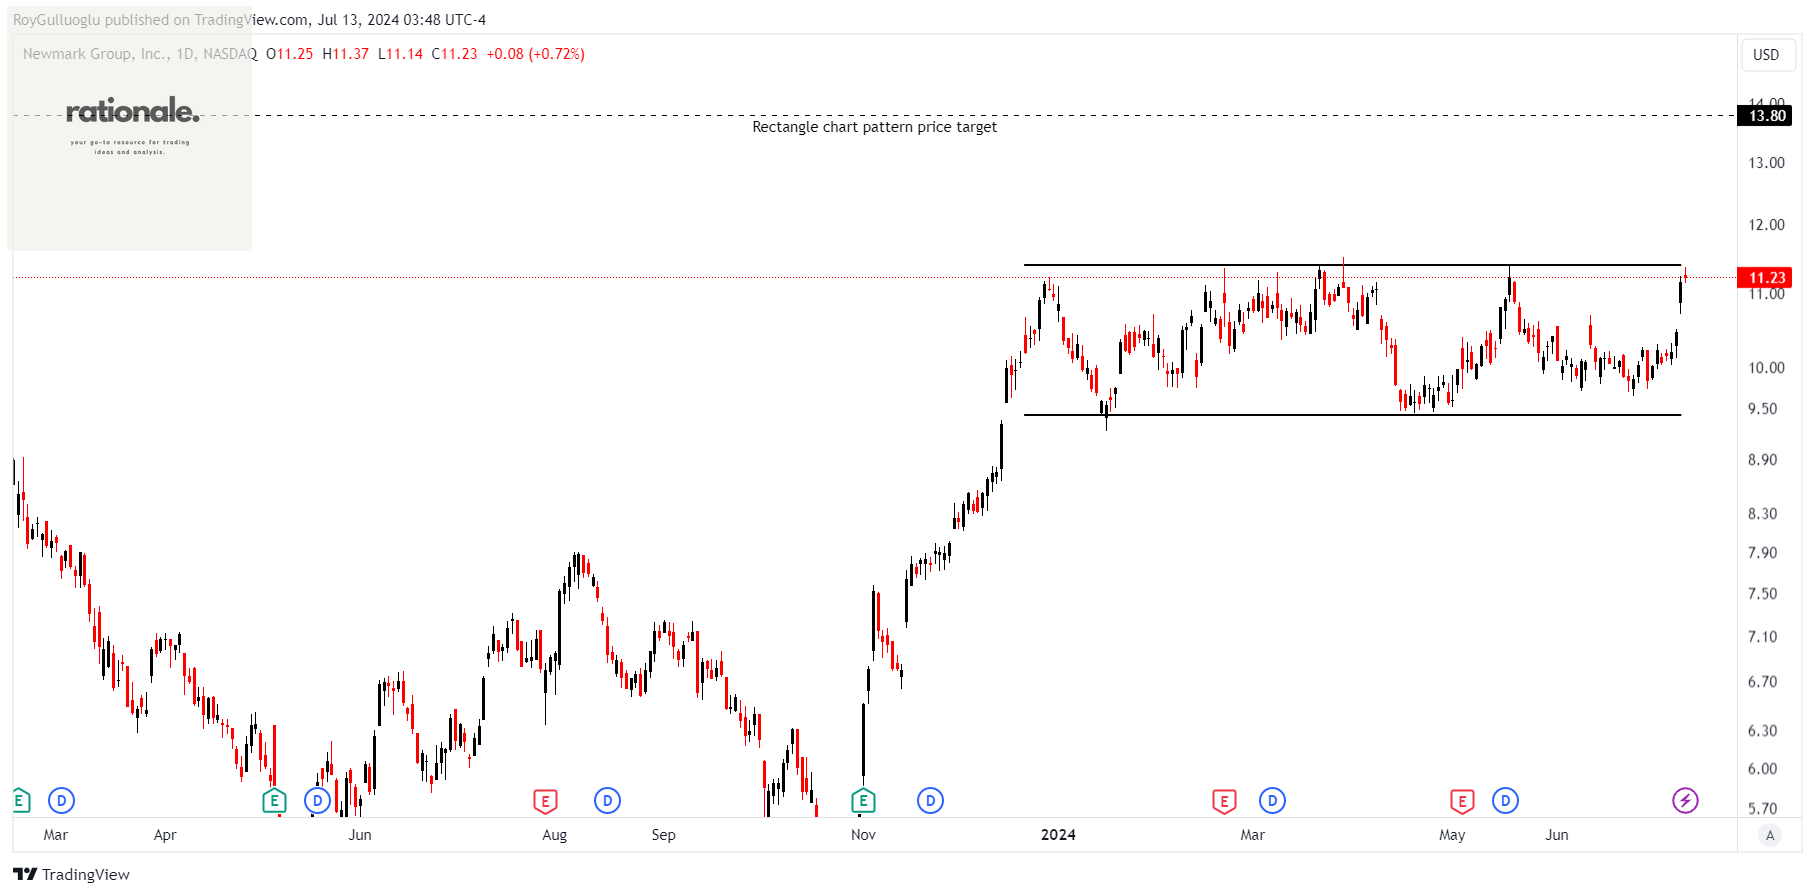
Newmark Group, Inc. offers commercial real estate services in the United States, the United Kingdom, and internationally.
The above daily chart formed an approximately 5-month-long rectangle chart pattern as a bullish continuation after an uptrend.
The horizontal boundary at 11.4 levels acts as a resistance within this pattern.
A daily close above 11.75 levels would validate the breakout from the 5-month-long rectangle chart pattern.
Based on this chart pattern, the potential price target is 13.80 levels.
NMRK, classified under the "real estate" sector, falls under the “Mid Cap - Income” stock category.
Southern States Bancshares, Inc.-(SSBK/NASDAQ)-Long Idea
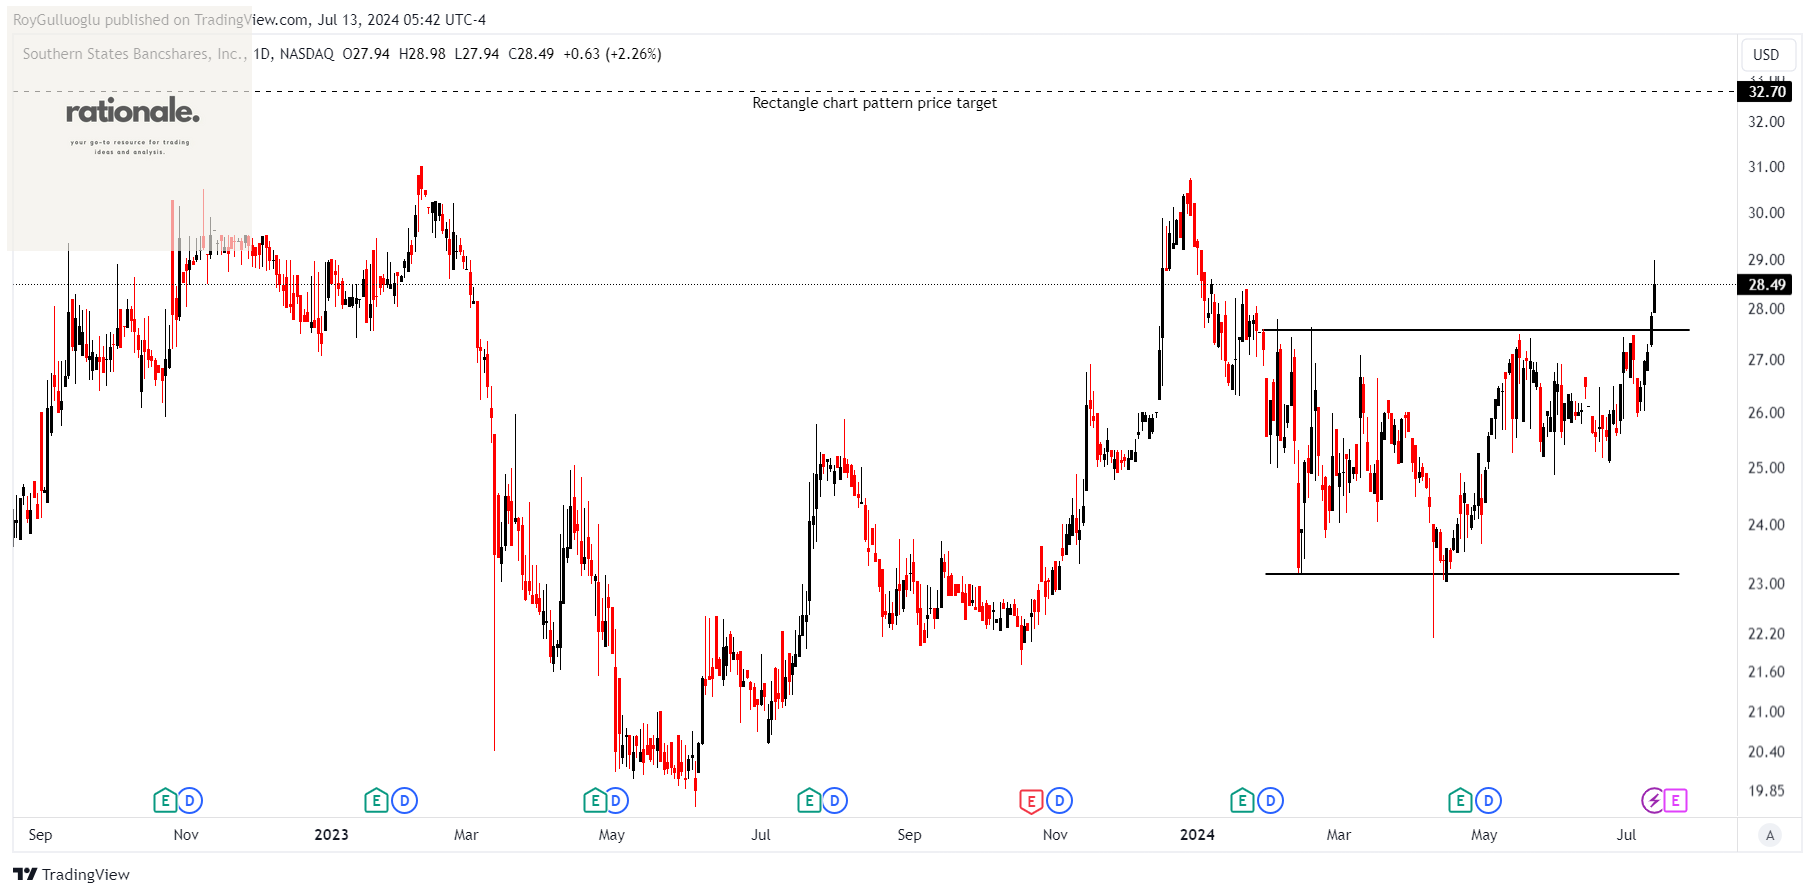
Southern States Bancshares, Inc. is the bank holding company for Southern States Bank, offering community banking services to businesses and individuals.
The above daily chart formed an approximately 3-month-long rectangle chart pattern as a bullish reversal after a downtrend.
The horizontal boundary at 27.58 levels acted as a resistance within this pattern.
A daily close above 28.41 levels validated the breakout from the 3-month-long rectangle chart pattern.
Based on this chart pattern, the potential price target is 32.7 levels.
SSBK, classified under the "financial services" sector, falls under the “Small Cap - Income” stock category.
Thank you Roy