


New setups
TICKERS: AHCO(NASDAQ), KDP(NASDAQ), ORA(NYSE), APP(NASDAQ), CWEN(NYSE)
AdaptHealth Corp.-(AHCO/NASDAQ)-Long Idea
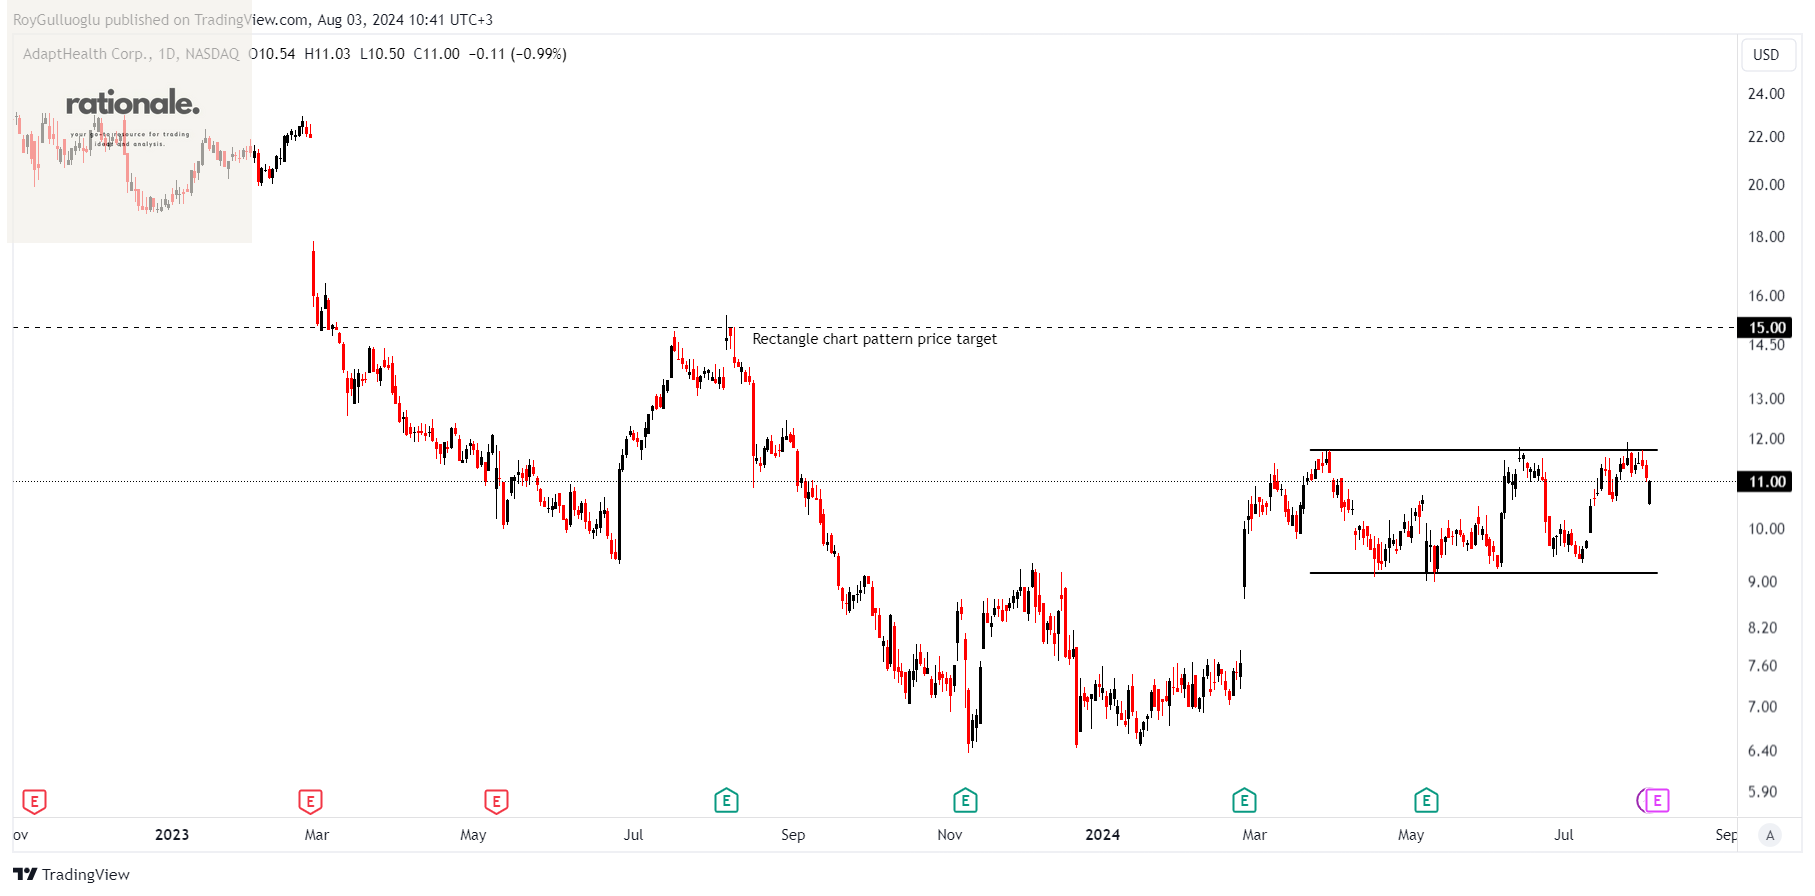
AdaptHealth Corp., along with its subsidiaries, provides home medical equipment (HME), medical supplies, and home-related services in the United States.
The above daily chart formed an approximately 3-month-long rectangle chart pattern as a bullish continuation after an uptrend.
The horizontal boundary at 11.73 levels acts as a resistance within this pattern.
A daily close above 12.08 levels would validate the breakout from the 3-month-long rectangle chart pattern.
Based on this chart pattern, the potential price target is 15 levels.
AHCO, classified under the "healthcare" sector, falls under the “Small Cap - Value” stock category.
Keurig Dr Pepper Inc.-(KDP/NASDAQ)-Long Idea
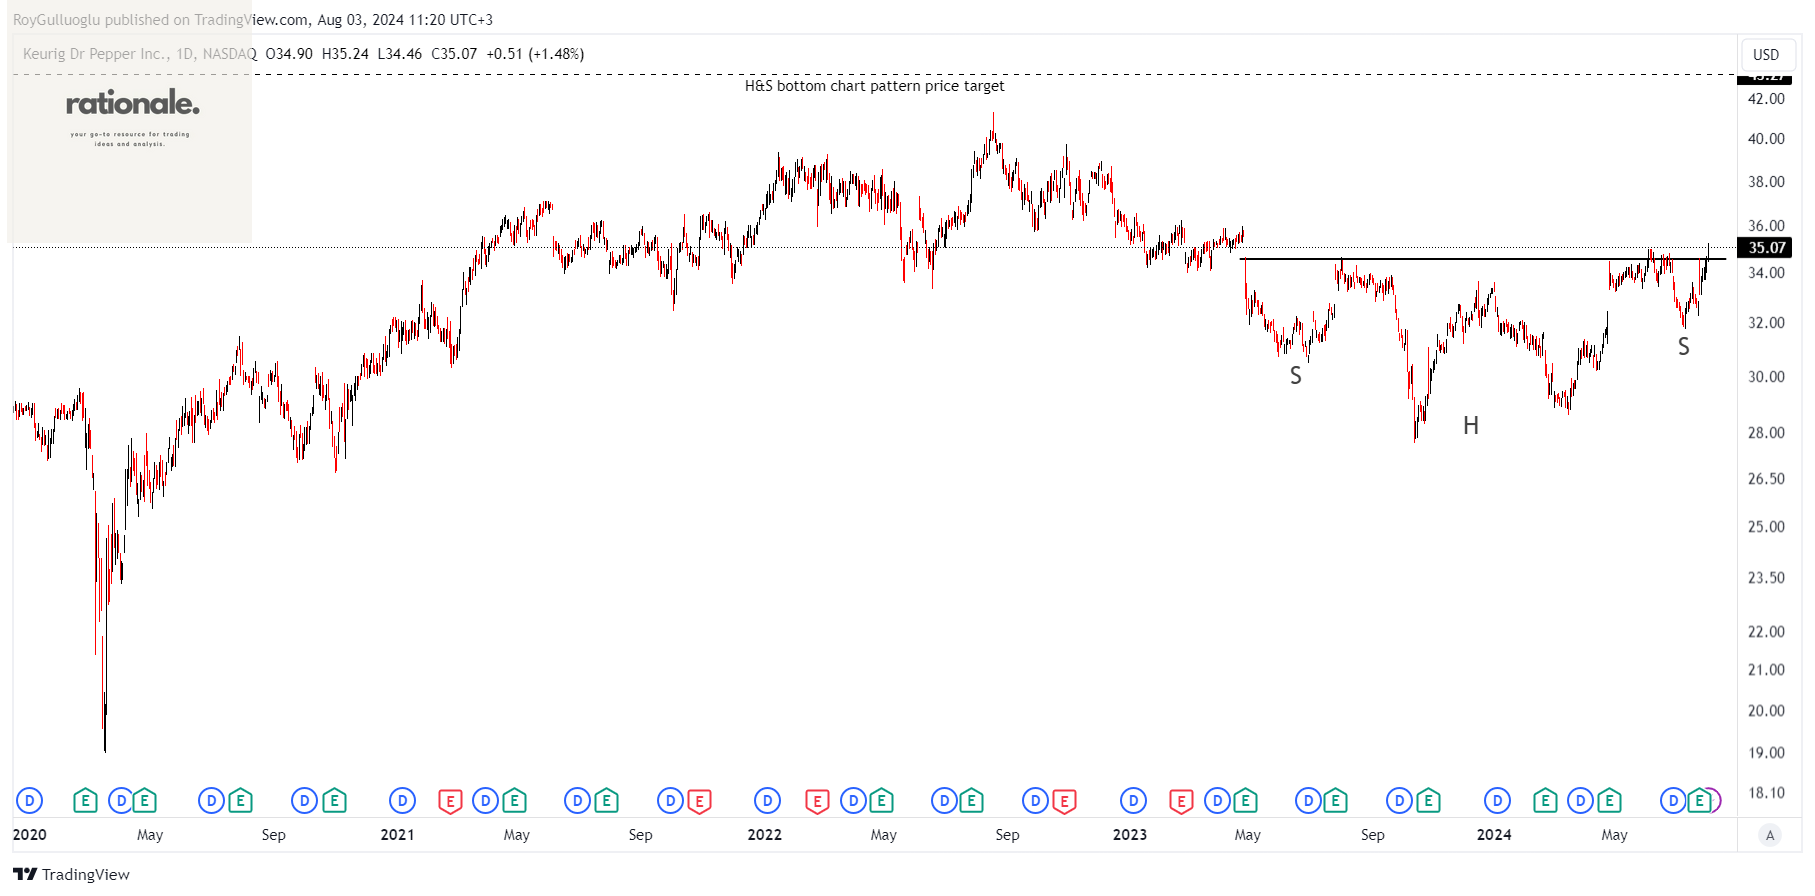
Keurig Dr Pepper Inc. owns, manufactures, and distributes beverages and single-serve brewing systems both in the United States and internationally. The company operates through three segments: U.S. Refreshment Beverages, U.S. Coffee, and International.
The above daily chart formed an approximately 11-month-long H&S bottom chart pattern as a bullish reversal after a downtrend.
The horizontal boundary at 34.57 levels acts as a resistance within this pattern.
A daily close above 35.6 levels would validate the breakout from the 11-month-long H&S bottom chart pattern.
Based on this chart pattern, the potential price target is 43.27 levels.
KDP, classified under the "consumer defensive" sector, falls under the “Small Cap - Value” stock category.
Ormat Technologies, Inc.-(ORA/NYSE)-Long Idea
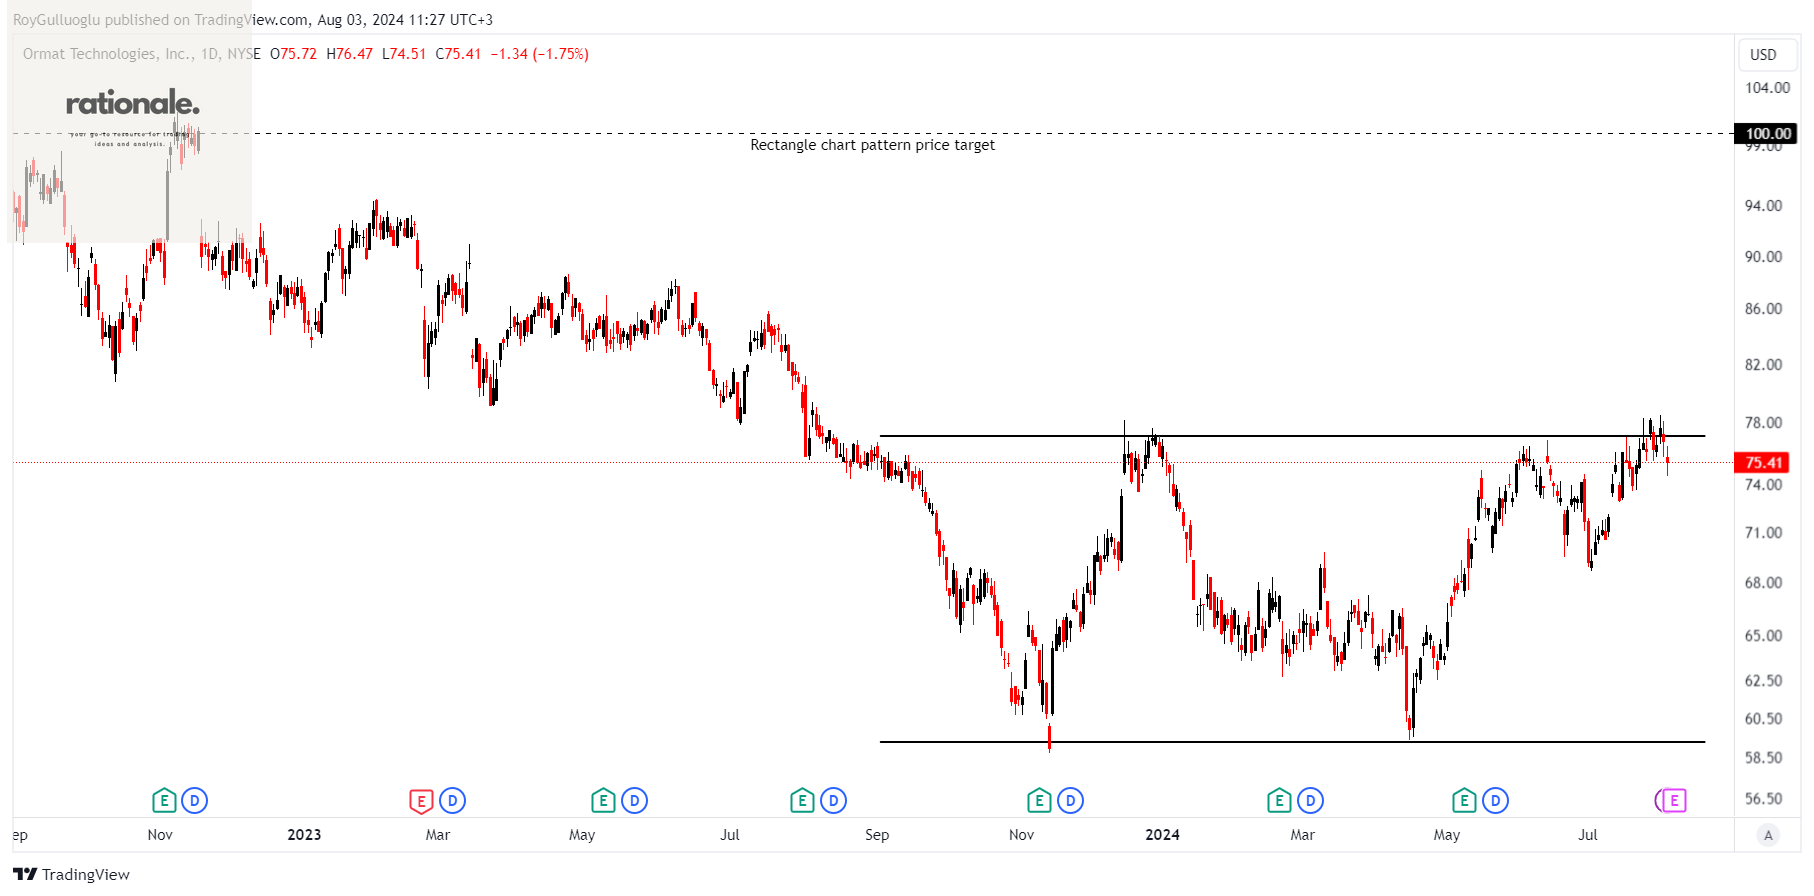
Ormat Technologies, Inc. is involved in the geothermal and recovered energy power business across the United States, Indonesia, Kenya, Turkey, Chile, Guatemala, Guadeloupe, New Zealand, Honduras, and other international markets.
The above daily chart formed an approximately 6-month-long rectangle chart pattern as a bullish reversal after a downtrend.
The horizontal boundary at 78 levels acts as a resistance within this pattern.
A daily close above 80.3 levels would validate the breakdown from the 6-month-long rectangle chart pattern.
Based on this chart pattern, the potential price target is 100 levels.
ORA, classified under the "utilities" sector, falls under the “Large Cap - Income” stock category.
AppLovin Corporation-(APP/NASDAQ)-Short Idea
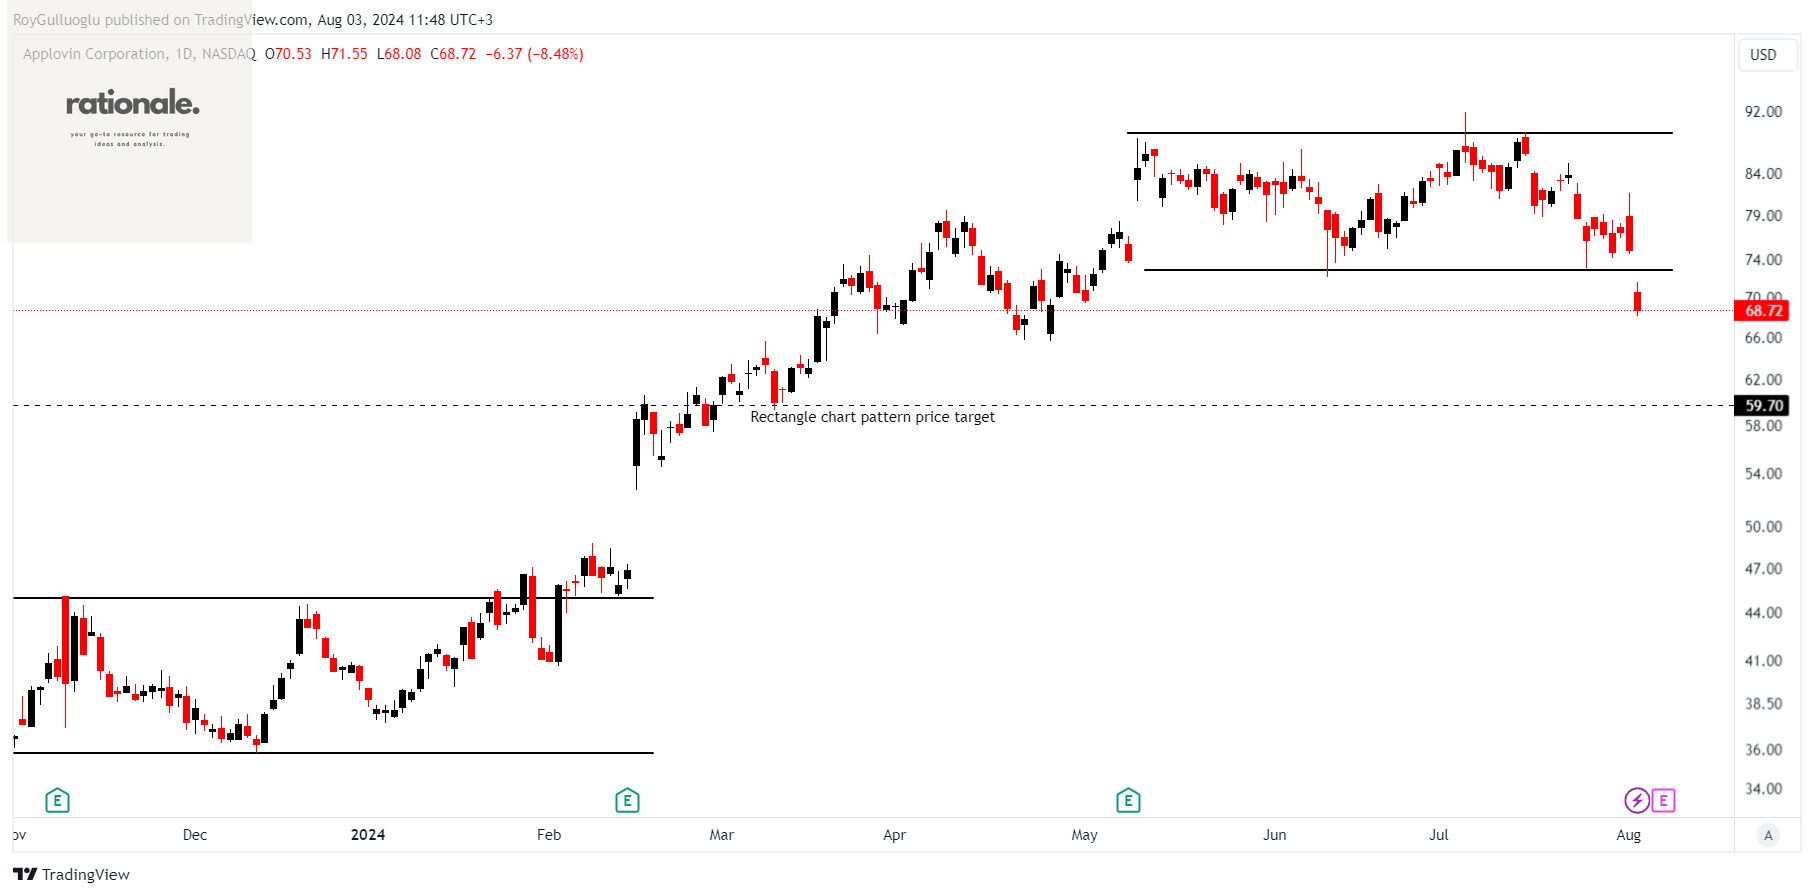
AppLovin Corporation develops a software-based platform that enables advertisers to enhance the marketing and monetization of their content both in the United States and internationally.
The above daily chart formed an approximately 2-month-long rectangle chart pattern as a bullish reversal after an uptrend.
The horizontal boundary at 72.88 levels acts as a support within this pattern.
A daily close below 70.69 levels validated the breakdown from the 2-month-long rectangle chart pattern.
Based on this chart pattern, the potential price target is 59.7 levels.
APP, classified under the "technology" sector, falls under the “Large Cap - Growth” stock category.
Clearway Energy, Inc.-(CWEN.A/NYSE)-Long Idea
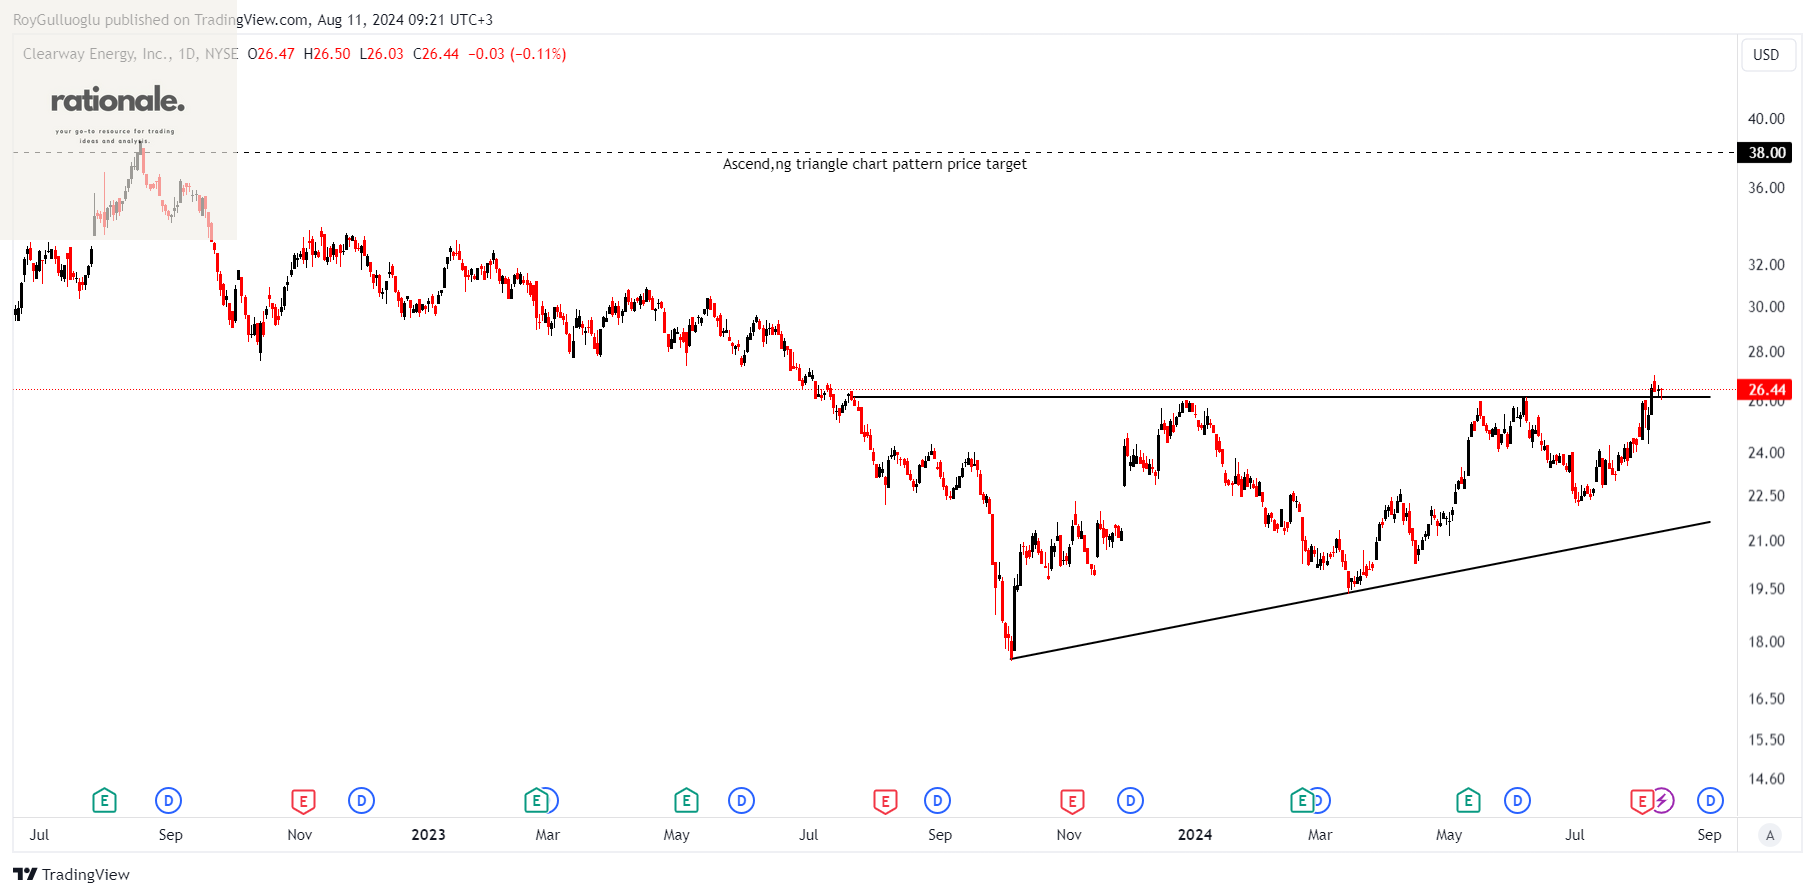
Clearway Energy, Inc. operates in the renewable energy sector in the United States, with its activities divided into two segments: Conventional and Renewables.
The above daily chart formed an approximately 9-month-long ascending triangle chart pattern as a bullish reversal after a downtrend.
The horizontal boundary at 26.13 levels acts as a resistance within this pattern.
A daily close above 26.92 levels would validate the breakdown from the 9-month-long ascending triangle chart pattern.
Based on this chart pattern, the potential price target is 38 levels.
CWEN.A, classified under the "utilities" sector, falls under the “Mid Cap - Income” stock category.