


Advanced Micro Devices, Inc. -(AMD/NASDAQ)-Short Idea
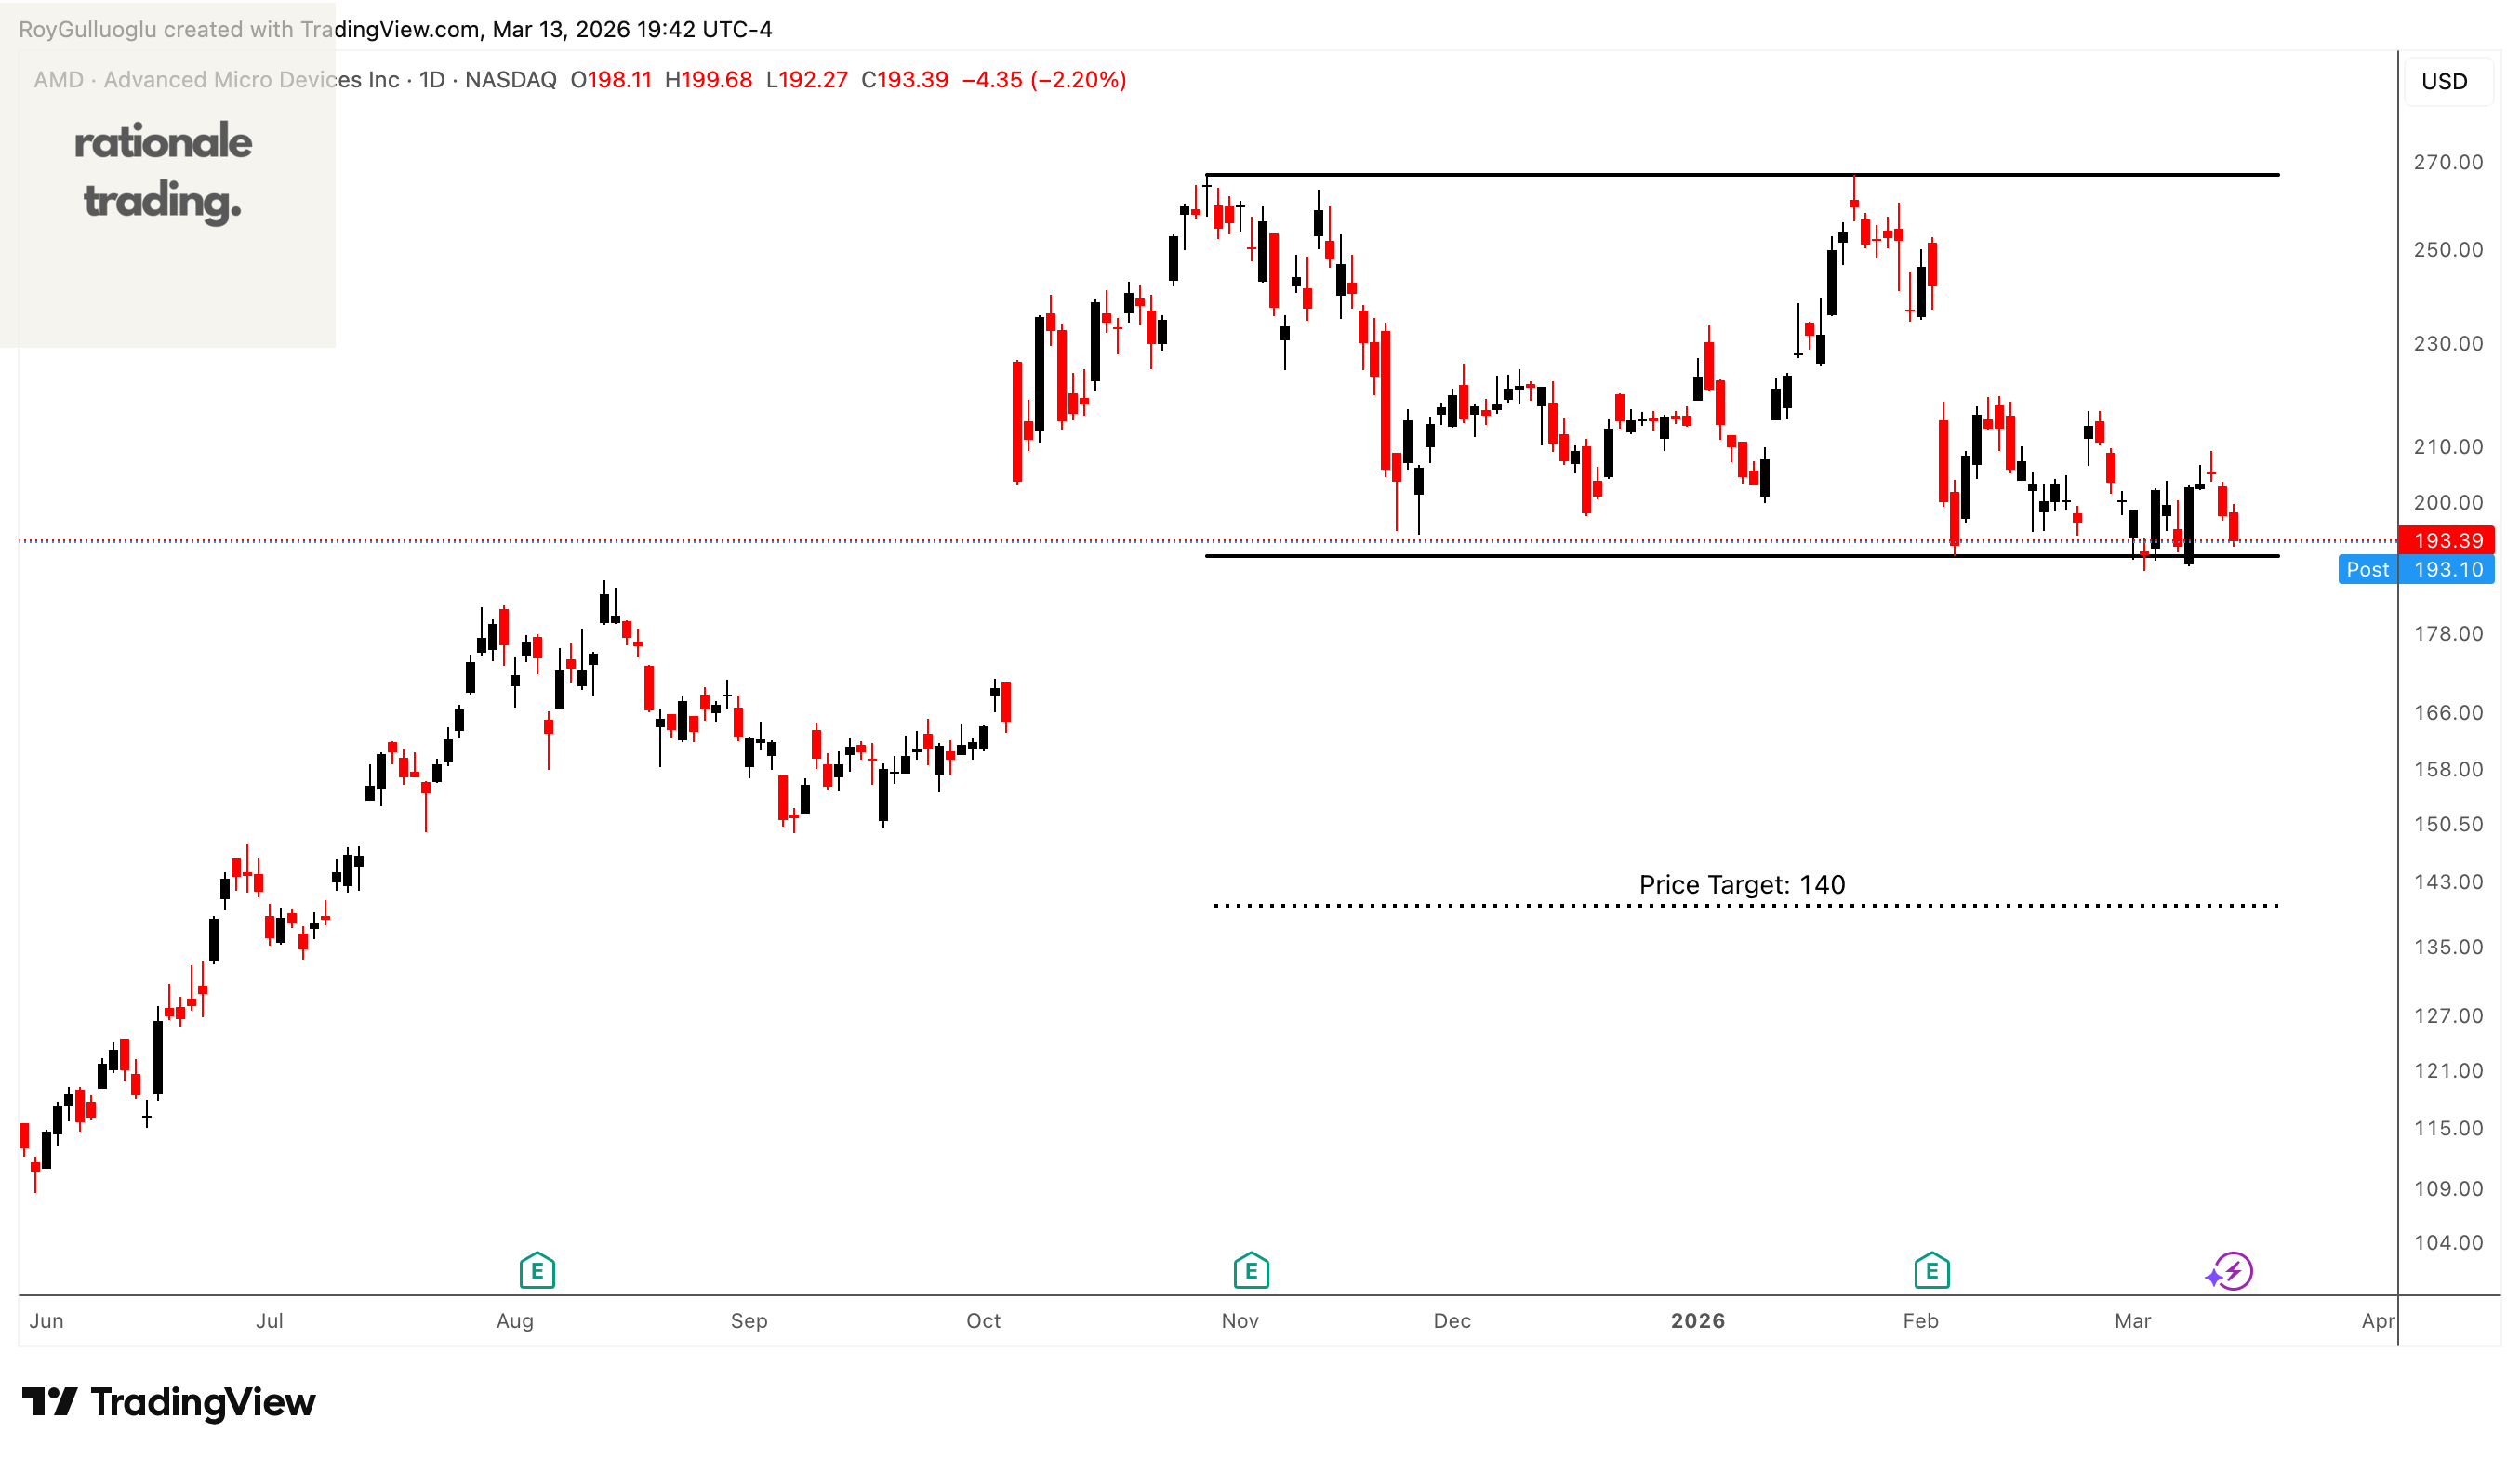
Advanced Micro Devices, Inc. operates as a semiconductor company internationally. It operates in three segments: Data Center, Client and Gaming, and Embedded.
The horizontal boundary at 190.72 levels acts as a support within this pattern.
A daily close below 185 levels would validate the breakout from the 3-month-long rectangle chart pattern.
Based on this chart pattern, the potential price target is 140 levels.
National Vision Holdings, Inc. -(EYE/NASDAQ)-Short Idea
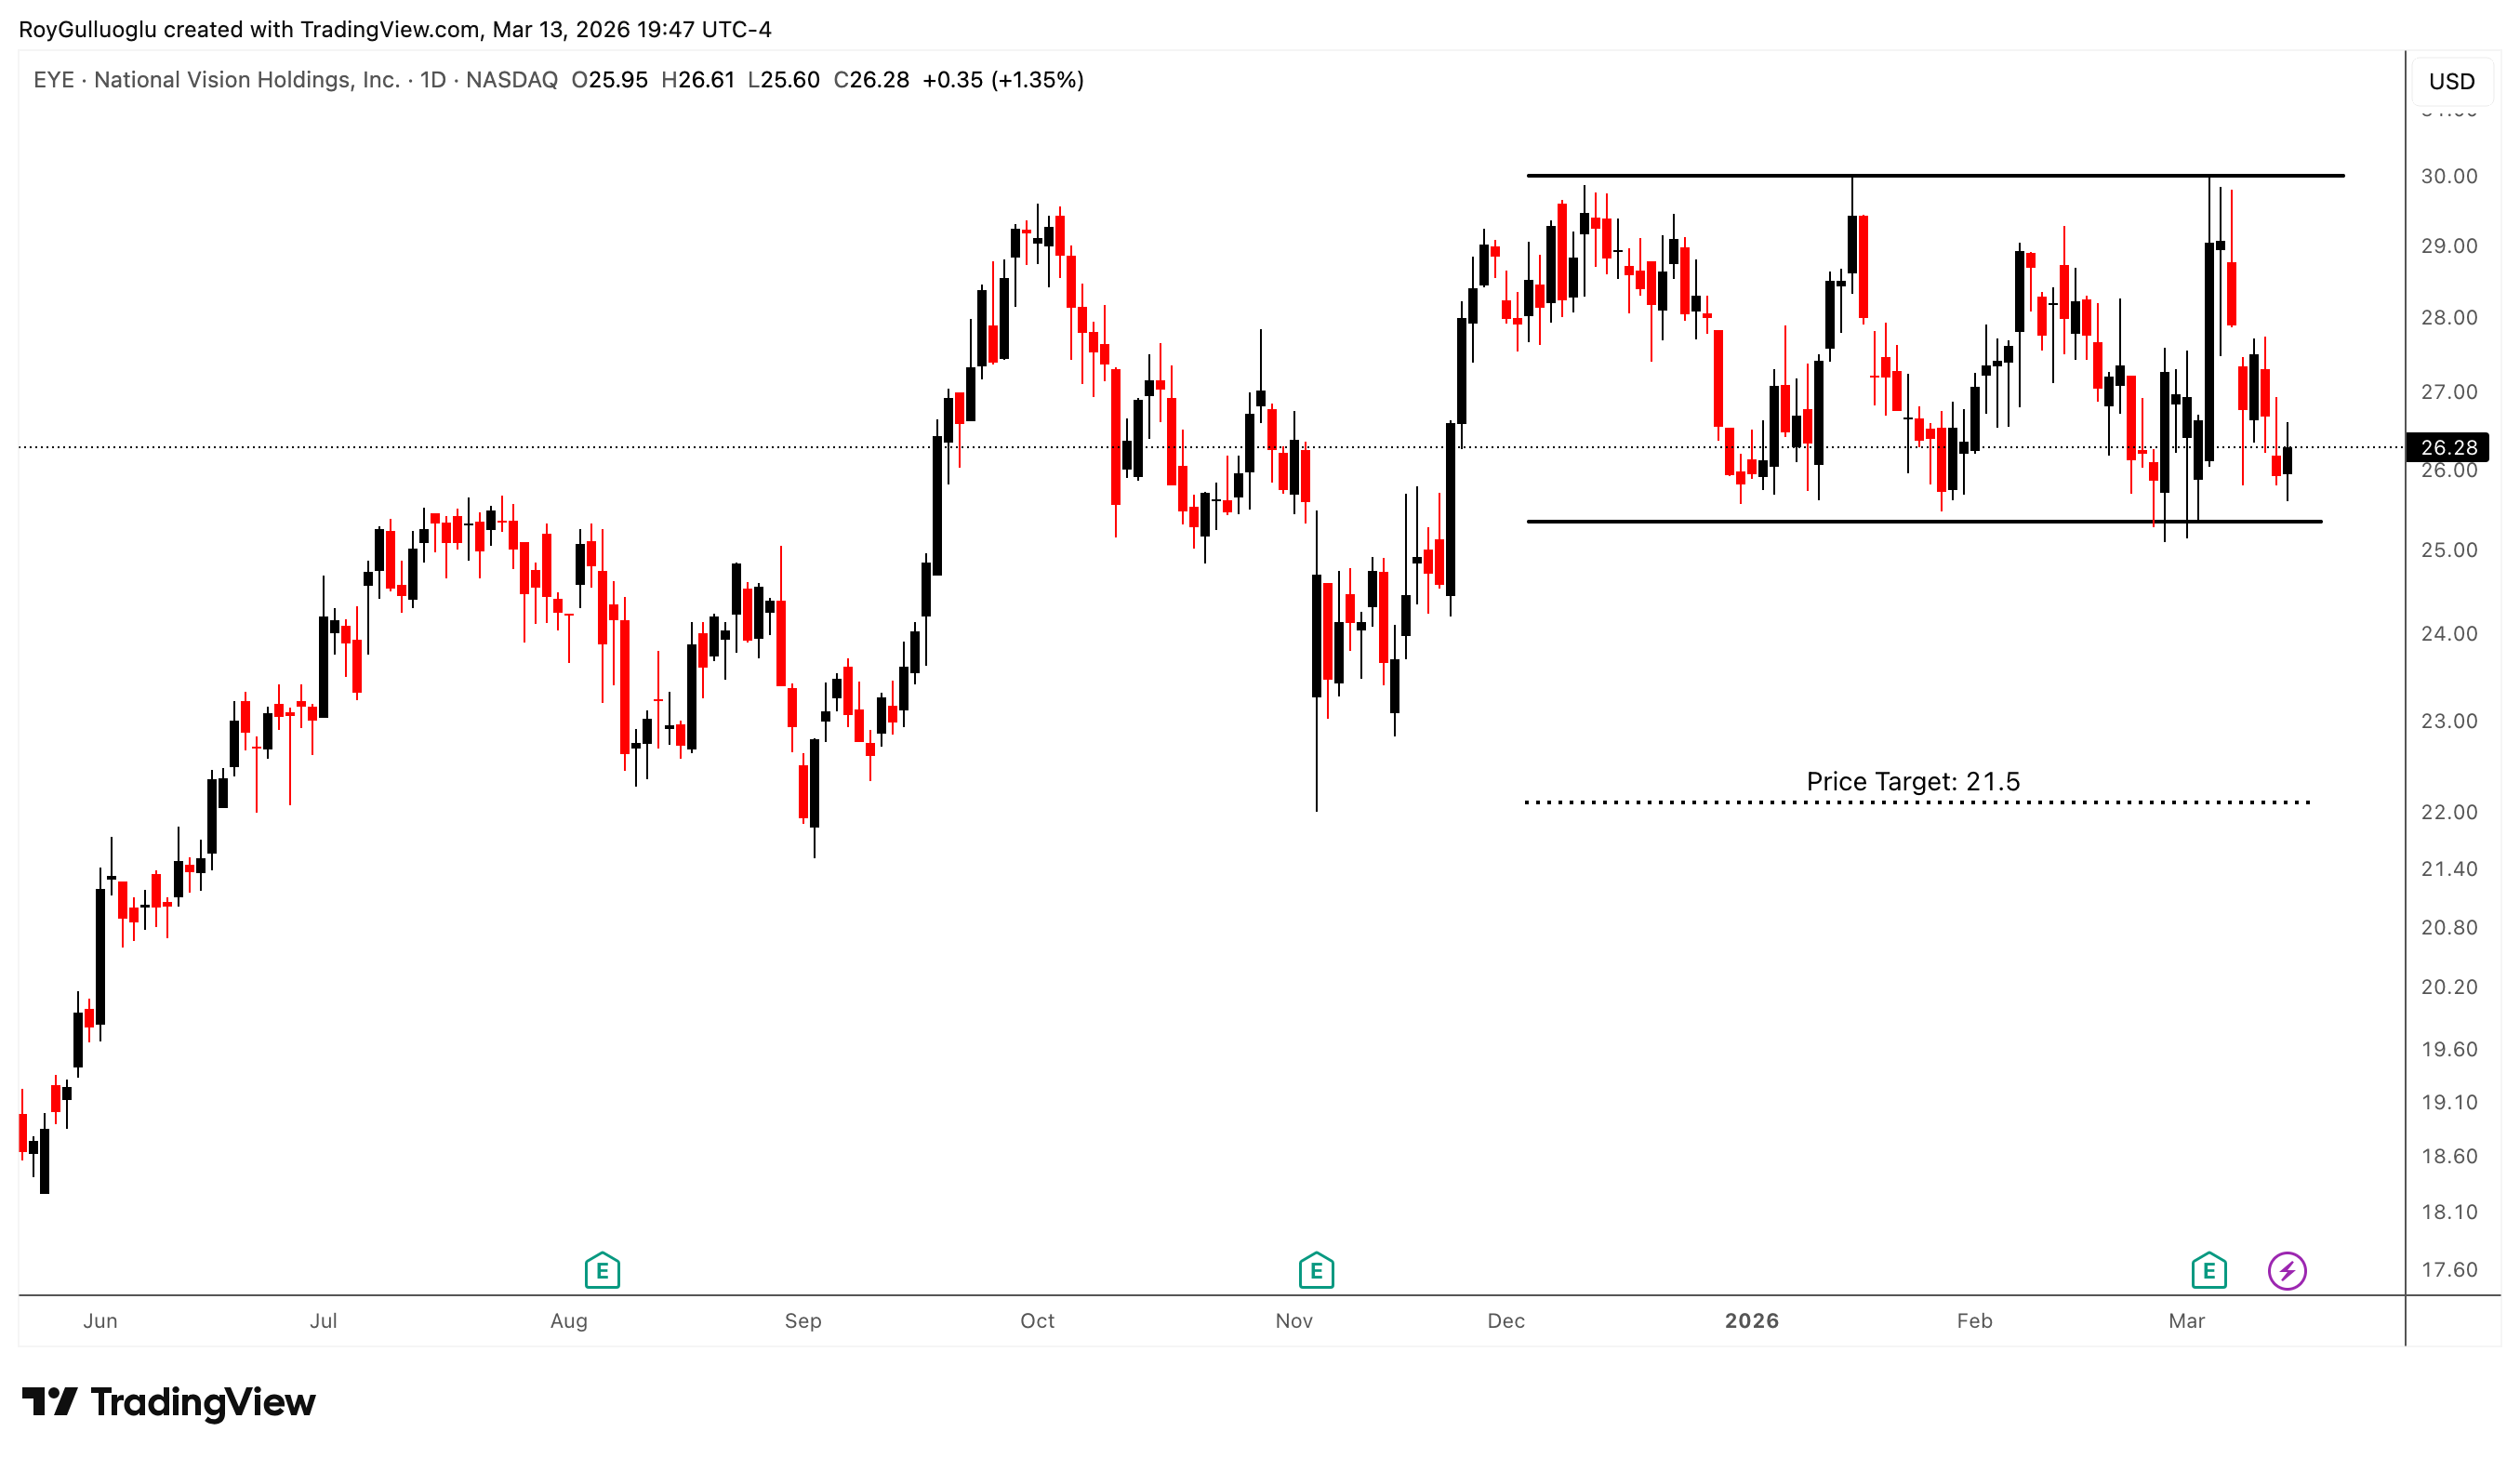
National Vision Holdings, Inc., through its subsidiaries, operates as an optical retailer in the United States.
The horizontal boundary at 25.35 levels acts as a support within this pattern.
A daily close below 24.6 levels would validate the breakout from the 2-month-long rectangle chart pattern.
Based on this chart pattern, the potential price target is 21.5 levels.
Tyson Foods, Inc.-(TSN/NYSE)-Long Idea
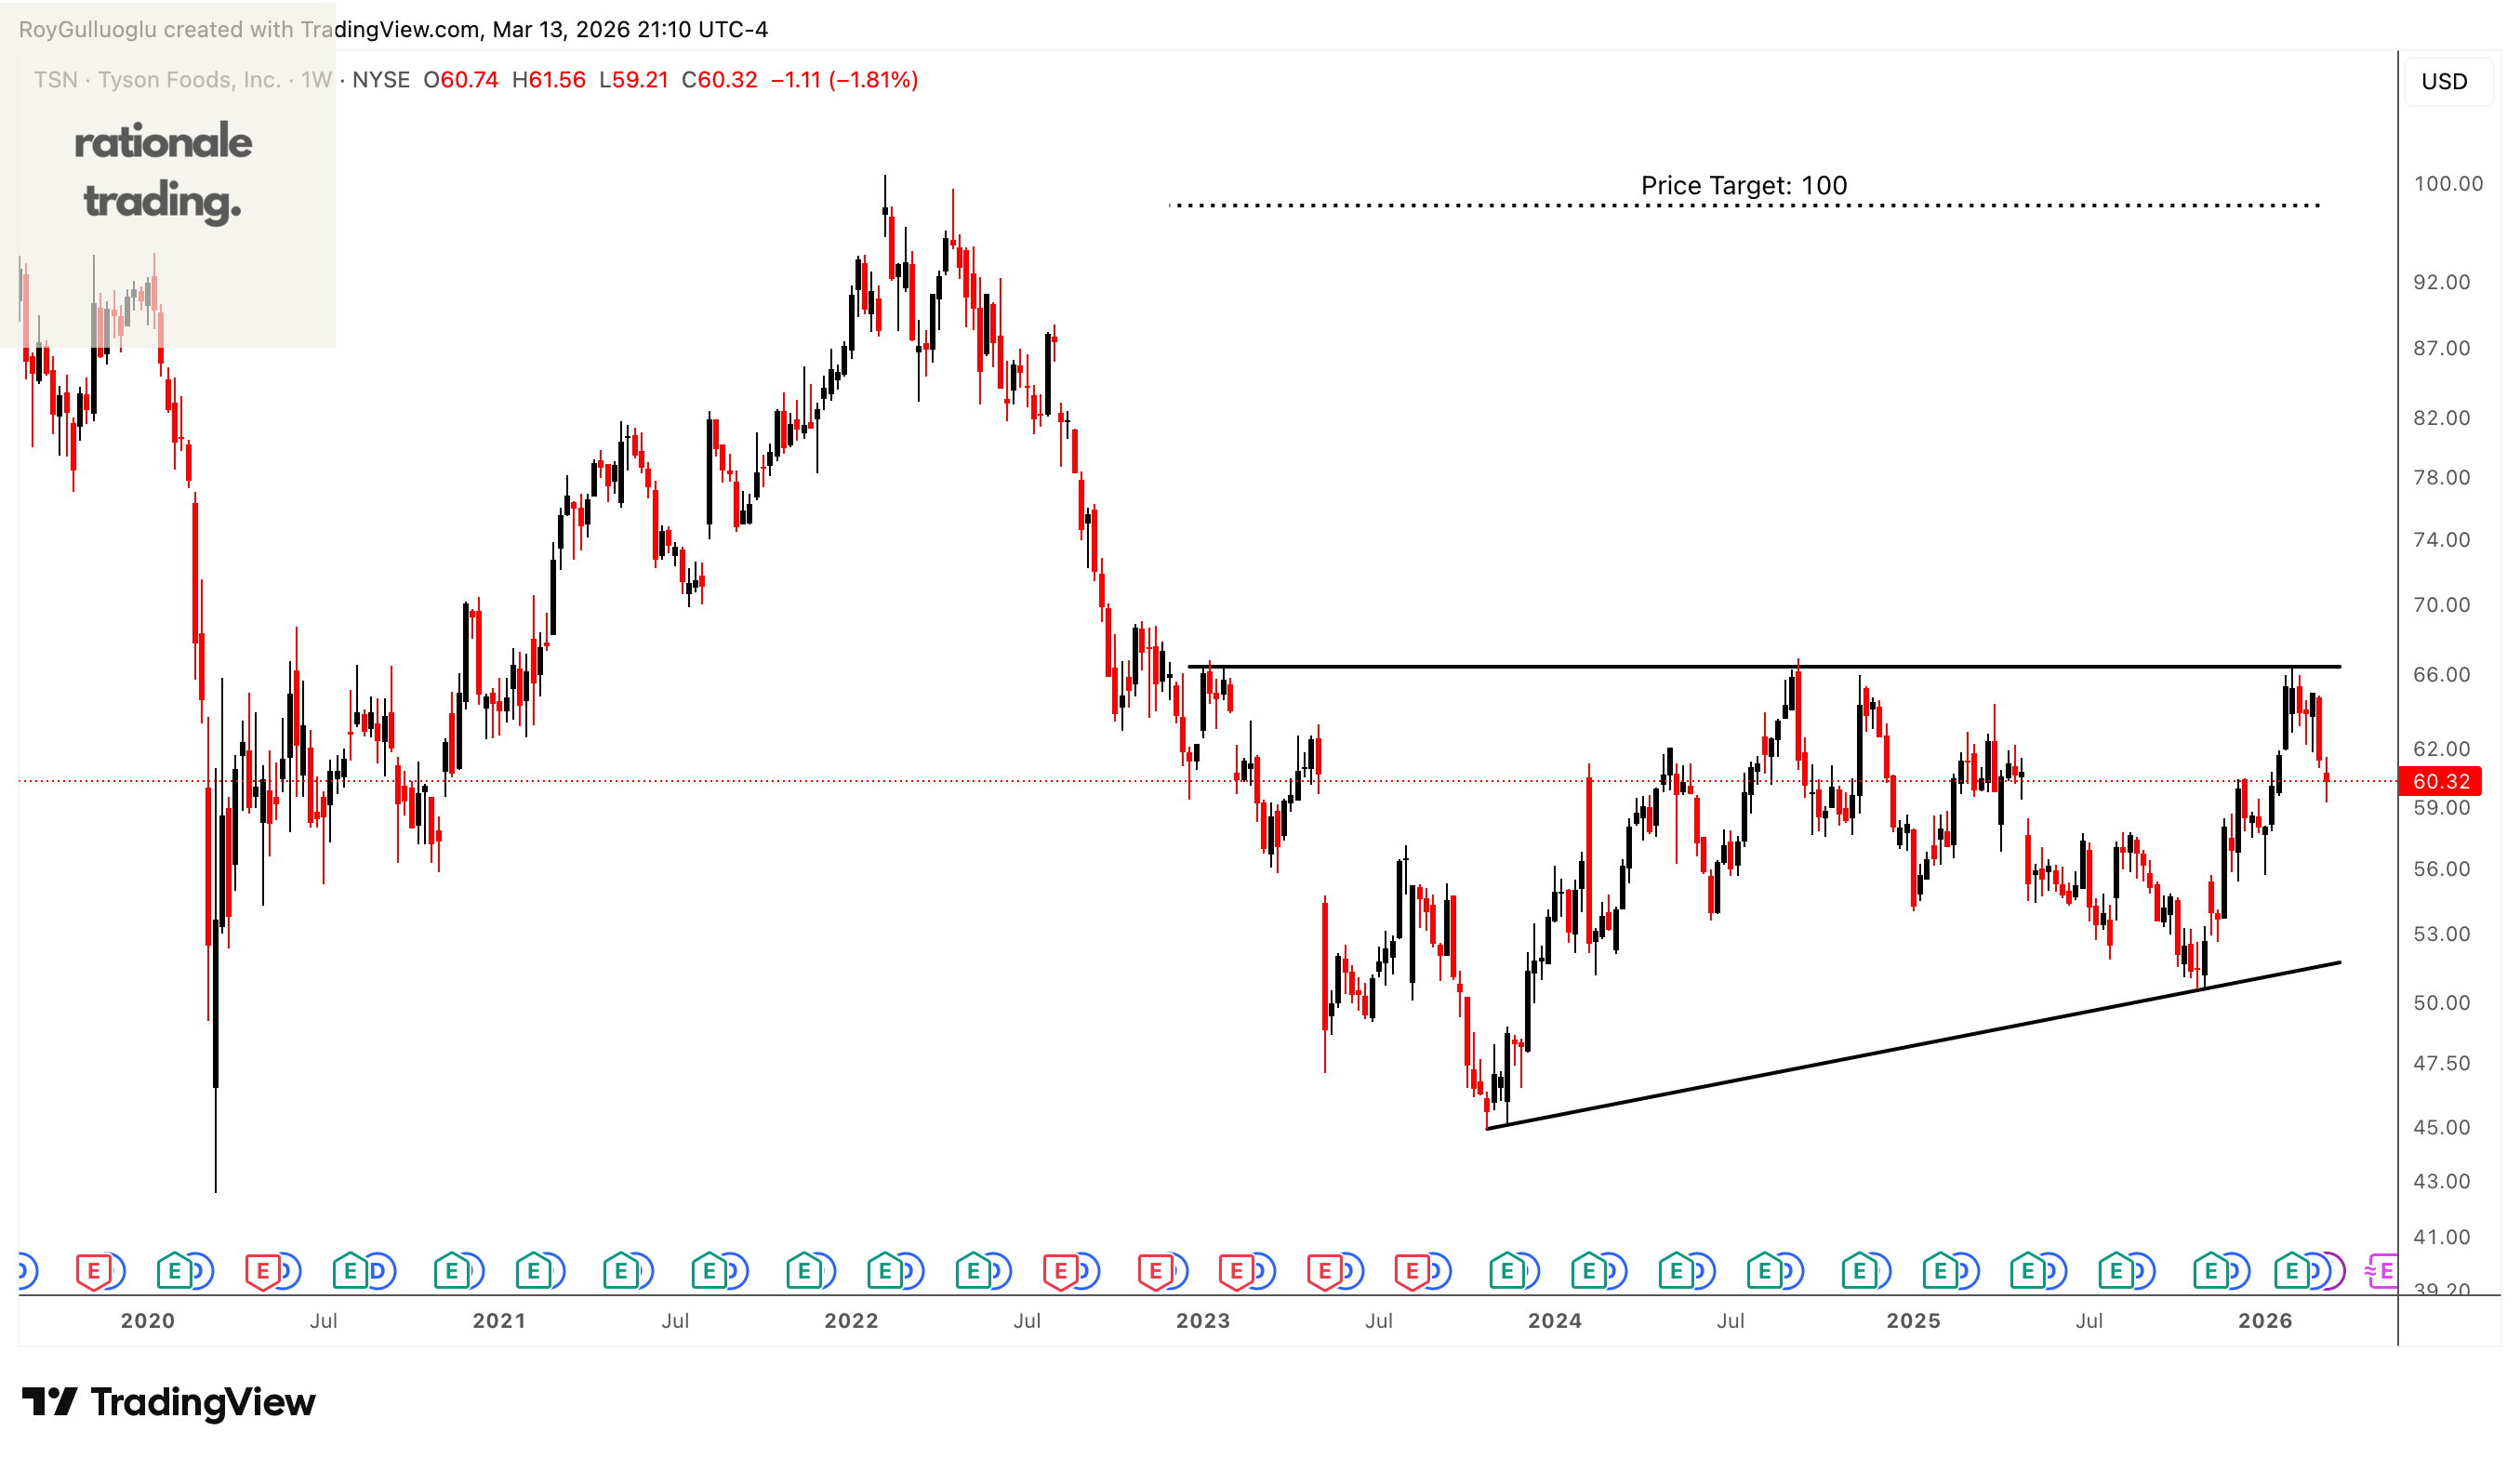
Tyson Foods, Inc., together with its subsidiaries, operates as a food company worldwide.
The above weekly chart formed an approximately 40-month-long ascending triangle chart pattern as a bullish reversal after a downtrend.
The horizontal boundary at 68.41 levels acts as a resistance within this pattern.
A daily close above 70.4 levels would validate the breakout from the 18-month-long ascending triangle chart pattern.
Based on this chart pattern, the potential price target is 100 levels.