


New setups
TICKERS: DOCU(NASDAQ), CGNX(NASDAQ), CMRE(NYSE), DUOL(NASDAQ), TSCO(LSE), IAG(LSE), LLOY(LSE), AKSEN(BIST)
DocuSign, Inc.-(DOCU/NASDAQ)-Long Idea
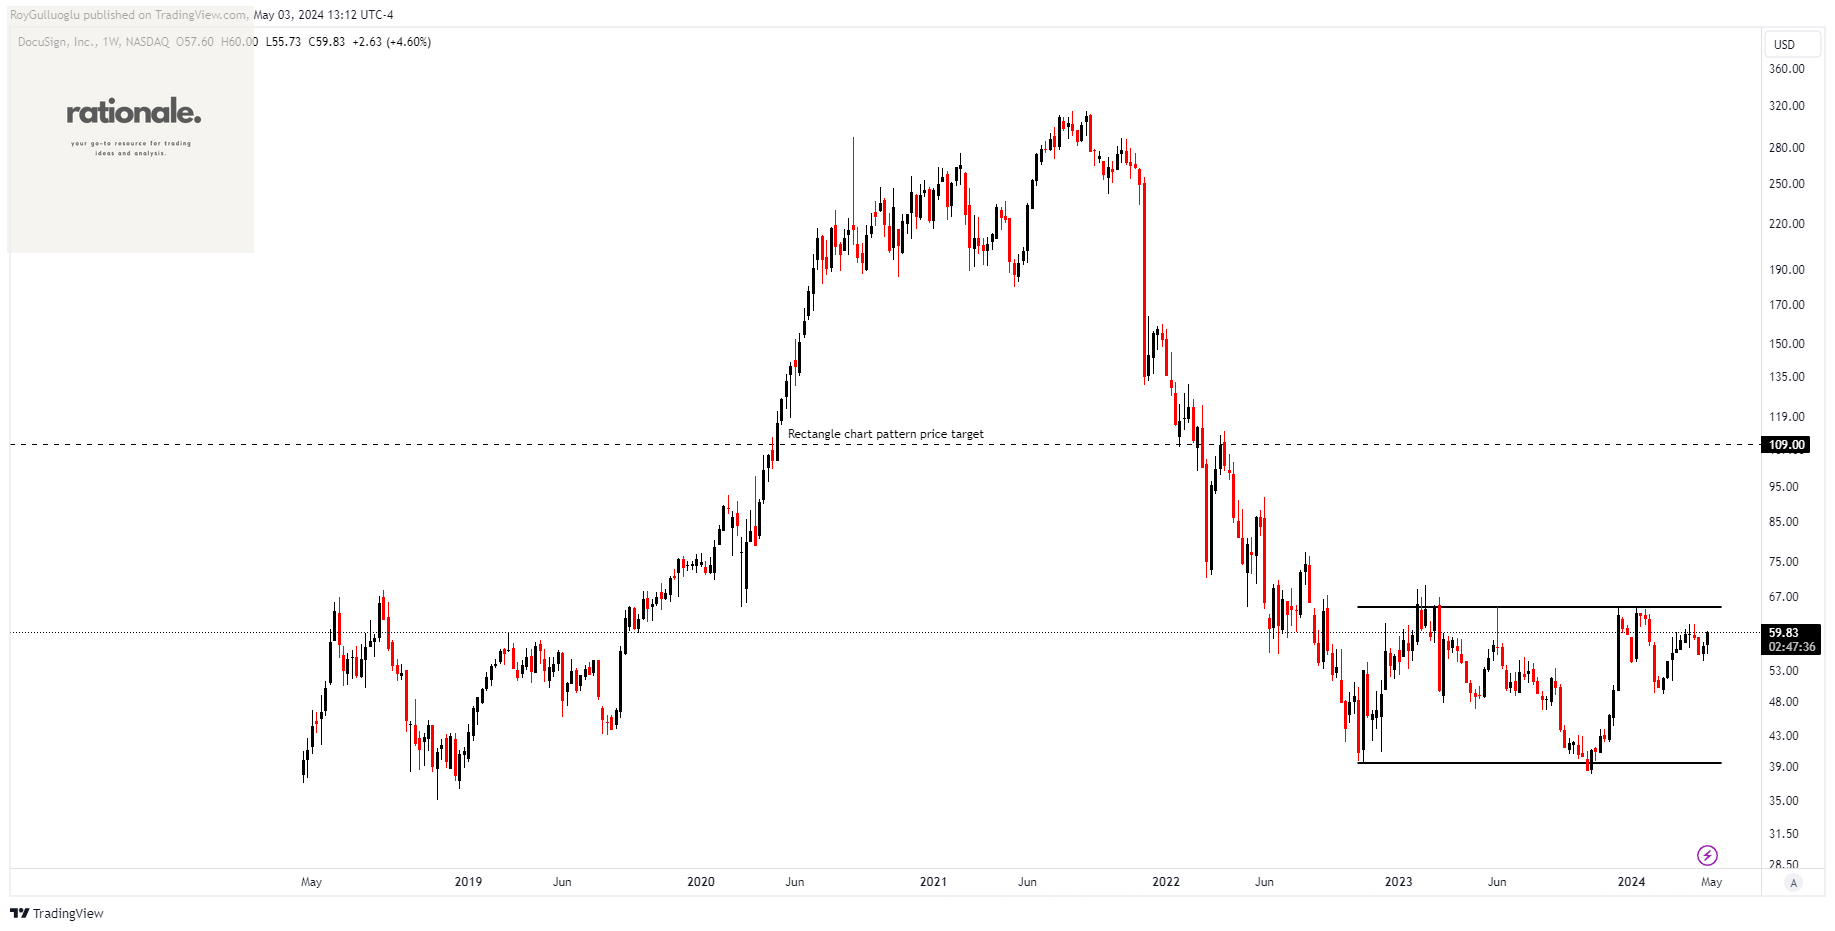
DocuSign, Inc. offers an electronic signature solution both domestically in the United States and on an international scale.
The above weekly chart formed an approximately 20-month-long rectangle chart pattern as a bullish reversal after a downtrend.
The horizontal boundary at 64.71 levels acts as a support within this pattern.
A daily close above 66.6 levels would validate the breakout from the 20-month-long rectangle chart pattern.
Based on this chart pattern, the potential price target is 109 levels.
Cognex Corporation-(CGNX/NASDAQ)-Long Idea
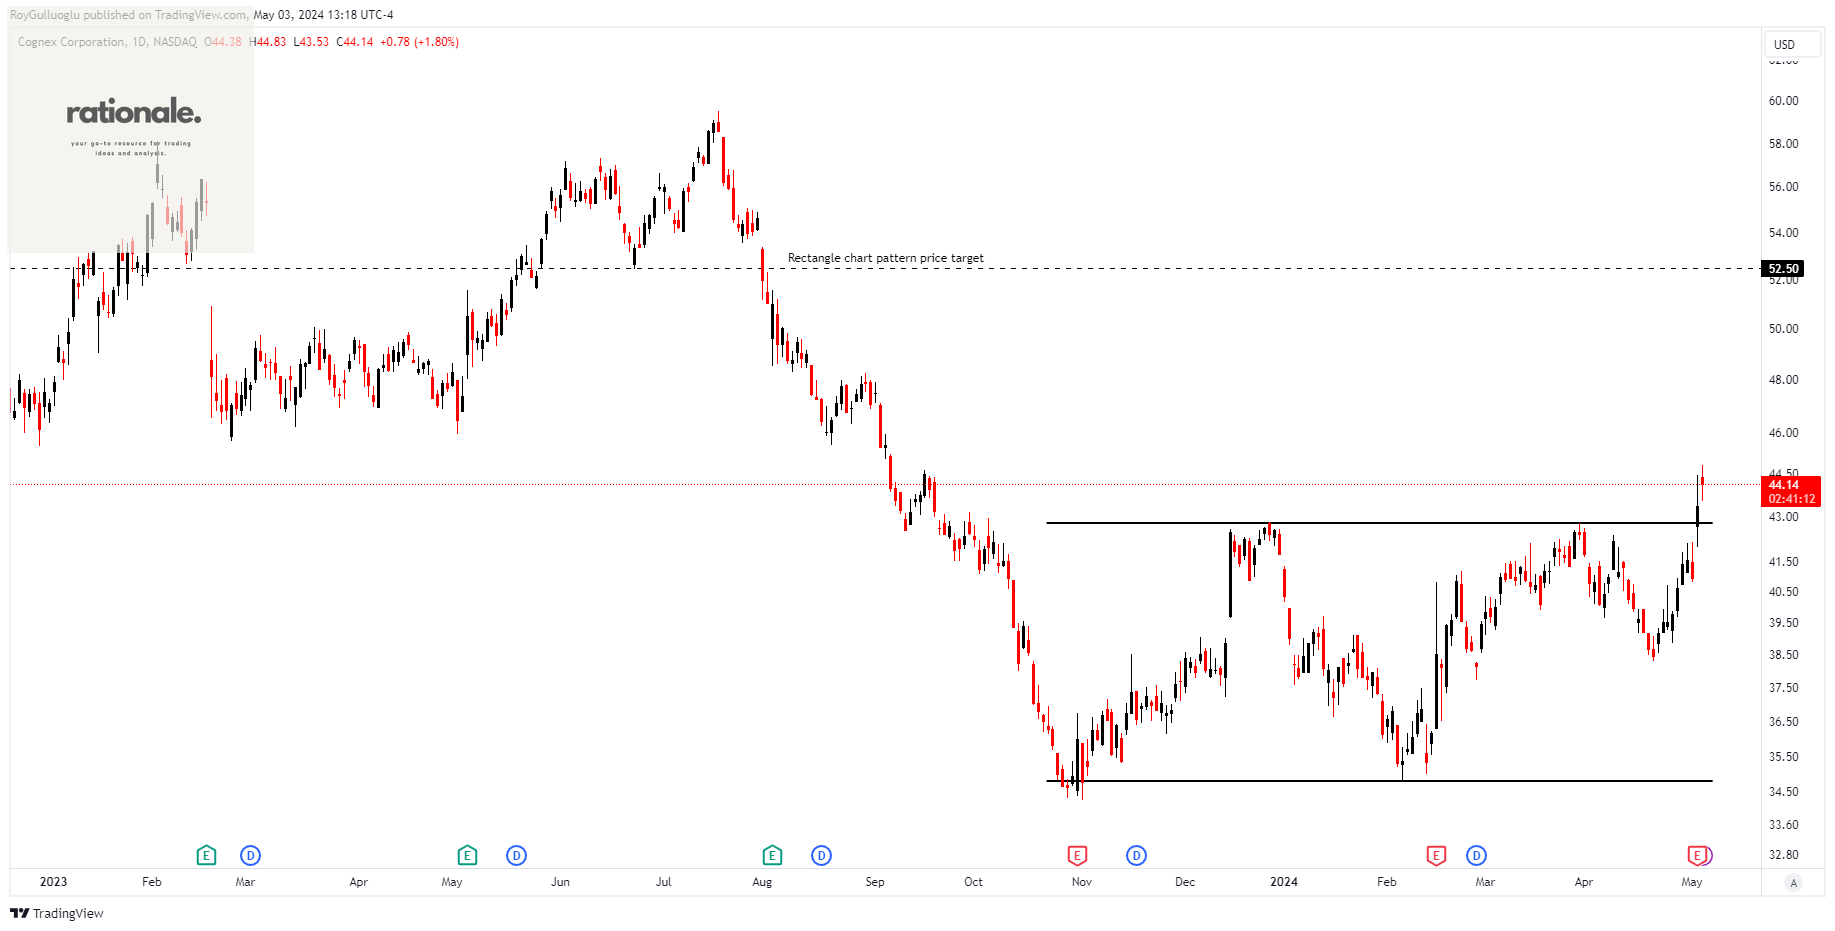
Cognex Corporation offers machine vision products globally, which capture and analyze visual data to automate manufacturing and distribution processes.
The above daily chart formed an approximately 4-month-long rectangle chart pattern as a bullish reversal after a downtrend.
The horizontal boundary at 42.8 levels acts as a support within this pattern.
A daily close above 44 levels would validate the breakout from the 4-month-long rectangle chart pattern.
Based on this chart pattern, the potential price target is 52.5 levels.
Costamare Inc.-(CMRE/NYSE)-Long Idea
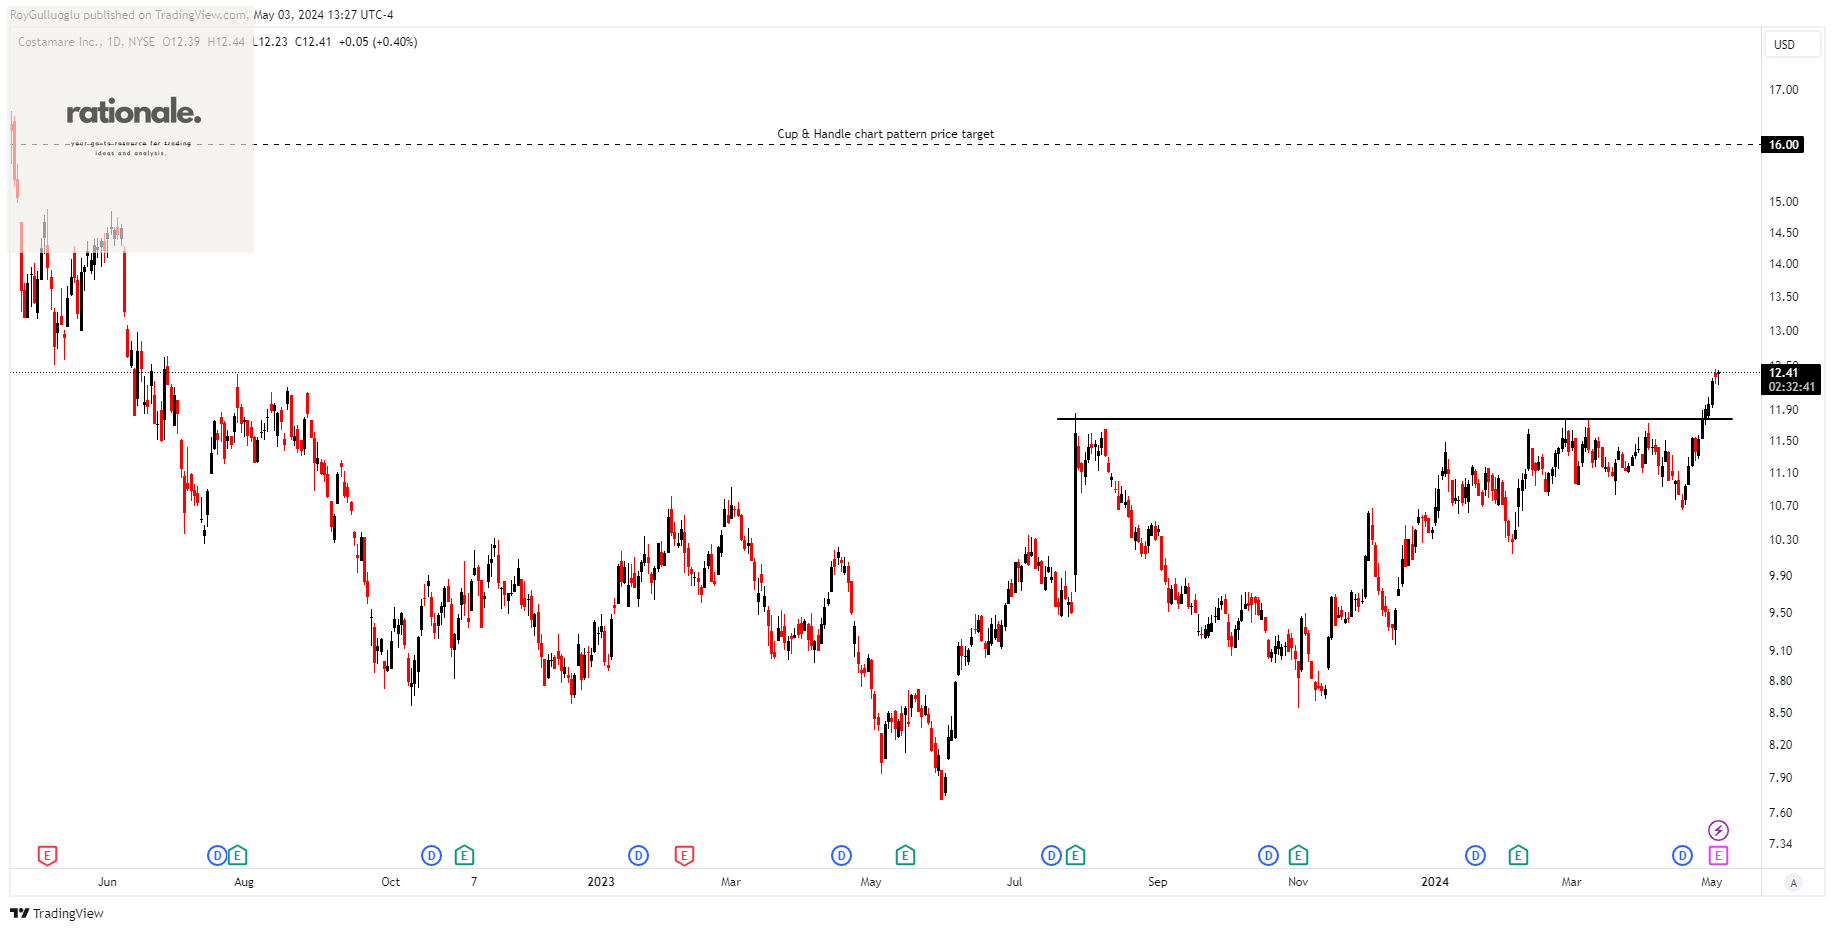
Costamare Inc. possesses and manages containerships and dry bulk vessels leased to liner companies for global cargo transportation services.
The above daily chart formed an approximately 6-month-long Cup & Handle chart pattern as a bullish continuation after an uptrend.
The horizontal boundary at 11.78 levels acted as a support within this pattern.
A daily close above 12.13 levels validated the breakout from the 6-month-long Cup & Handle chart pattern.
Based on this chart pattern, the potential price target is 16 levels.
Duolingo, Inc.-(DUOL/NASDAQ)-Long Idea
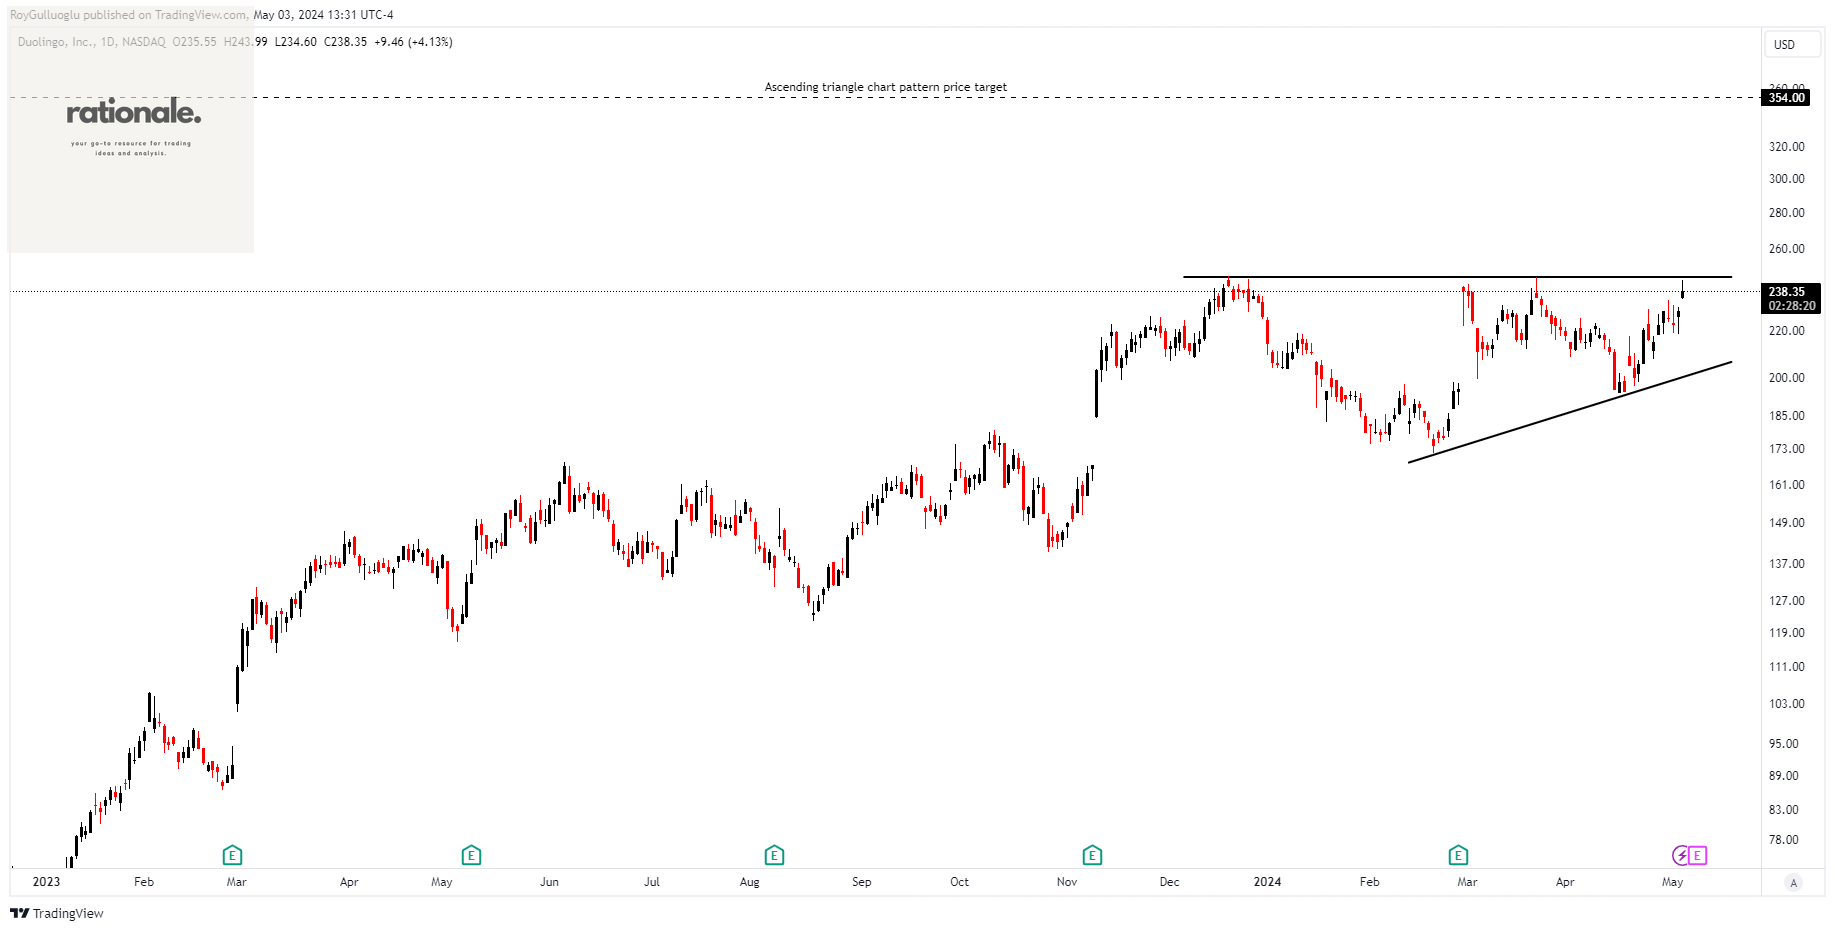
Duolingo, Inc. functions as a mobile learning platform available in the United States, the United Kingdom, and across the globe. Through its Duolingo app, the company provides courses in 40 diverse languages such as Spanish, English, French, German, Italian, Portuguese, Japanese, and Chinese.
The above daily chart formed an approximately 3-month-long ascending triangle chart pattern as a bullish continuation after an uptrend.
The horizontal boundary at 245.59 levels acts as a support within this pattern.
A daily close above 254 levels would validate the breakout from the 3-month-long ascending triangle chart pattern.
Based on this chart pattern, the potential price target is 354 levels.
Tesco PLC.-(TSCO/LSE)-Long Idea
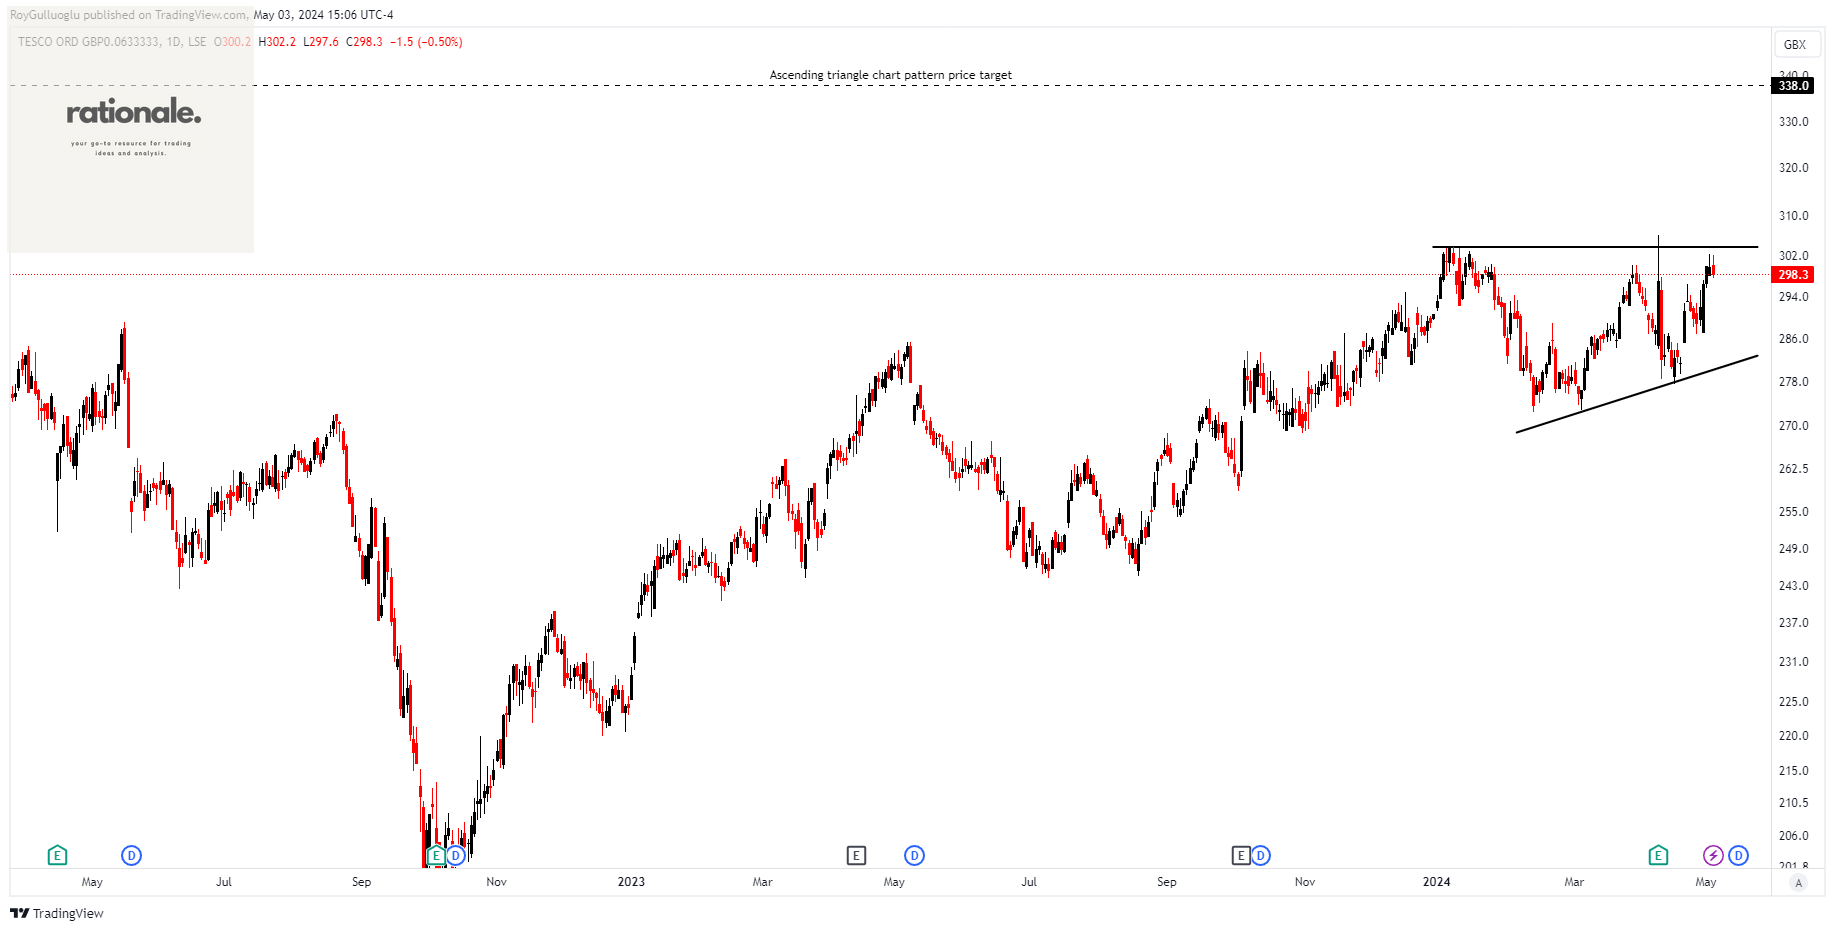
Tesco PLC, along with its subsidiaries, functions as a grocery retailer across the United Kingdom, Republic of Ireland, the Czech Republic, Slovakia, and Hungary.
The above daily chart formed an approximately 3-month-long Ascending triangle chart pattern as a bullish continuation after an uptrend.
The horizontal boundary at 303.7 levels acts as a support within this pattern.
A daily close above 312.8 levels would validate the breakout from the 3-month-long Ascending triangle chart pattern.
Based on this chart pattern, the potential price target is 338 levels.
International Consolidated Airlines Group S.A.-(IAG/LSE)-Long Idea
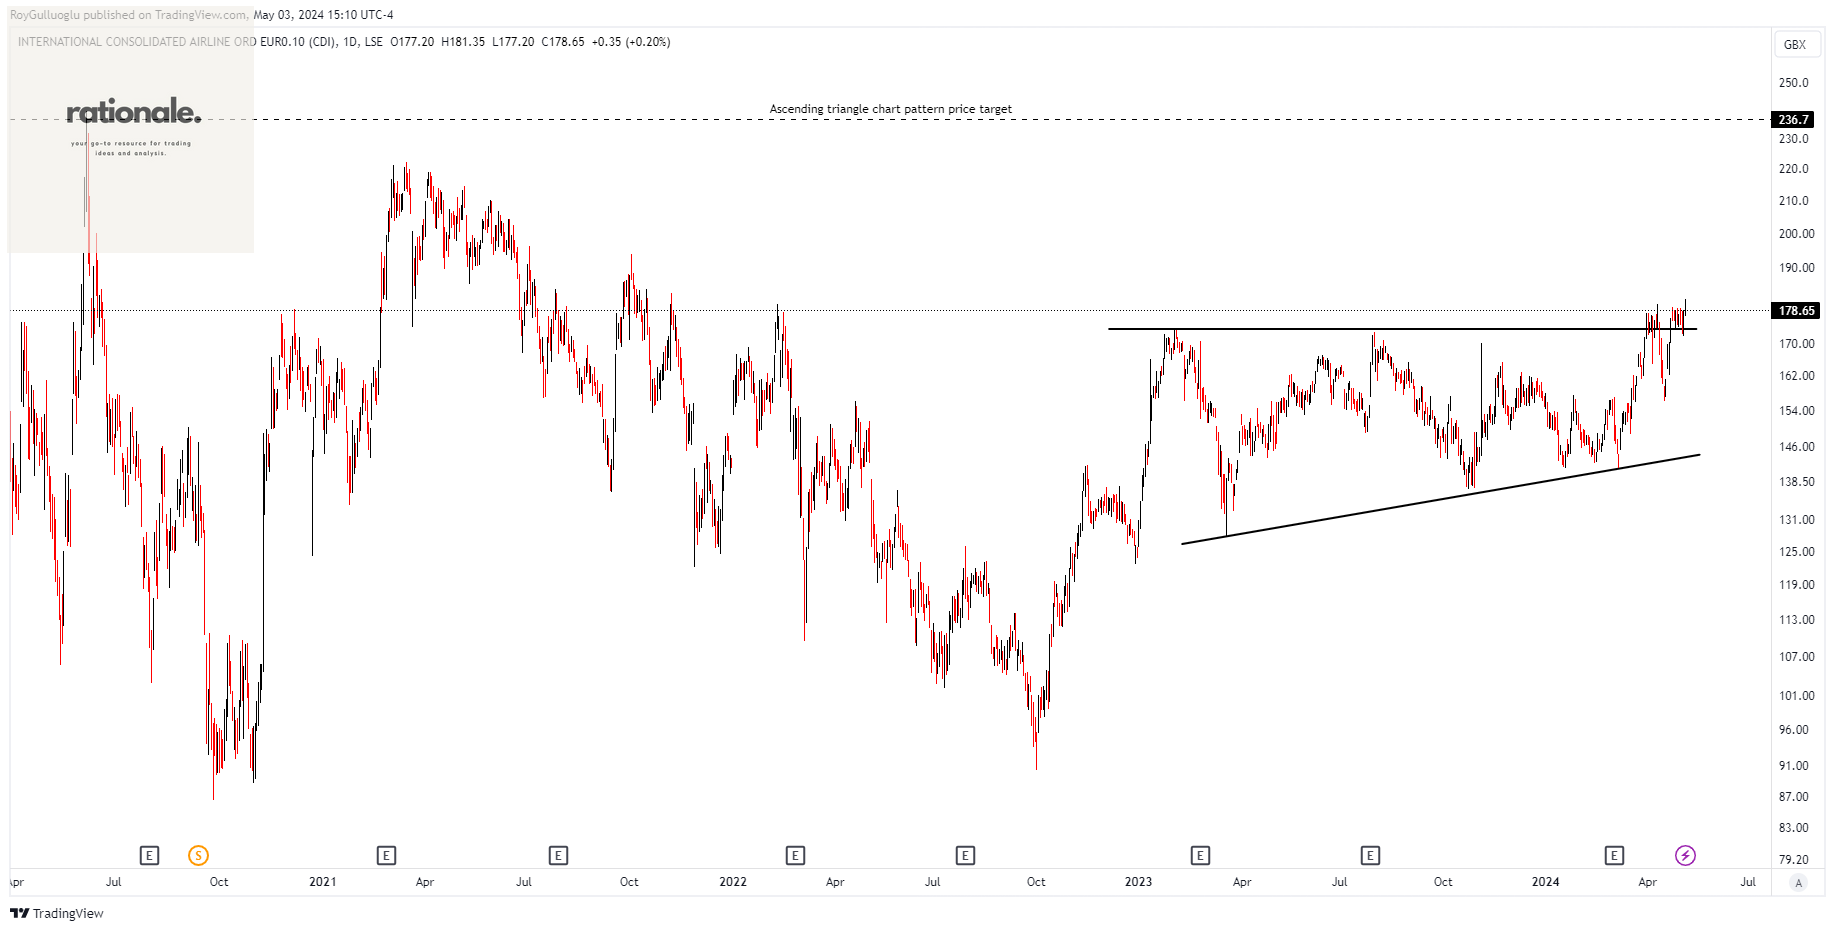
International Consolidated Airlines Group S.A., and its subsidiaries, are involved in offering passenger and cargo transportation services across the United Kingdom, Spain, the United States, and other parts of the world.
The above daily chart formed an approximately 10-month-long ascending triangle chart pattern as a bullish continuation after an uptrend.
The horizontal boundary at 173.55 levels acts as a resistance within this pattern.
A daily close above 178.75 levels would validate the breakout from the 10-month-long ascending triangle chart pattern.
Based on this chart pattern, the potential price target is 236 levels.
Lloyds Banking Group plc-(LLOY/LSE)-Long Idea
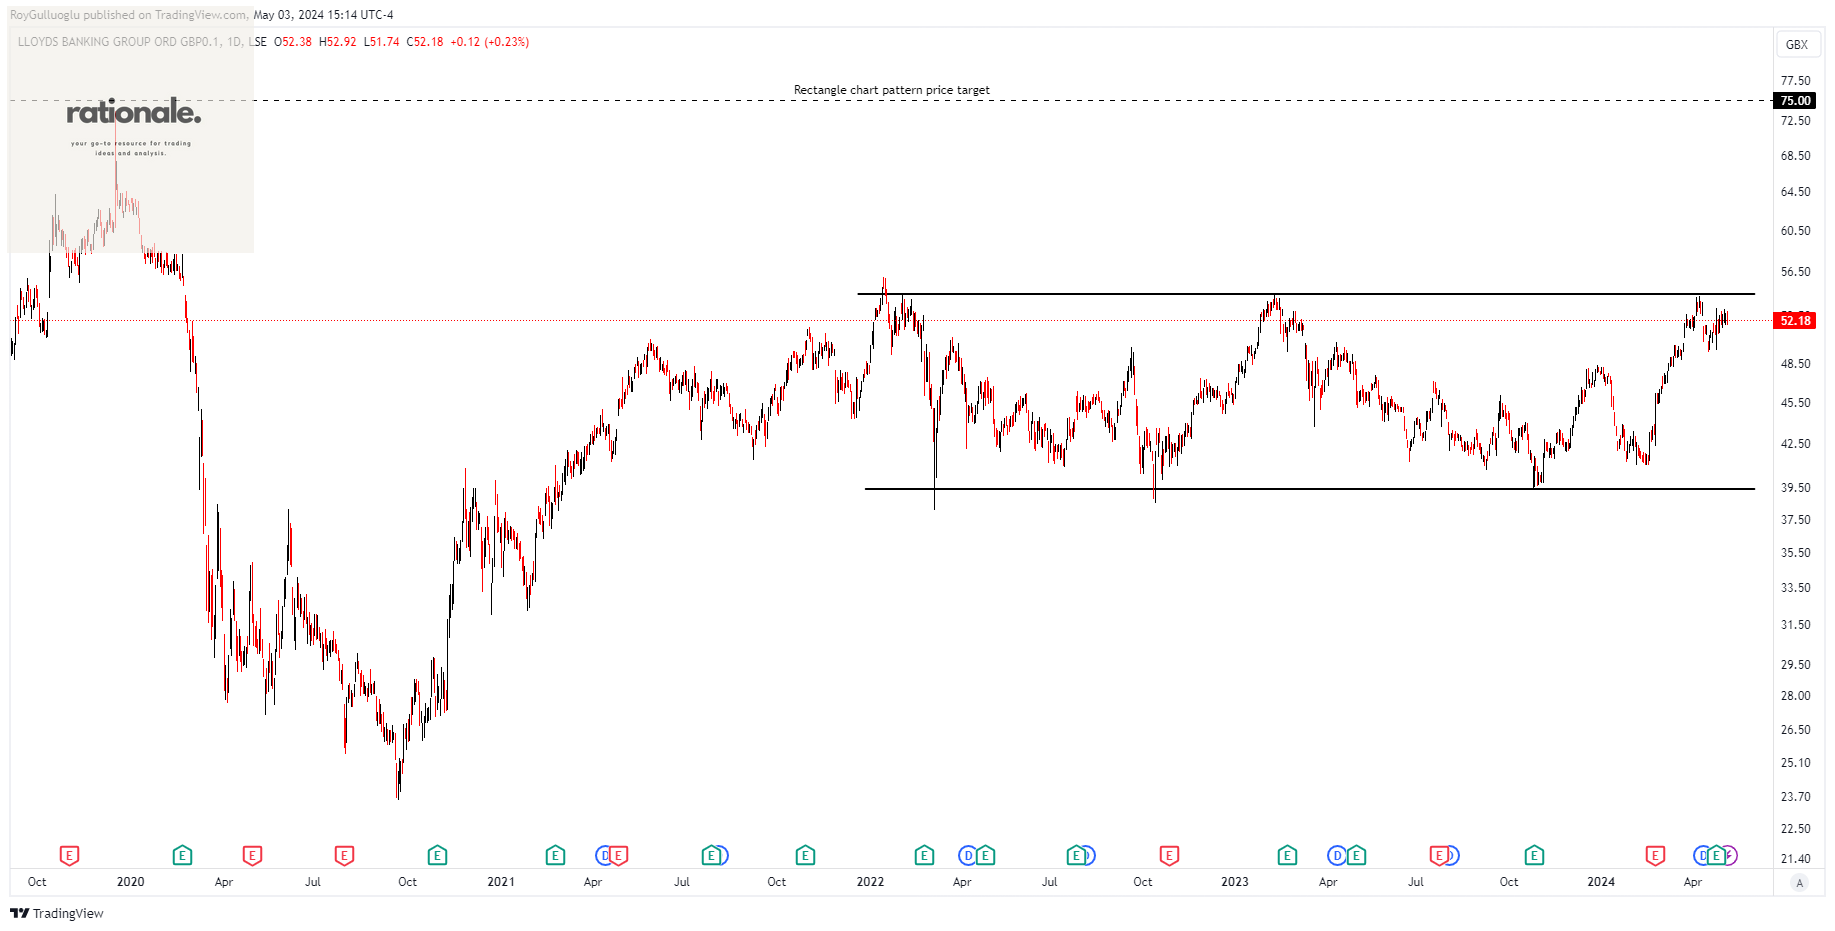
Lloyds Banking Group plc, along with its subsidiaries, offers a variety of banking and financial services both within the United Kingdom and globally.
The above daily chart formed an approximately 20-month-long rectangle chart pattern as a bullish continuation after an uptrend.
The horizontal boundary at 54.44 levels acts as a resistance within this pattern.
A daily close above 56 levels would validate the breakout from the 20-month-long rectangle chart pattern.
Based on this chart pattern, the potential price target is 75 levels.
Aksa Enerji Üretim A.S.-(AKSEN/BIST)-Long Idea
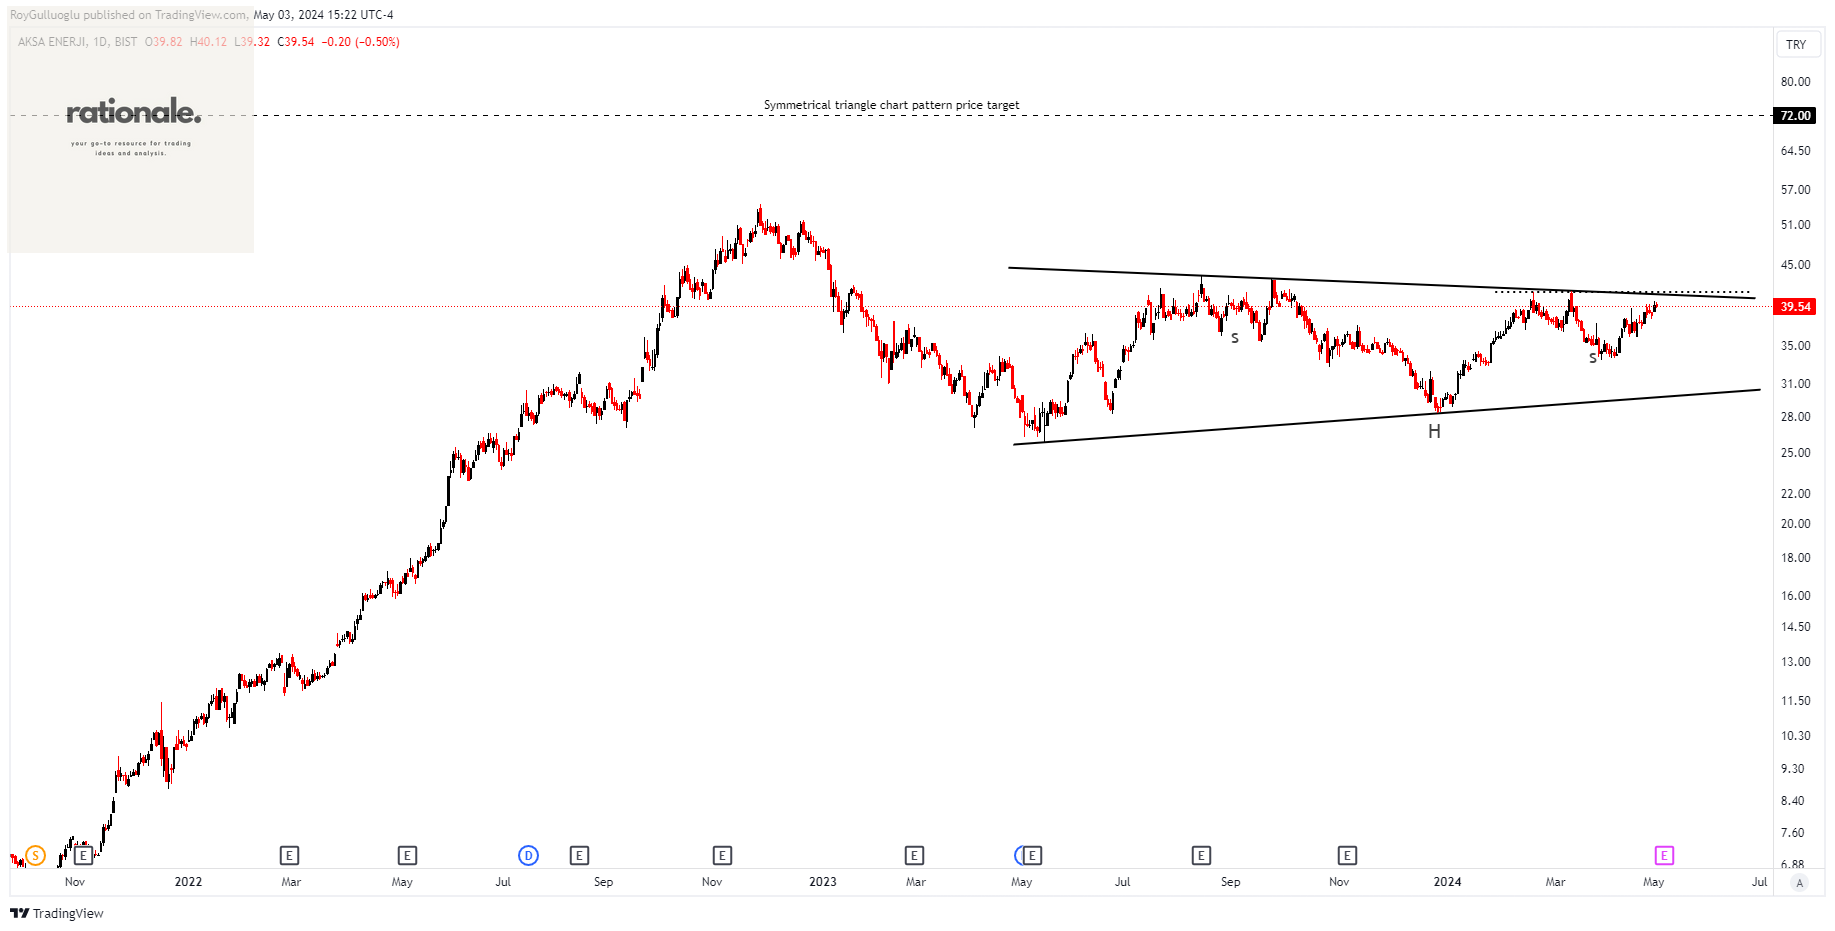
Aksa Enerji Üretim A.S., an independent power producer, generates and markets electricity in Turkey, Asia, and Africa. The company generates energy from coal, fuel oil, biogas, natural gas, wind, and hydroelectric sources.
The above weekly chart potentially forms an approximately 8-month-long symmetrical triangle chart pattern as a bullish reversal after a downtrend.
The horizontal boundary at 41.3 levels acts as a support within this pattern.
A daily close above 42.54 levels would validate the breakout from the 8-month-long symmetrical triangle chart pattern.
Based on this chart pattern, the potential price target is 72 levels.
Valuable work, nice setups... Thanks a lot for sharing.