


New setups
Deluxe Corporation-(DLX/NYSE) - Long Idea
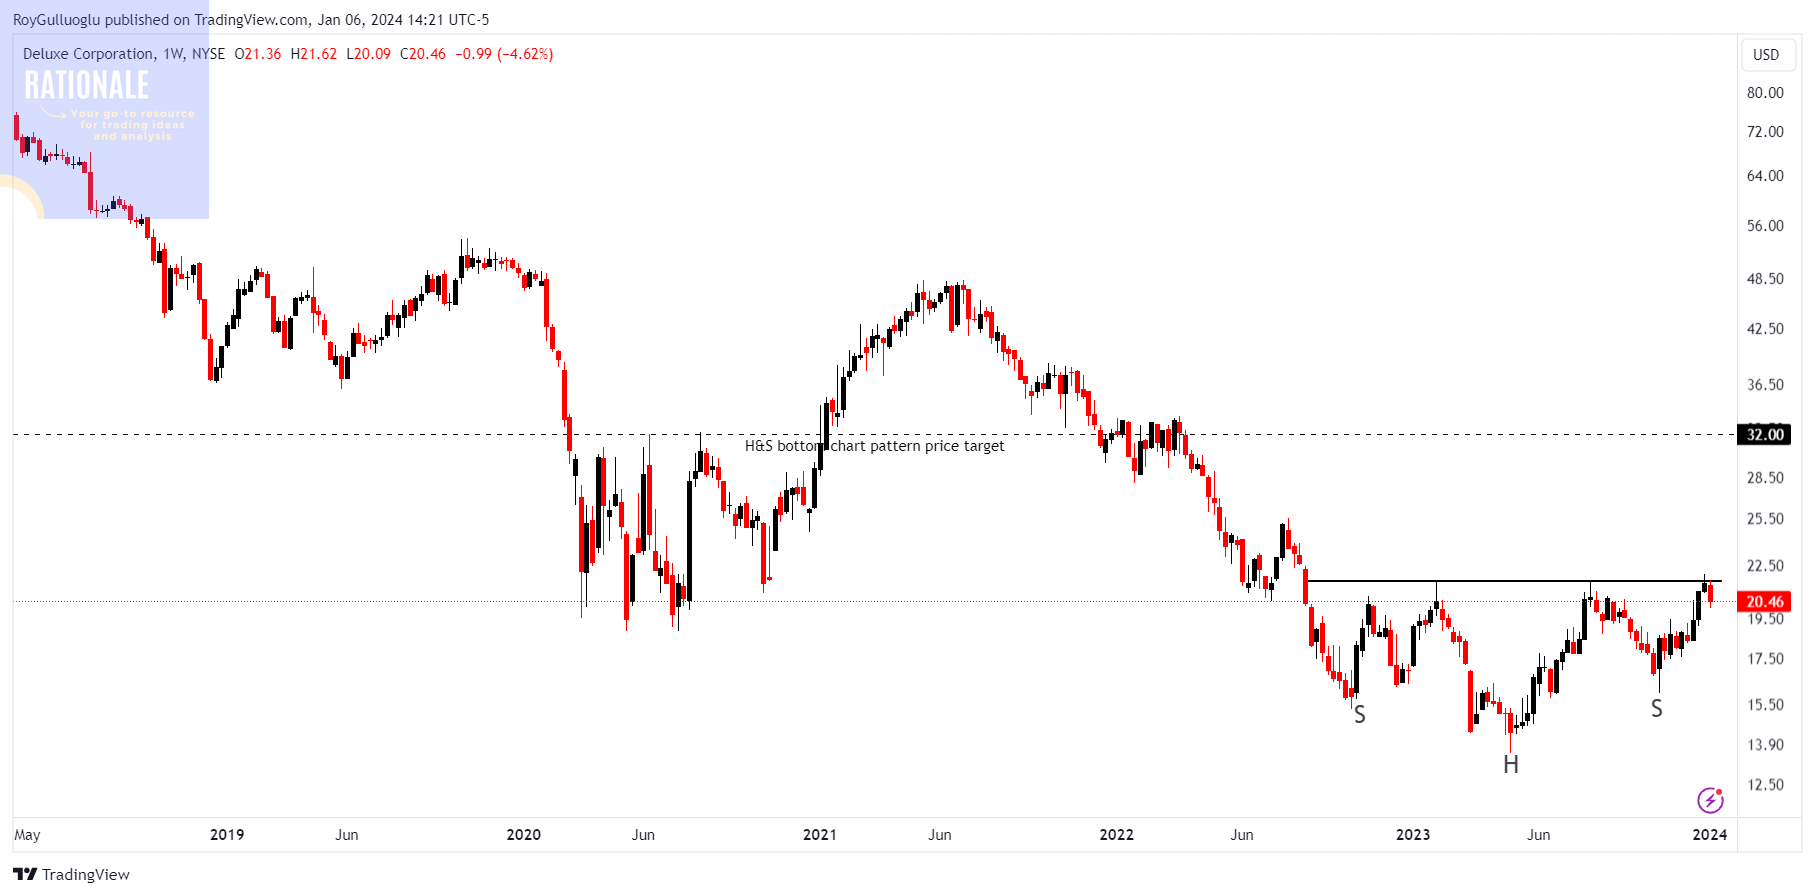
Deluxe Corporation is a company that provides various business services and solutions, primarily targeting small businesses and financial institutions. Deluxe Corporation's services include business checks and forms, promotional products, website services, payment solutions, and small business marketing services.
The above weekly chart formed an approximately 17-month-long H&S bottom chart pattern as a bullish reversal after a downtrend.
Within this pattern, the horizontal boundary at 21.57 levels acts as a resistance.
A daily close above 22.21 levels would validate the breakout from the 17-month-long H&S bottom chart pattern.
Based on this chart pattern, the potential price target is 32 levels.
DLX, classified under the "communication services" sector, falls under the “Small Cap - Growth” stock category.
Acadia Healthcare Company, Inc.-(ACHC/NASDAQ) - Long Idea
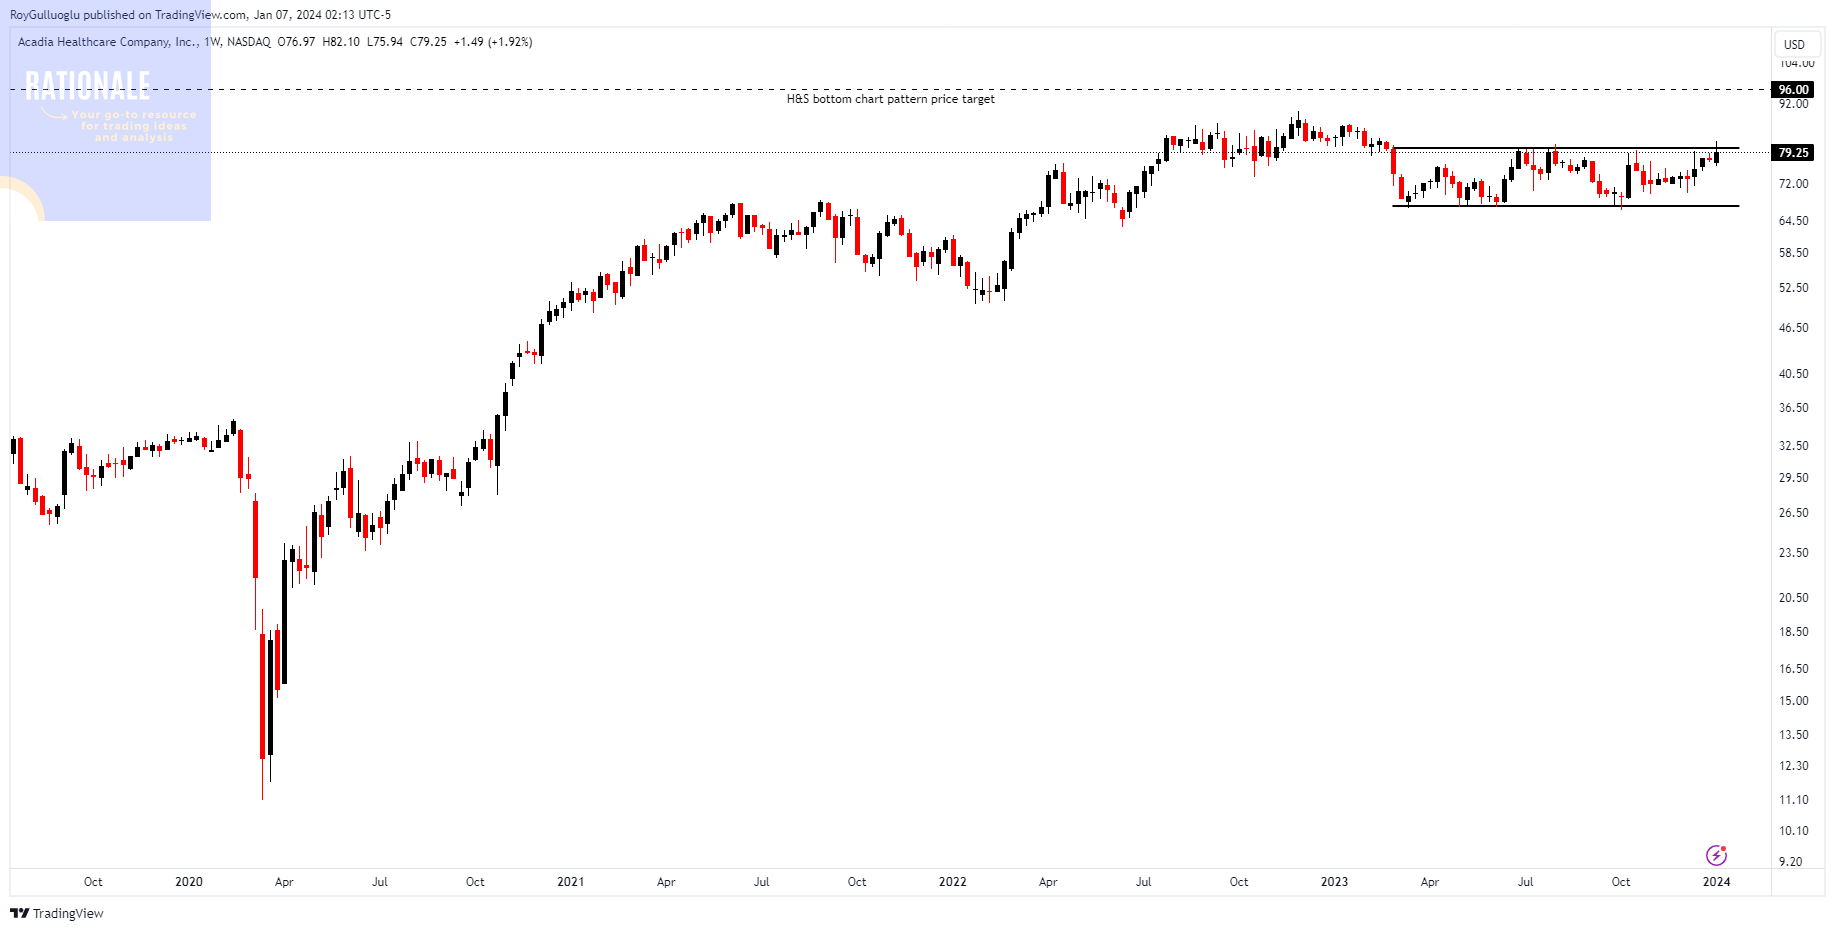
Acadia Healthcare operates a network of behavioral health facilities, including psychiatric hospitals, residential treatment centers, outpatient clinics, and addiction treatment facilities. The company's services encompass various mental health and addiction treatment programs for individuals of all ages.
The above weekly chart formed an approximately 10-month-long rectangle chart pattern.
Within this pattern, the horizontal boundary at 80 levels acts as a resistance.
A daily close above 82.4 levels would validate the breakout from the 10-month-long rectangle chart pattern.
Based on this chart pattern, the potential price target is 96 levels.
ACHC, classified under the "healthcare" sector, falls under the “Mid Cap - Value” stock category.
Immunovant Inc.-(IMVT/NASDAQ)-Long Idea
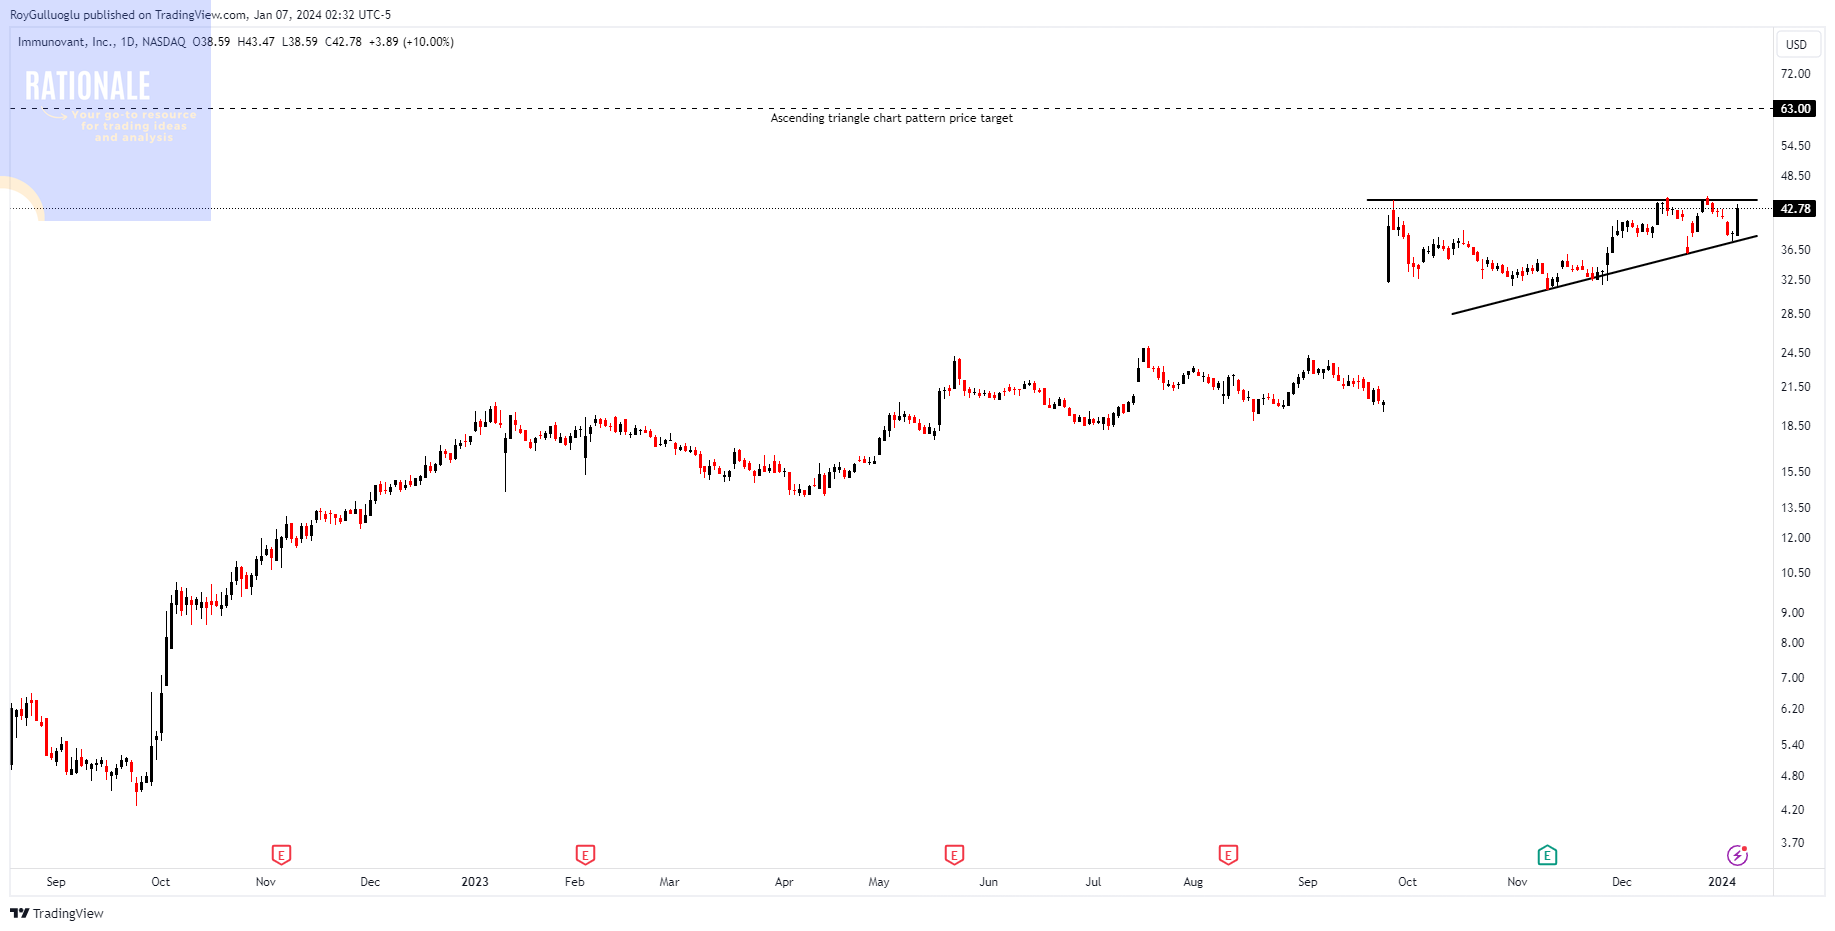
Immunovant Inc. is a biopharmaceutical company that focuses on the development and commercialization of therapies for autoimmune diseases.
The above daily chart formed an approximately 2-month-long ascending triangle chart pattern as a bullish continuation after an uptrend.
Within this pattern, the boundary at 138.5 levels acts as a resistance.
A daily close above 44.2 levels would validate the breakout from the 2-month-long ascending triangle chart pattern.
Based on this chart pattern, the potential price target is 63 levels.
IMVT, classified under the "healthcare" sector, falls under the “Mid Cap - Value” stock category.
Multiple quarters of EPS, and revenue acceleration YoY in Quarterly Earnings is another strength of the stock.
Five9, Inc.-(FIVN/NASDAQ)-Long Idea
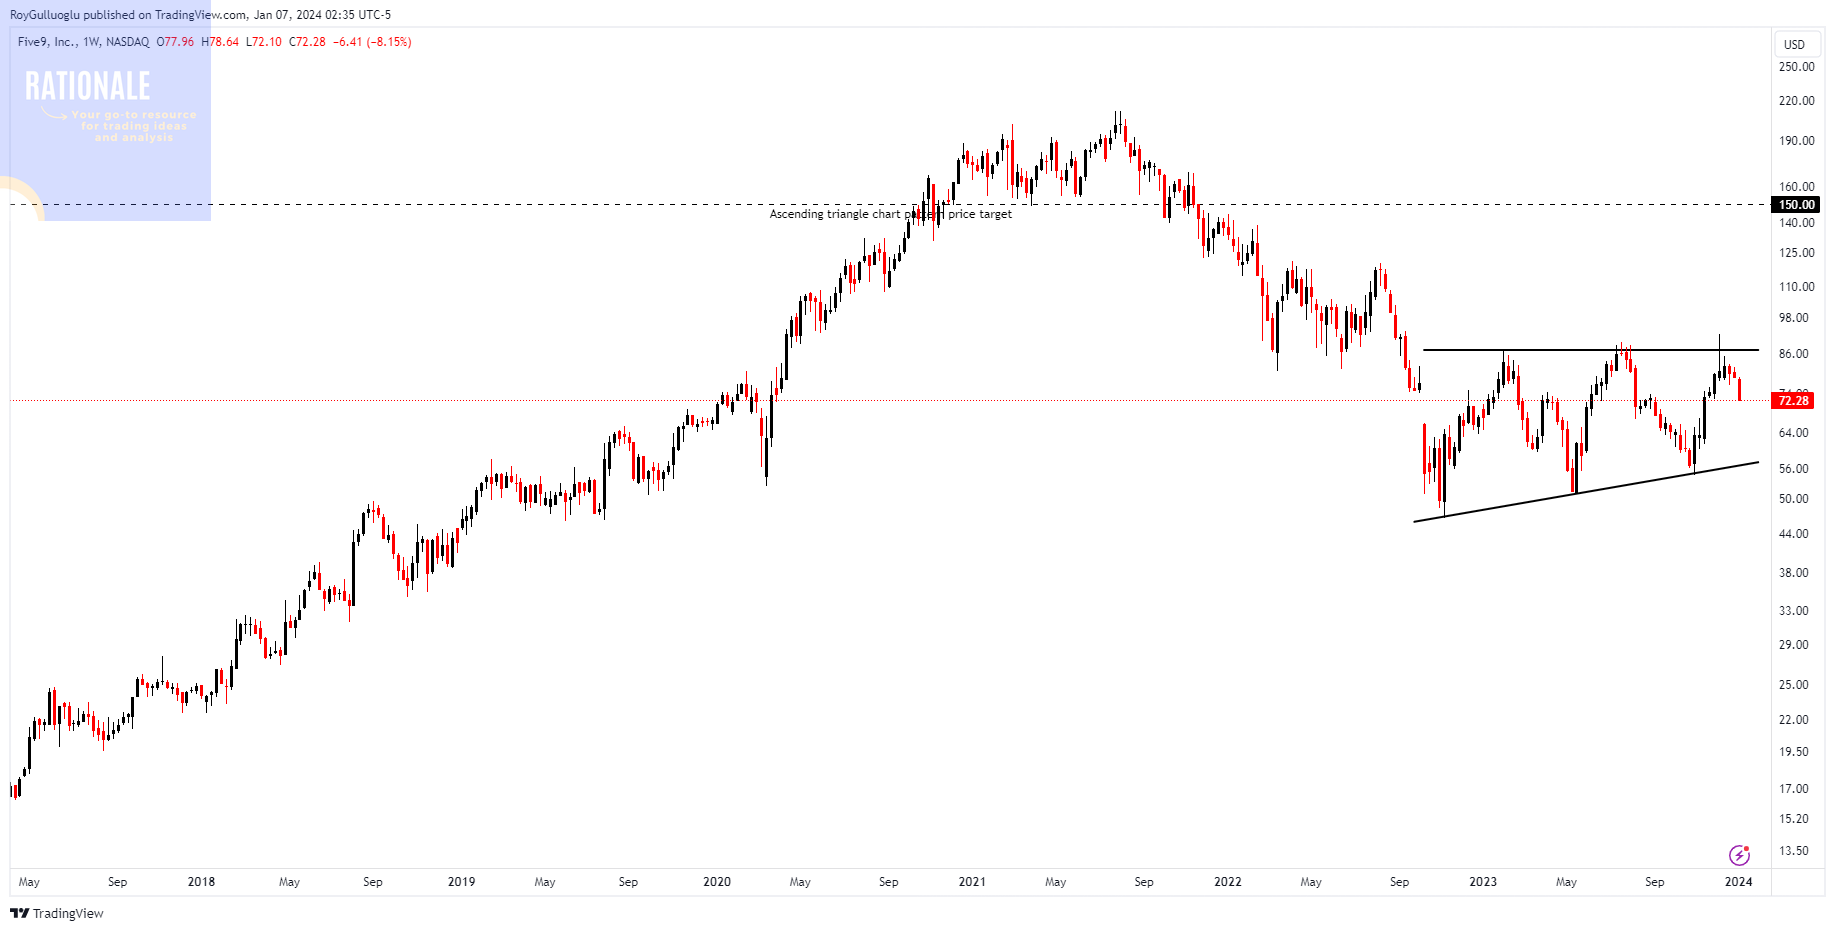
Five9 is a company that specializes in providing cloud-based contact center solutions. Five9 focuses on delivering software and services that help organizations manage and optimize their customer engagement and interaction processes.
The above weekly chart formed an approximately 14-month-long ascending triangle chart pattern as a bullish reversal after a downtrend.
Within this pattern, the horizontal boundary at 86.84 levels acts as a resistance.
A daily close above 89.44 levels would validate the breakout from the 14-month-long ascending triangle chart pattern.
Based on this chart pattern, the potential price target is 84.66 levels.
CAMT, classified under the "technology" sector, falls under the “Mid Cap - Growth” stock category.
Equitrans Midstream Corporation-(ETRN/NYSE)-Long Idea
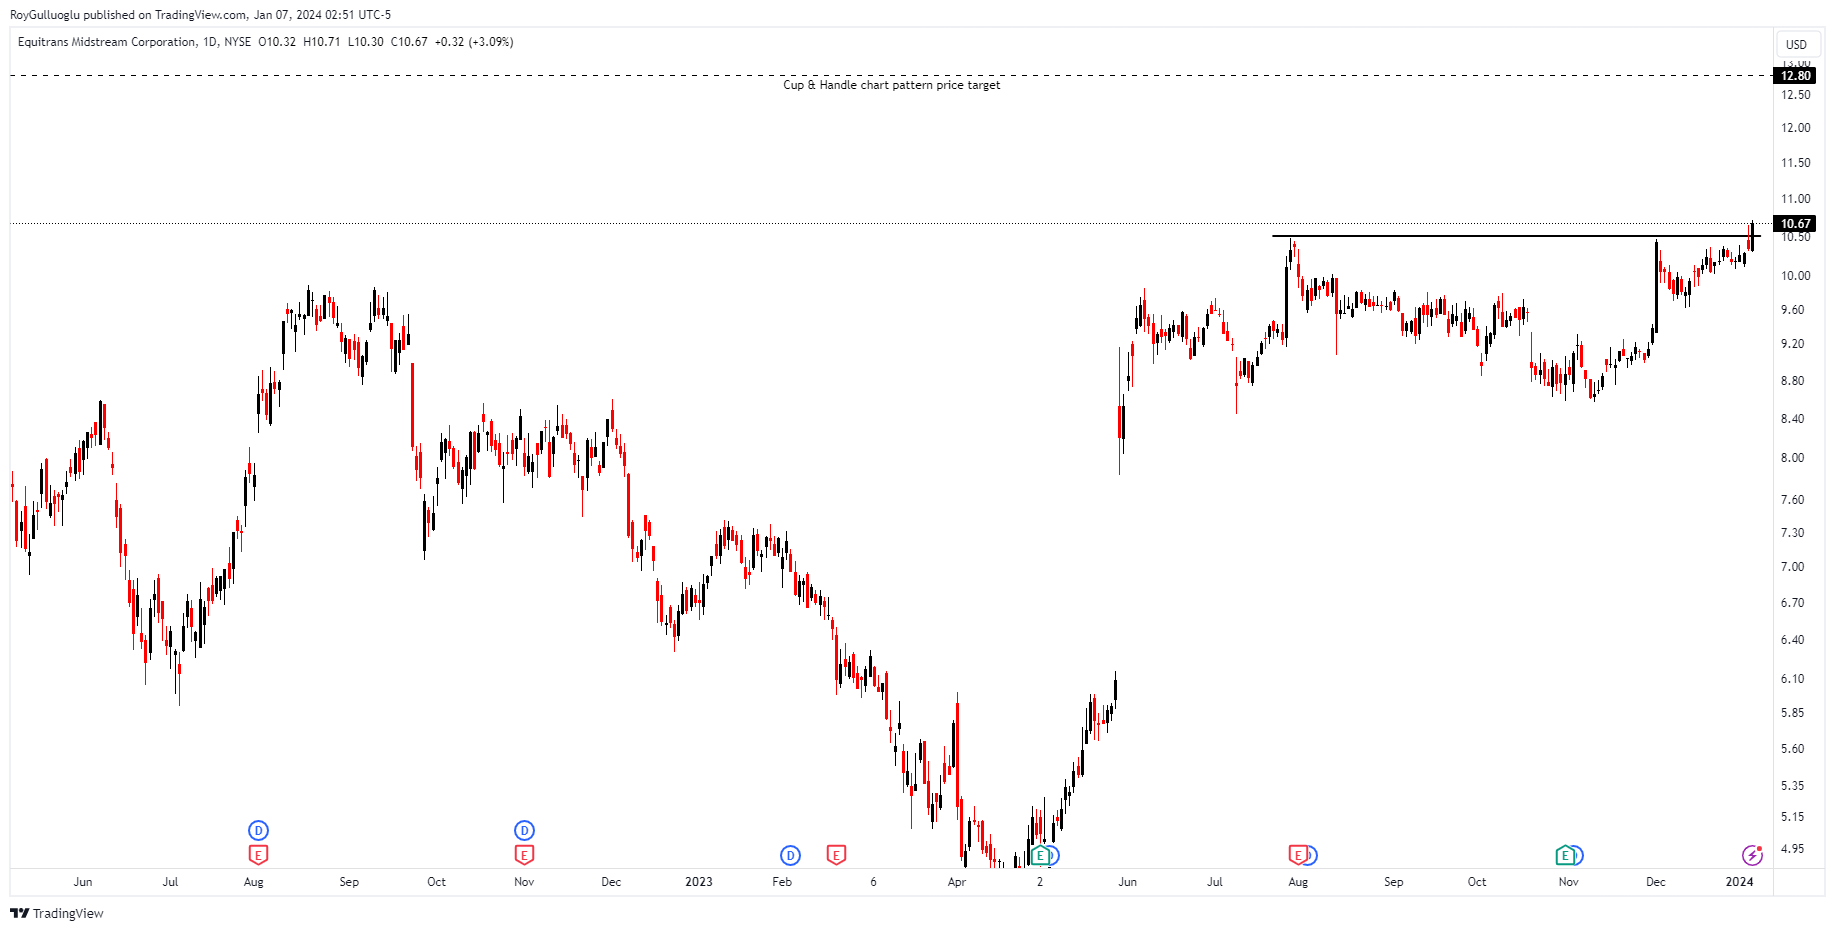
Equitrans Midstream Corporation is a company in the midstream energy sector, primarily focused on the gathering, transmission, and storage of natural gas.
The above daily chart formed an approximately 3-month-long Cup & Handle chart pattern as a bullish continuation after an uptrend.
Within this pattern, the horizontal boundary at 10.5 levels acts as a resistance.
A daily close above 10.8 levels would validate the breakout from the 3-month-long Cup & Handle chart pattern.
Based on this chart pattern, the potential price target is 12.8 levels.
ETRN, classified under the "energy" sector, falls under the “Mid Cap - Income” stock category.
Azenta, Inc.-(AZTA/NASDAQ)-Long Idea
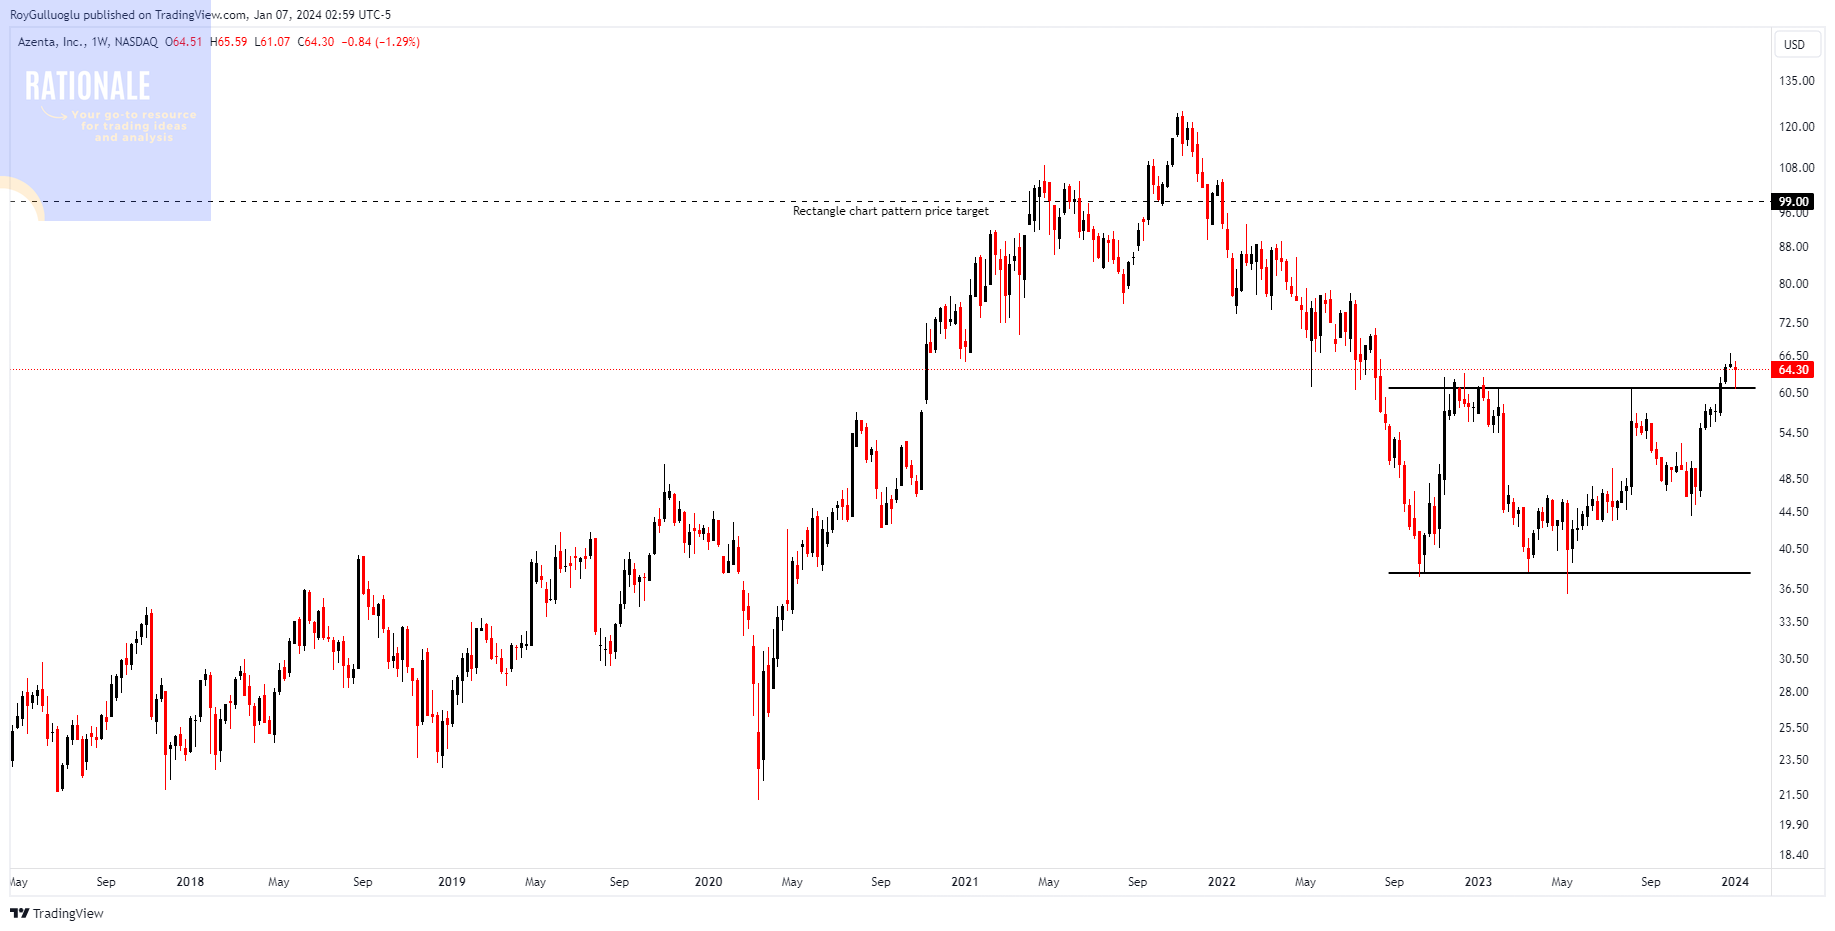
Azenta offers services in the field of life sciences, encompassing genomics, cryogenic storage, automation, and informatics.
The above weekly chart formed an approximately 15-month-long rectangle chart pattern as a bullish reversal after a downtrend.
Within this pattern, the horizontal boundary at 61.2 levels acted as a resistance.
A daily close above 63 levels validated the breakout from the 15-month-long rectangle chart pattern.
Based on this chart pattern, the potential price target is 99 levels.
AZTA, classified under the "healthcare" sector, falls under the “Mid Cap - Value” stock category.
Axos Financial, Inc.-(AX/NYSE)-Long Idea
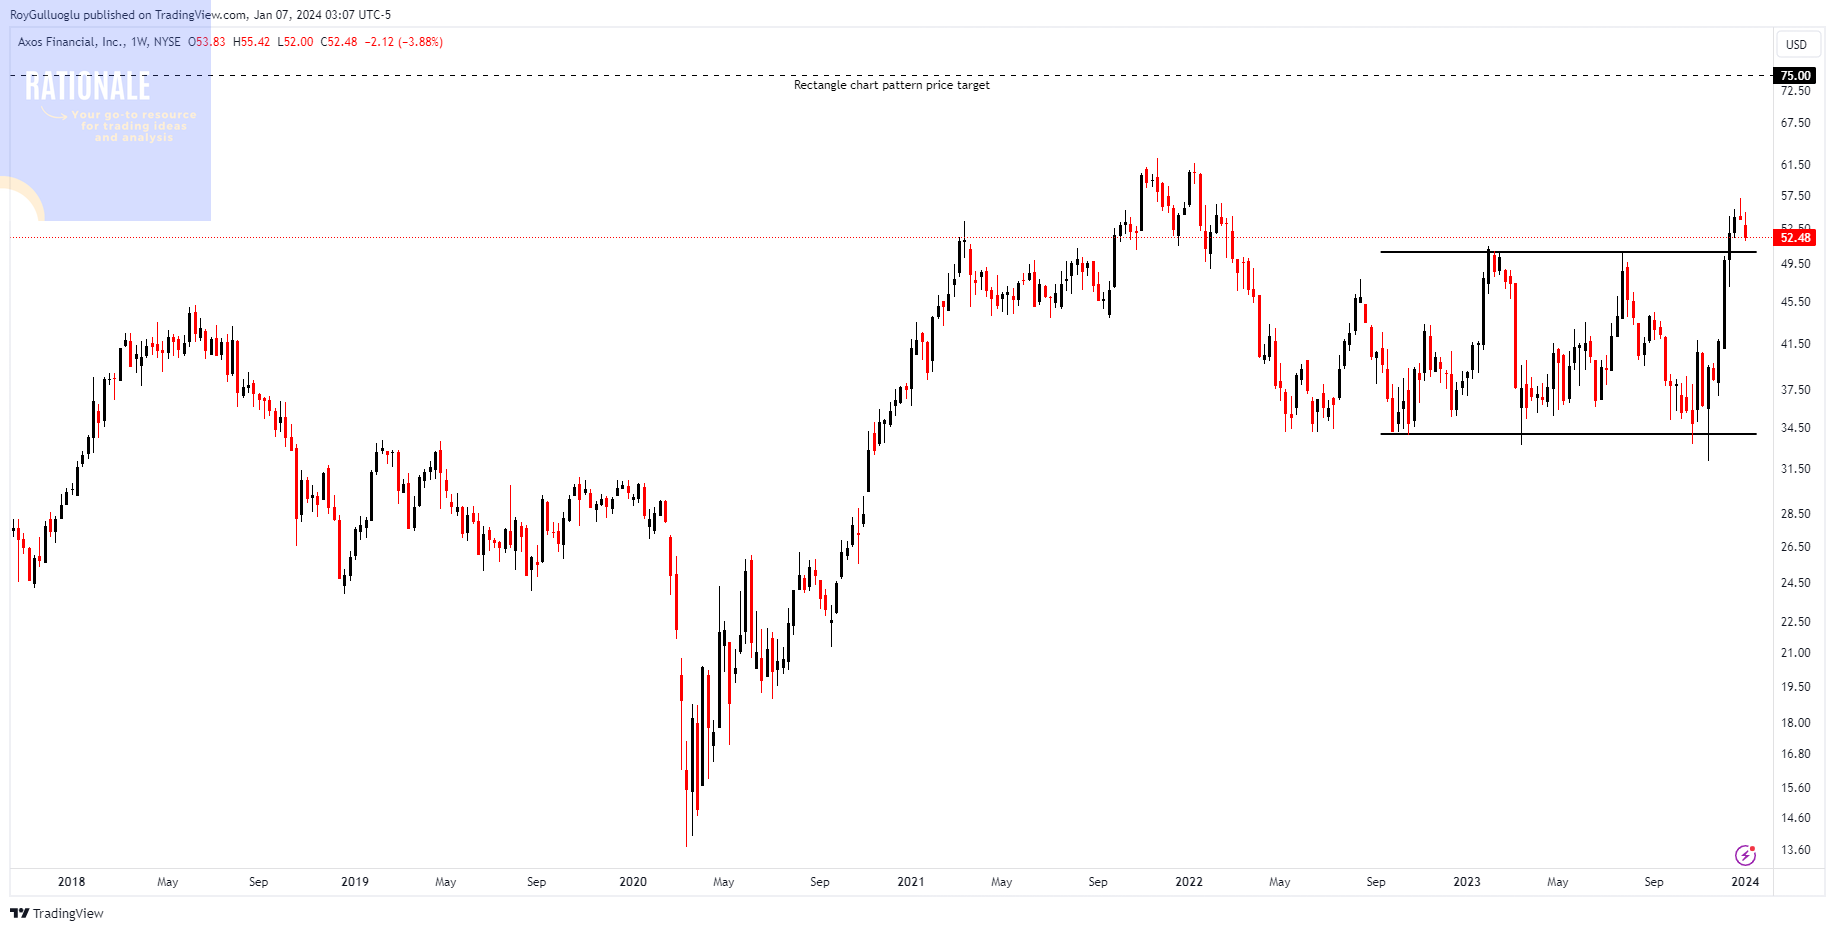
Axos Financial, Inc., together with its subsidiaries, provides consumer and business banking products in the United States. It operates through two segments, Banking Business and Securities Business.
The above weekly chart formed an approximately 15-month-long rectangle chart pattern as a bullish reversal after a downtrend.
Within this pattern, the horizontal boundary at 50.8 levels acted as a resistance.
A daily close above 52.3 levels validated the breakout from the 15-month-long rectangle chart pattern.
Based on this chart pattern, the potential price target is 75 levels.
AXOS, classified under the "financial services" sector, falls under the “Mid Cap - Income” stock category.
Dynavax Technologies Corporation-(DVAX/NASDAQ)-Long Idea
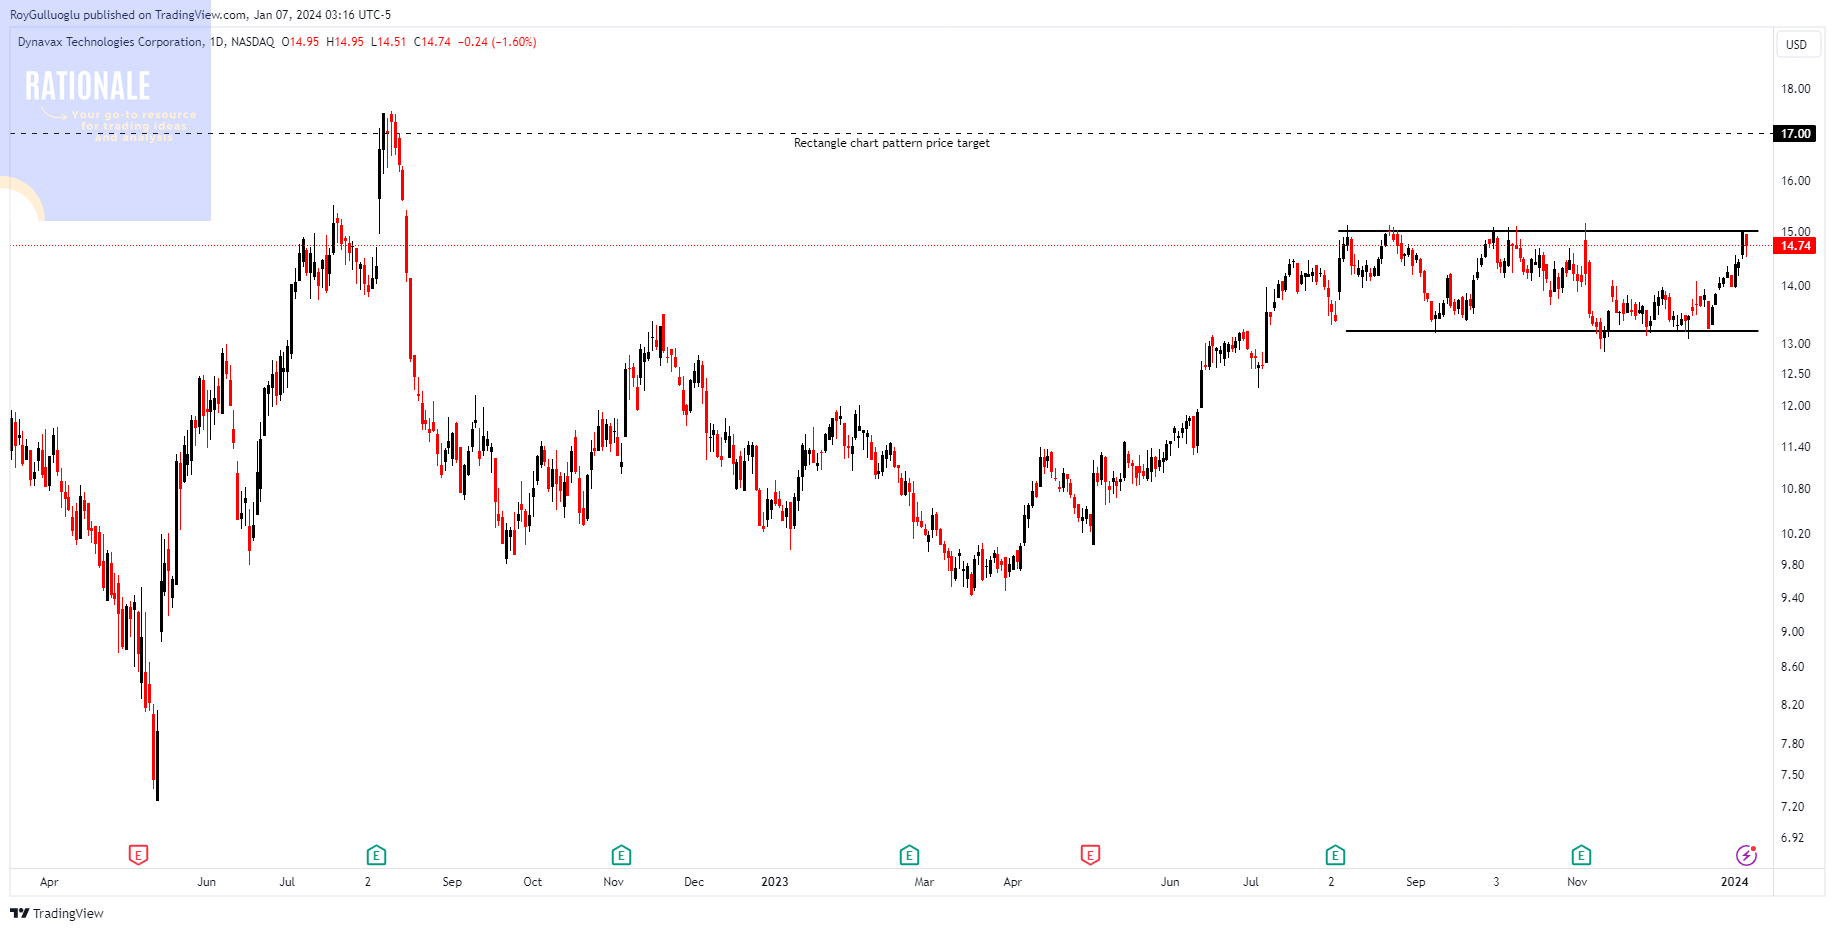
Dynavax Technologies Corporation is a biopharmaceutical company that focuses on the development and commercialization of vaccines.
The above weekly chart formed an approximately 3-month-long rectangle chart pattern as a bullish continuation after an uptrend.
Within this pattern, the horizontal boundary at 15 levels acted as a resistance.
A daily close above 15.45 levels would validate the breakout from the 3-month-long rectangle chart pattern.
Based on this chart pattern, the potential price target is 17 levels.
DVAX, classified under the "healthcare" sector, falls under the “Small Cap - Value” stock category.
Follow-ups
AEON HOKKAIDO CORP-(7512/TSE)-Long/Short Idea
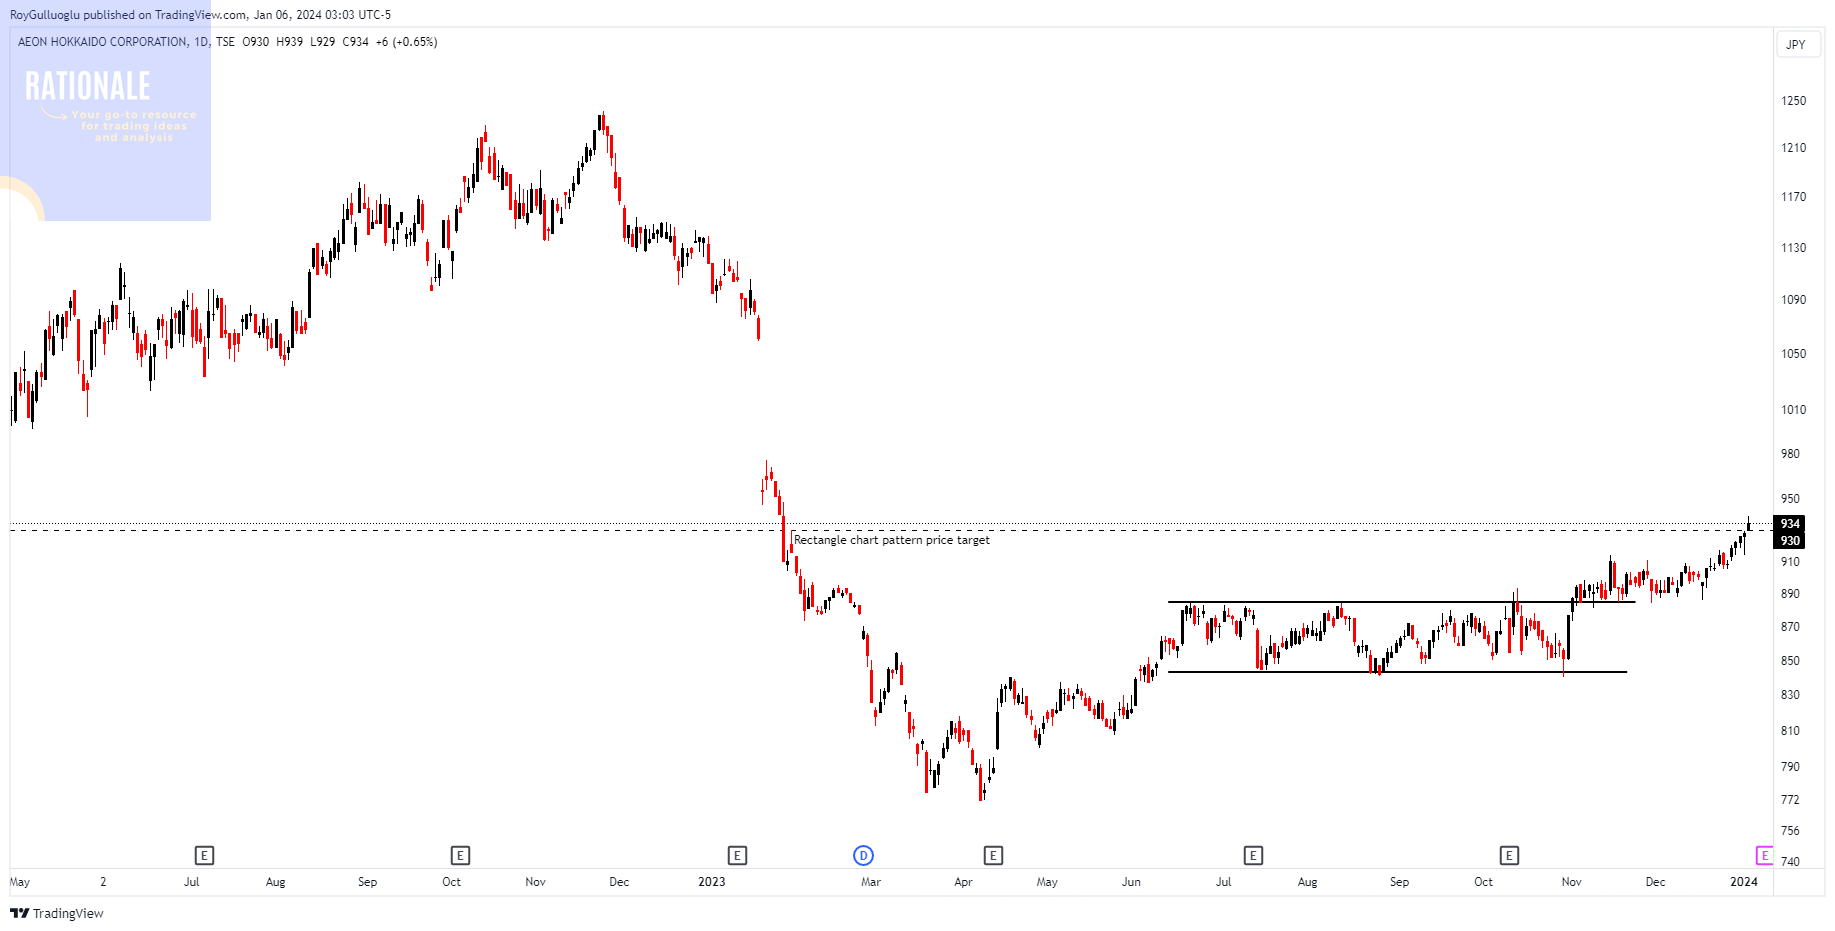
You can click the 7512 ticker above to access the first report explaining the RATIONALE behind the trade idea.
The rectangle chart pattern price target is reached.