


AppLovin Corporation-(APP/NASDAQ)-Long Idea
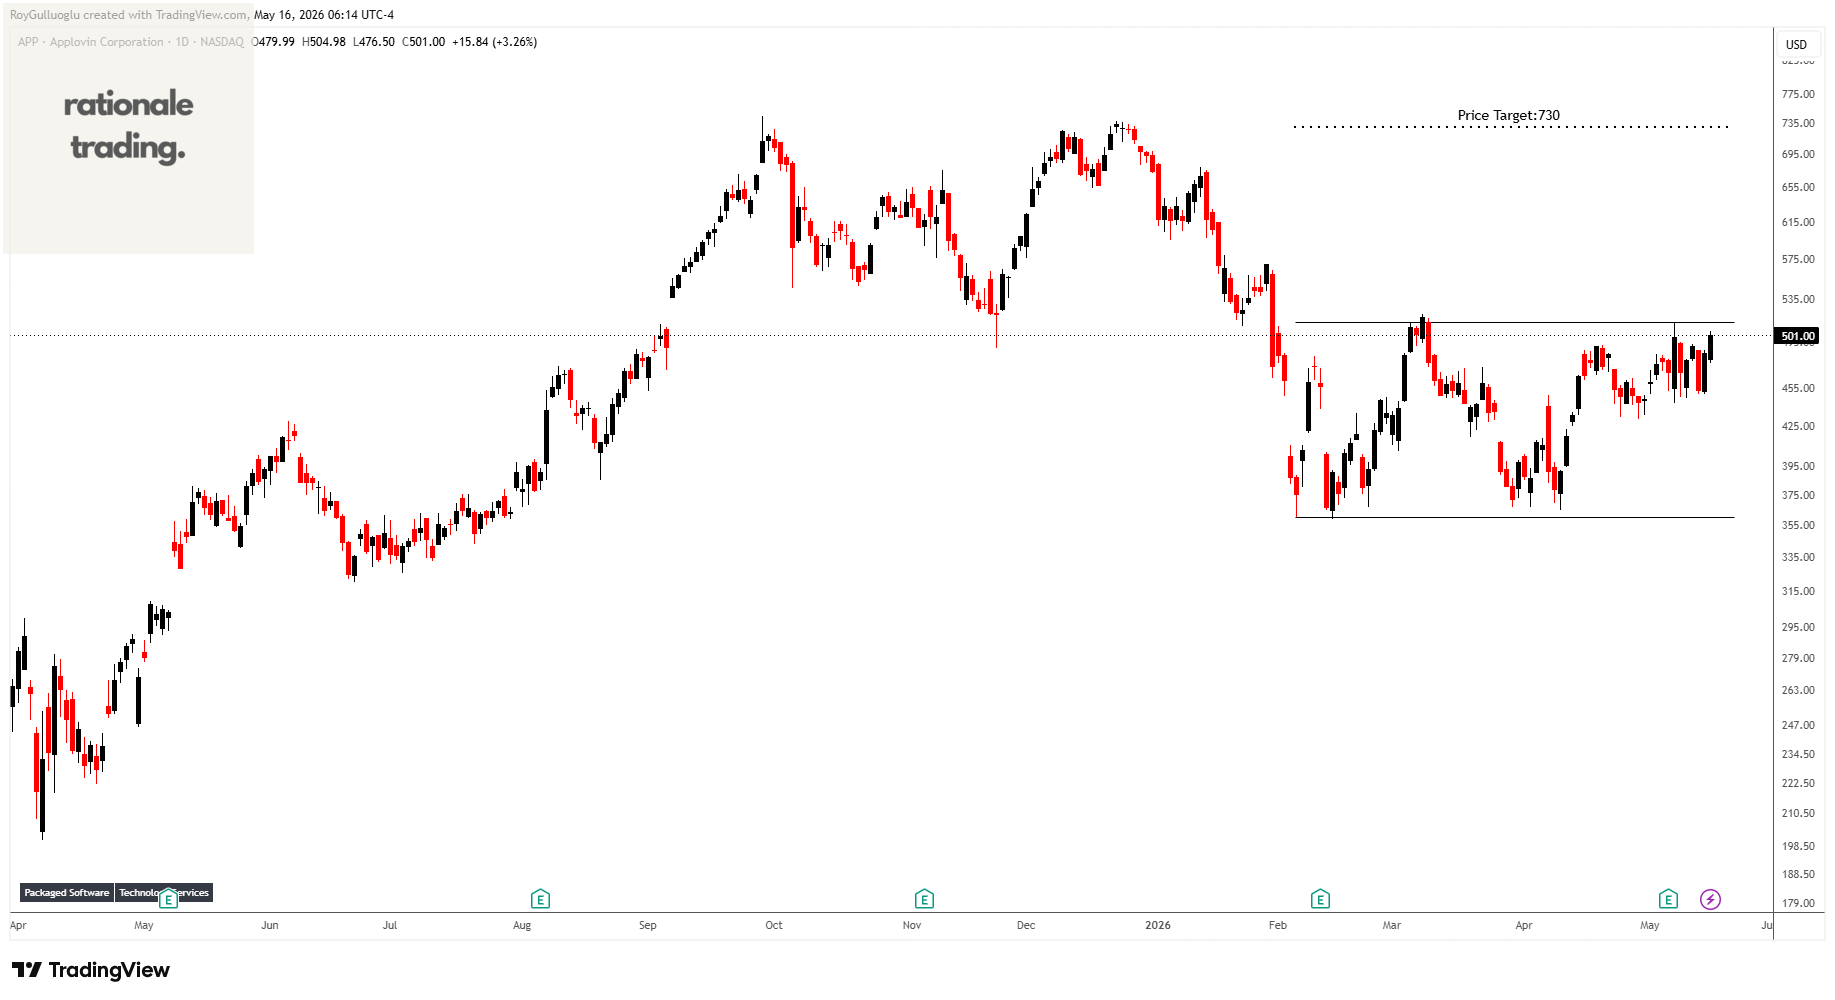
AppLovin Corporation provides end-to-end artificial intelligence-powered advertising solutions for businesses in the United States and internationally.
The above daily chart formed an approximately 2-month-long rectangle chart pattern as a bullish reversal after a downtrend.
The horizontal boundary at 512.69 levels acts as a resistance within this pattern.
A daily close above 528 levels would validate the breakout from the 2-month-long rectangle chart pattern.
Based on this chart pattern, the potential price target is 730 levels.
IREN Limited-(IREN/NASDAQ)-Long Idea
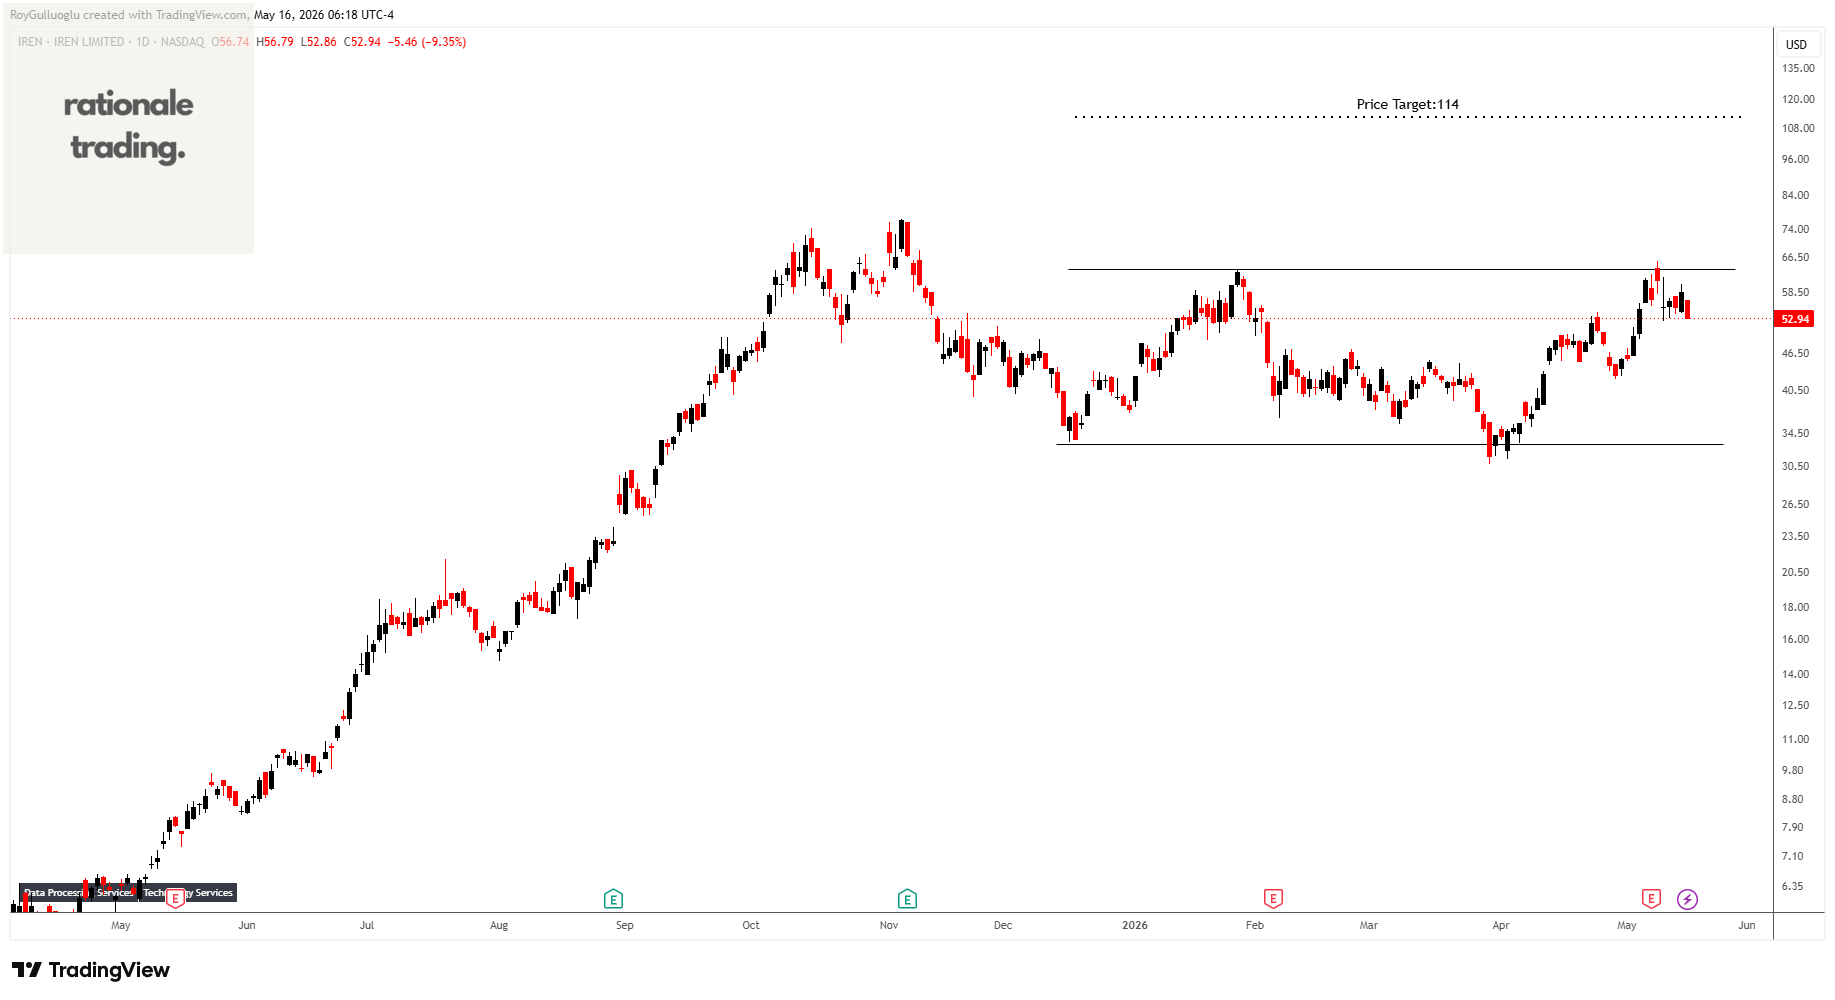
IREN Limited operates in the vertically integrated data center business in Australia and Canada.
The above daily chart formed an approximately 2-month-long rectangle chart pattern as a bullish reversal after a downtrend.
The horizontal boundary at 63.59 levels acts as a resistance within this pattern.
A daily close above 65.5 levels would validate the breakout from the 2-month-long rectangle chart pattern.
Based on this chart pattern, the potential price target is 114 levels.
Match Group, Inc.-(MTCH/NASDAQ)-Long Idea
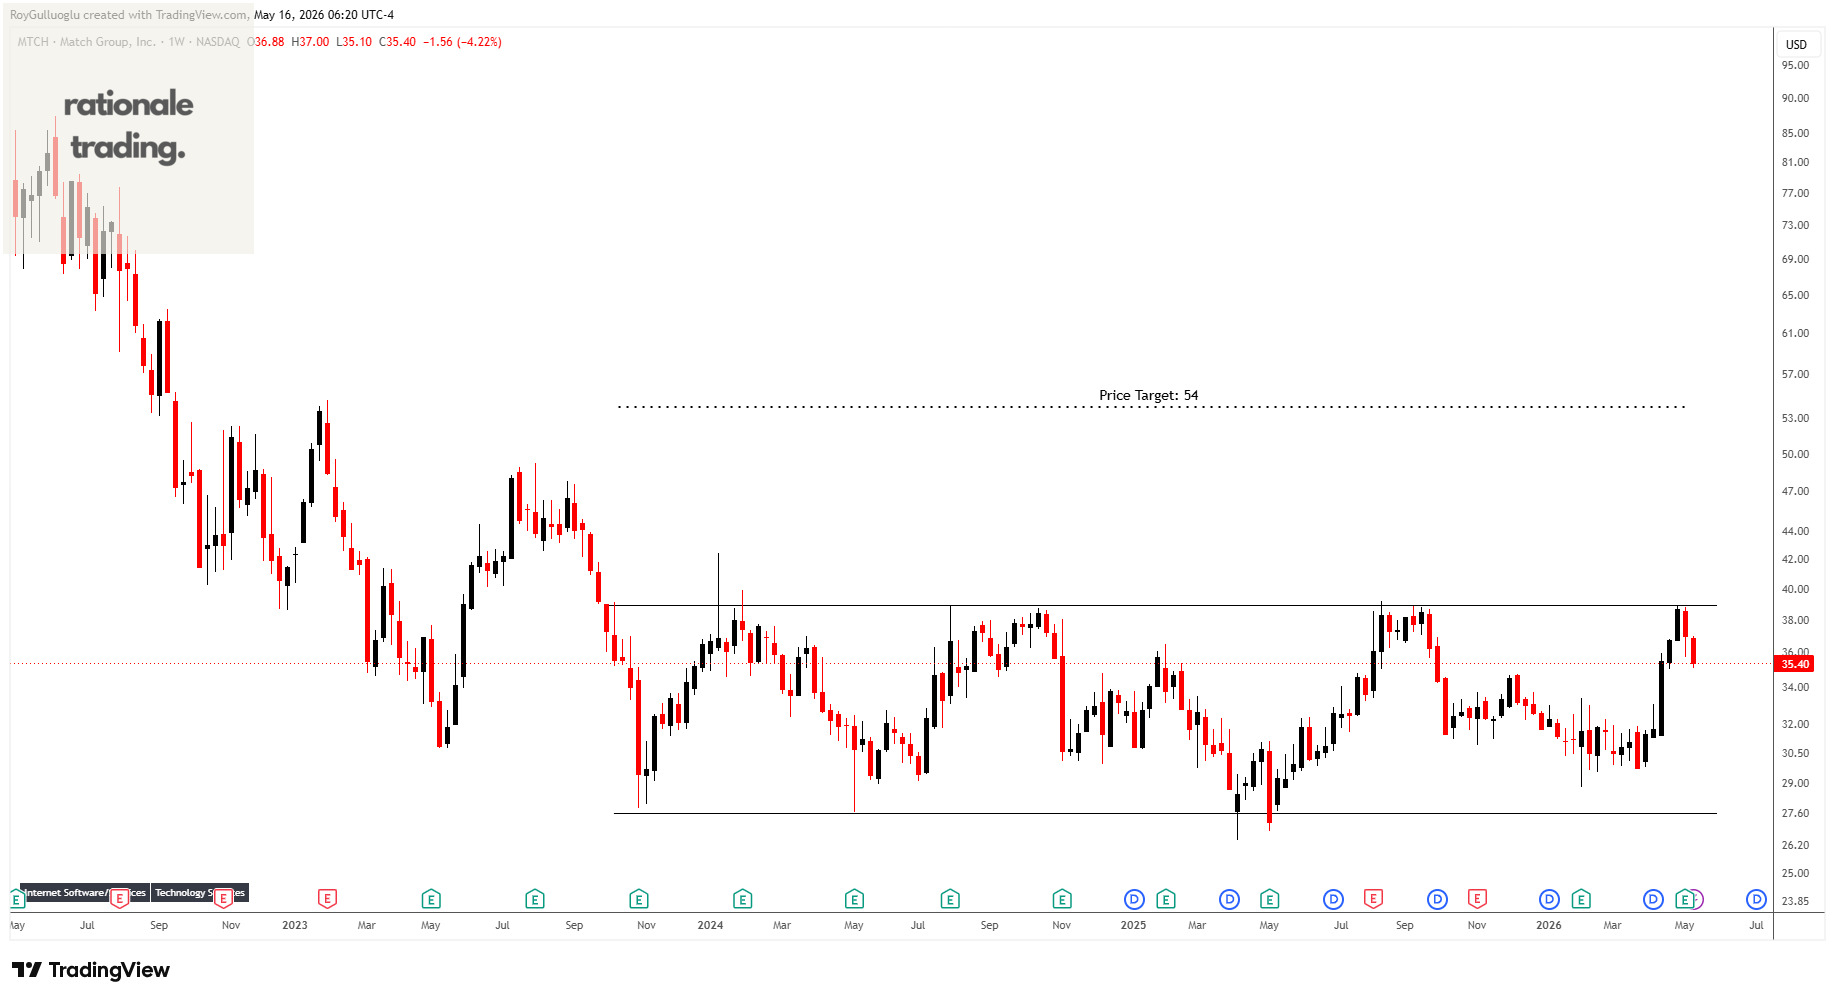
Match Group, Inc. provides digital technologies in the United States and internationally.
The above weekly chart formed an approximately 32-month-long rectangle chart pattern as a bullish reversal after a downtrend.
The horizontal boundary at 38.94 levels acts as a resistance within this pattern.
A daily close above 40.1 levels would validate the breakout from the 32-month-long rectangle chart pattern.
Based on this chart pattern, the potential price target is 54 levels.
Okinawa Financial Group, Inc.-(7350/TSE)-Long Idea
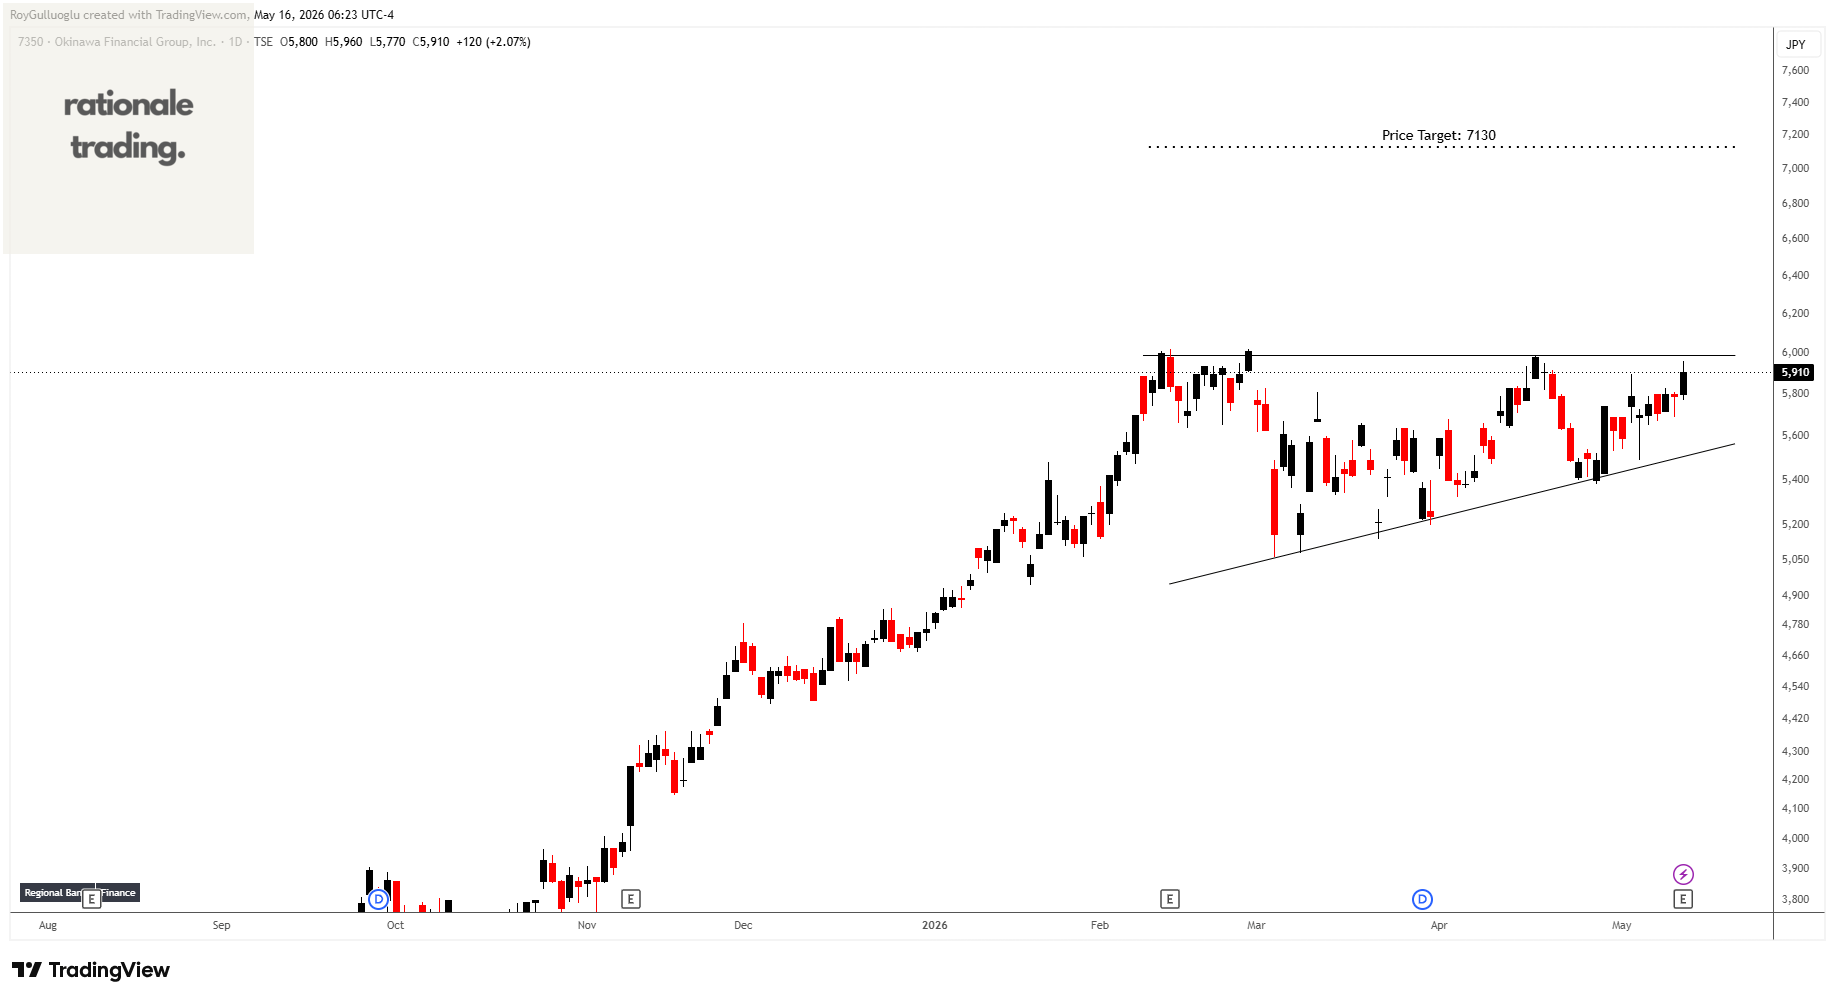
Okinawa Financial Group, Inc. provides various financial services in Japan. It operates through two segments, Banking and Leasing.
The above daily chart formed an approximately 2-month-long ascending triangle chart pattern as a bullish continuation after an uptrend.
The horizontal boundary at 5990 levels acts as a resistance within this pattern.
A daily close above 6170 levels would validate the breakout from the 2-month-long ascending triangle chart pattern.
Based on this chart pattern, the potential price target is 7130 levels.
AeroEdge Co., Ltd. -(7409/TSE)-Short Idea
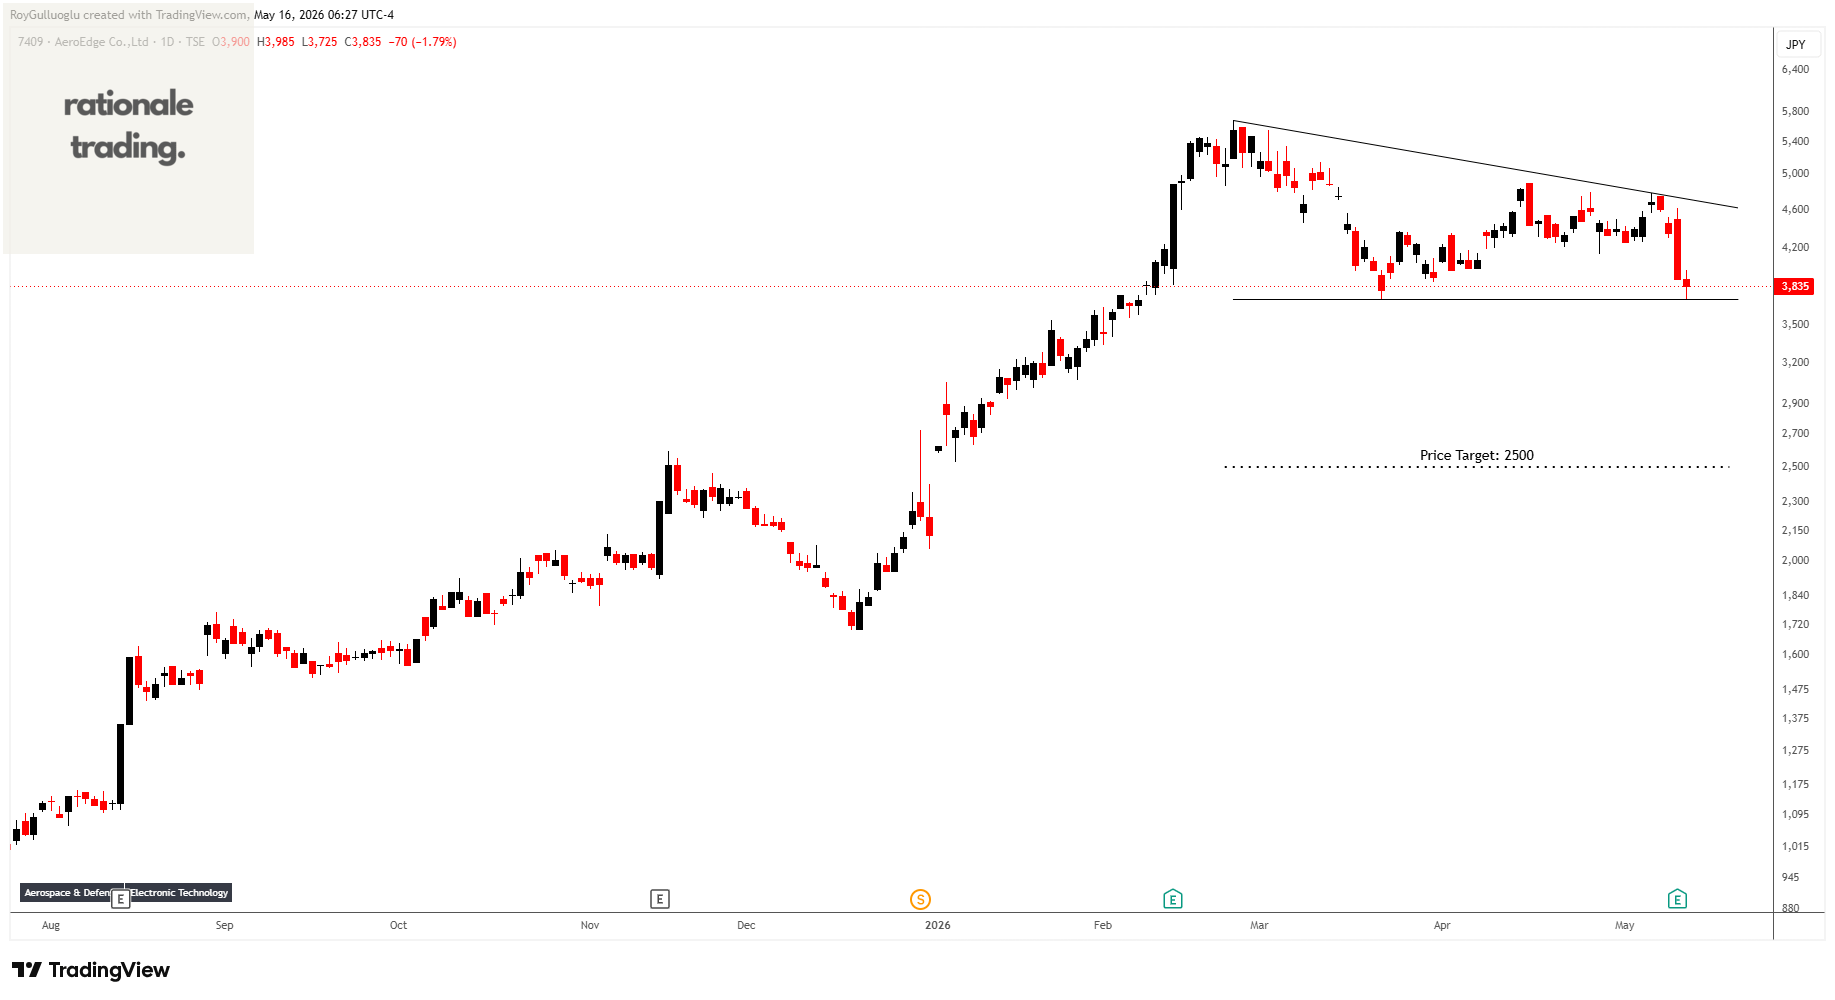
AeroEdge Co., Ltd. manufactures and sells aerospace engine parts in Japan.
The above daily chart formed an approximately 2-month-long descending triangle chart pattern as a bearish reversal after an uptrend.
The horizontal boundary at 3725 levels acts as a support within this pattern.
A daily close below 3615 levels would validate the breakout from the 2-month-long descending triangle chart pattern.
Based on this chart pattern, the potential price target is 2500 levels.