


Strategic Education, Inc.-(STRA/NASDAQ)-Long Idea
Strategic Education, Inc. provides education services through campus-based and online post-secondary education, and programs to develop job-ready skills.
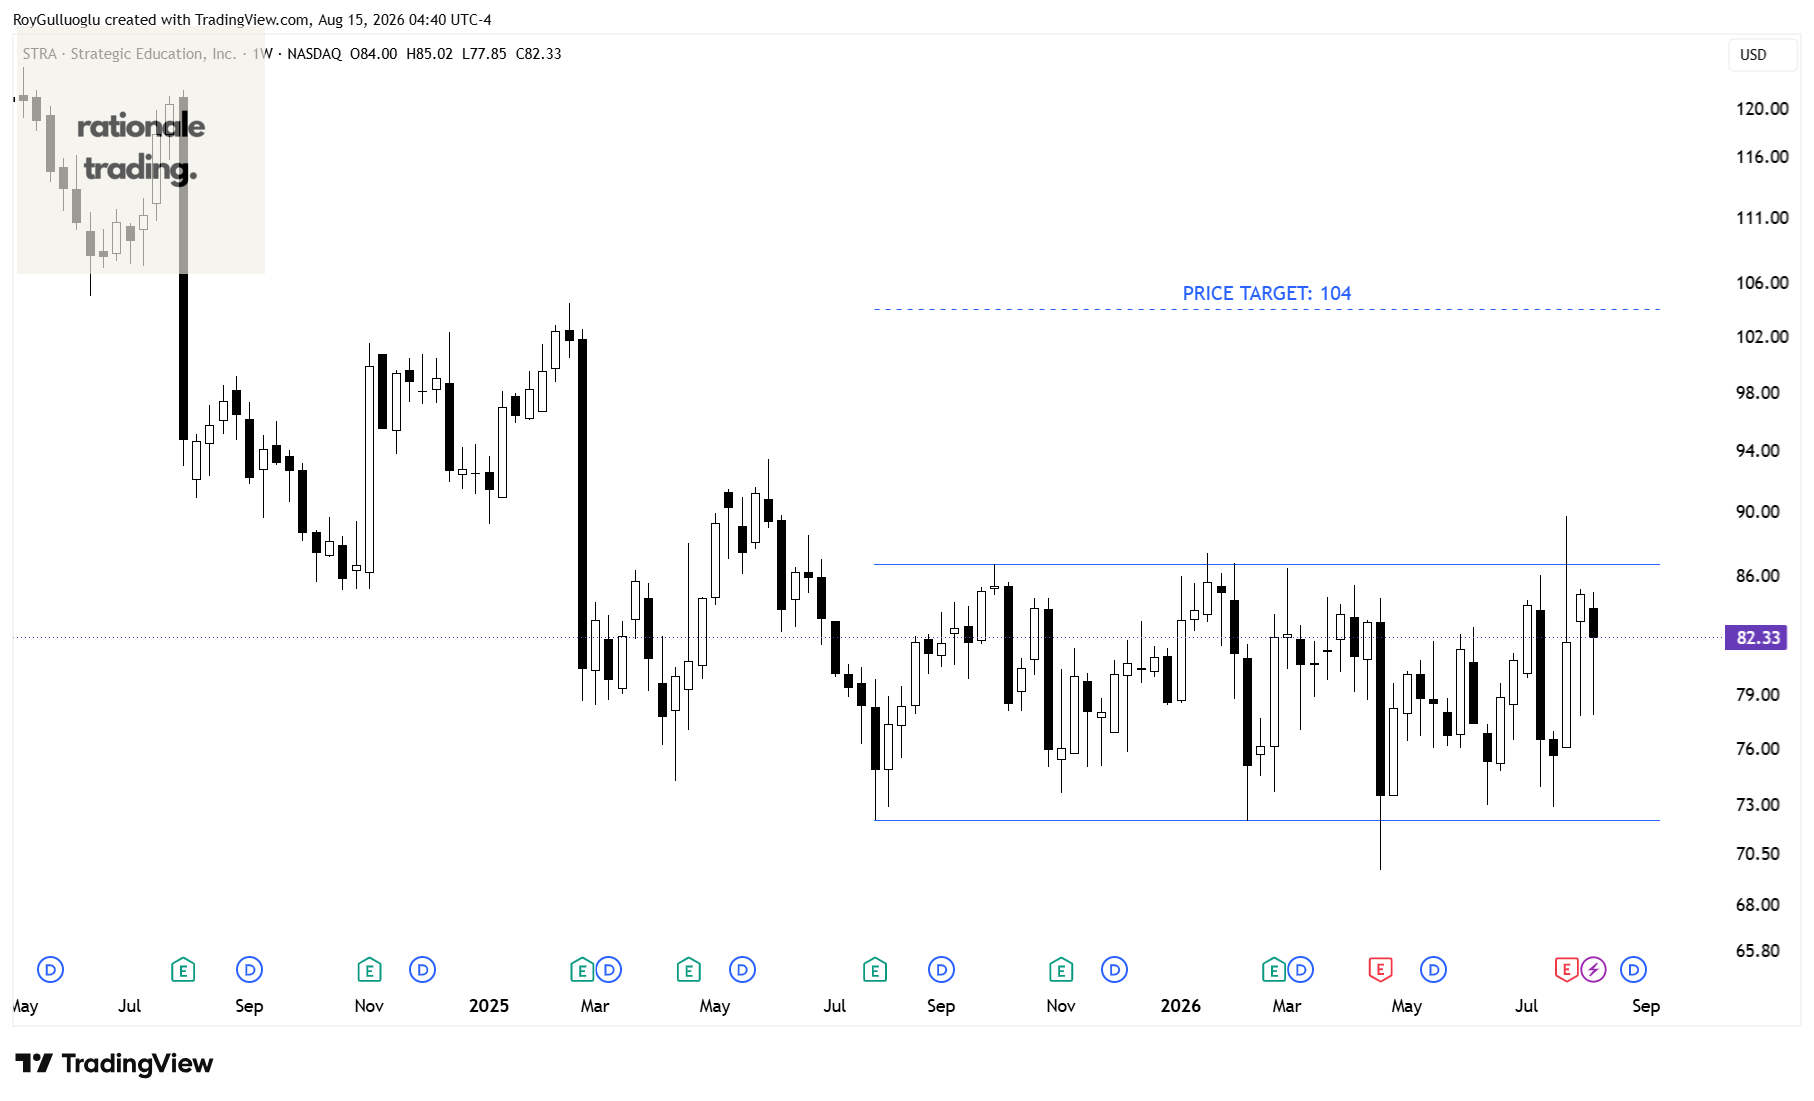
The above weekly chart formed an approximately 13-month-long rectangle chart pattern as a bullish reversal after a downtrend.
Within this pattern, the horizontal boundary at 86.72 levels acts as a resistance.
A daily close above 89.3 levels would validate the breakout from the 13-month-long rectangle chart pattern.
Based on this chart pattern, the potential price target is 104 levels.
SoFi Technologies, Inc.-(SOFI/NASDAQ)-Long Idea
SoFi Technologies, Inc. provides various financial services in the United States, Latin America, Canada, and Hong Kong.
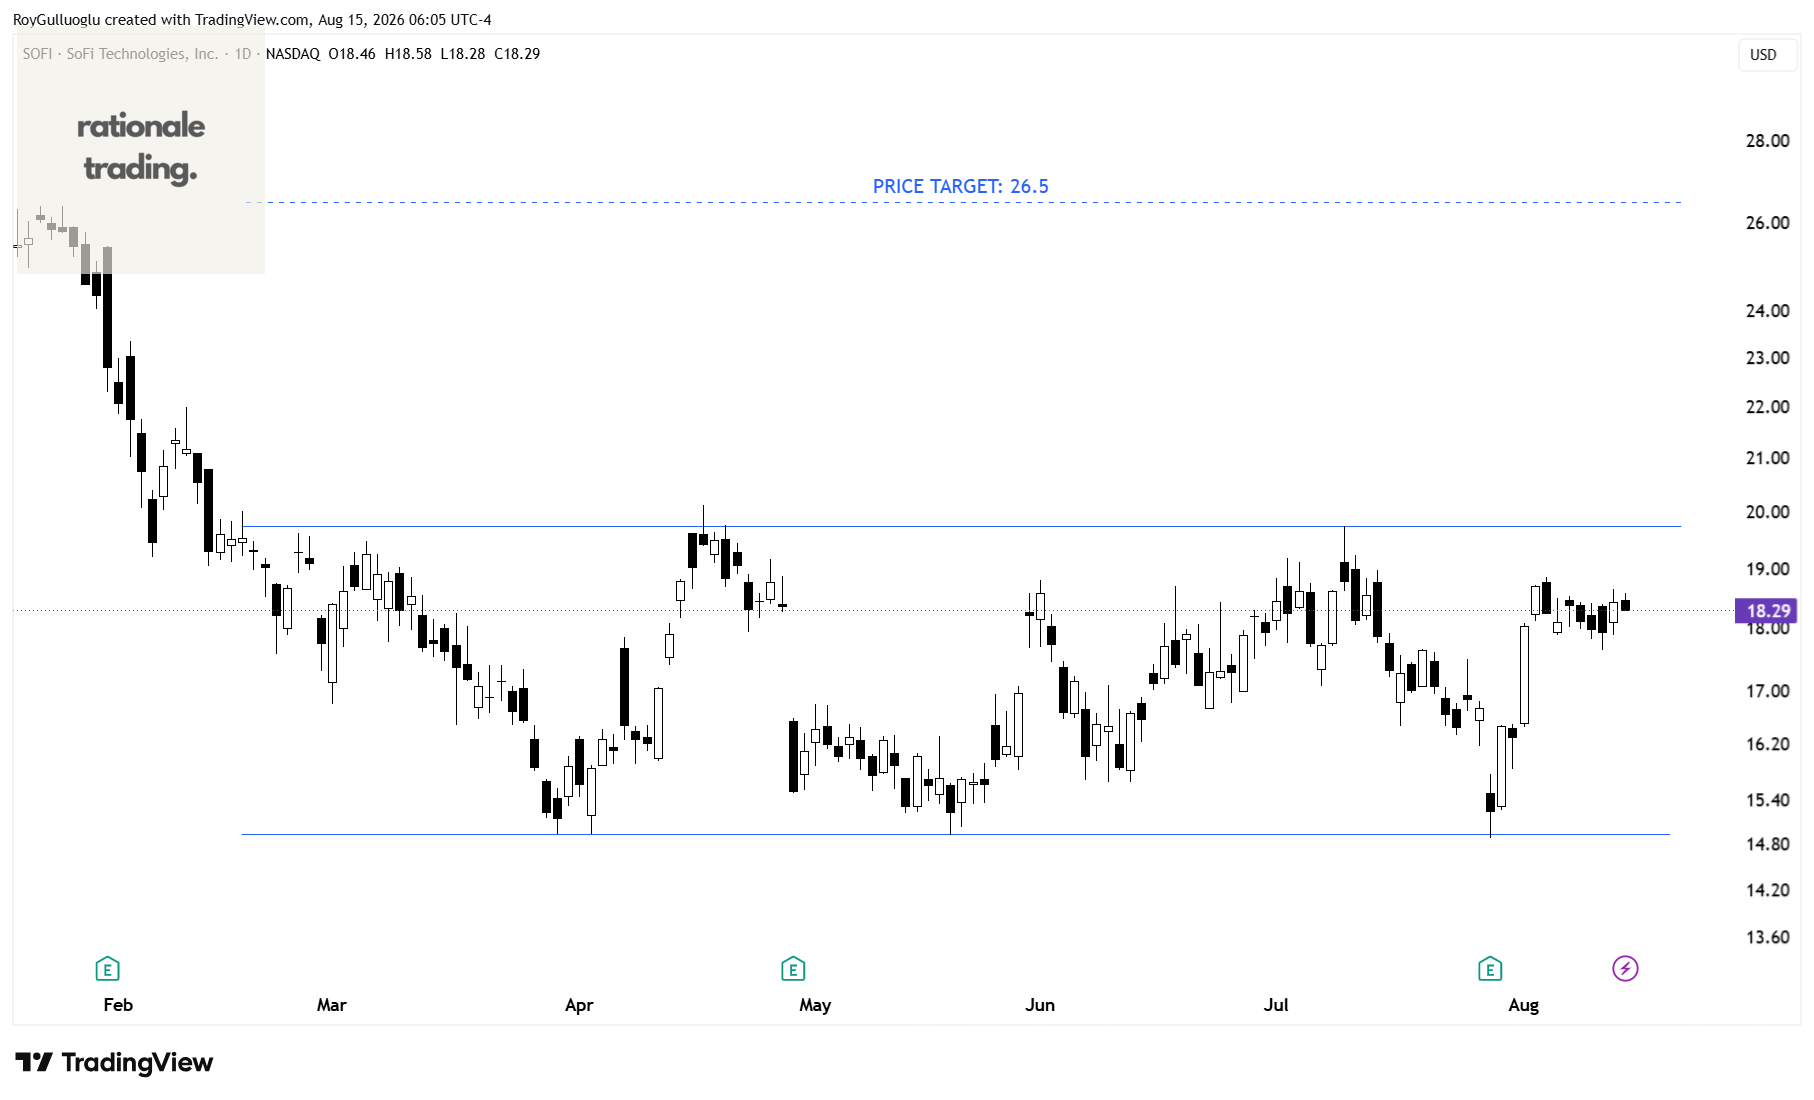
The above daily chart formed an approximately 4-month-long rectangle chart pattern as a bullish reversal after a downtrend.
Within this pattern, the horizontal boundary at 19.74 levels acts as a resistance.
A daily close above 20.33 levels would validate the breakout from the 4-month-long rectangle chart pattern.
Based on this chart pattern, the potential price target is 26.5 levels.
Chevron Corporation-(CVX/NYSE)-Long Idea
Chevron Corporation, through its subsidiaries, engages in the integrated energy and chemicals operations in the United States and internationally.
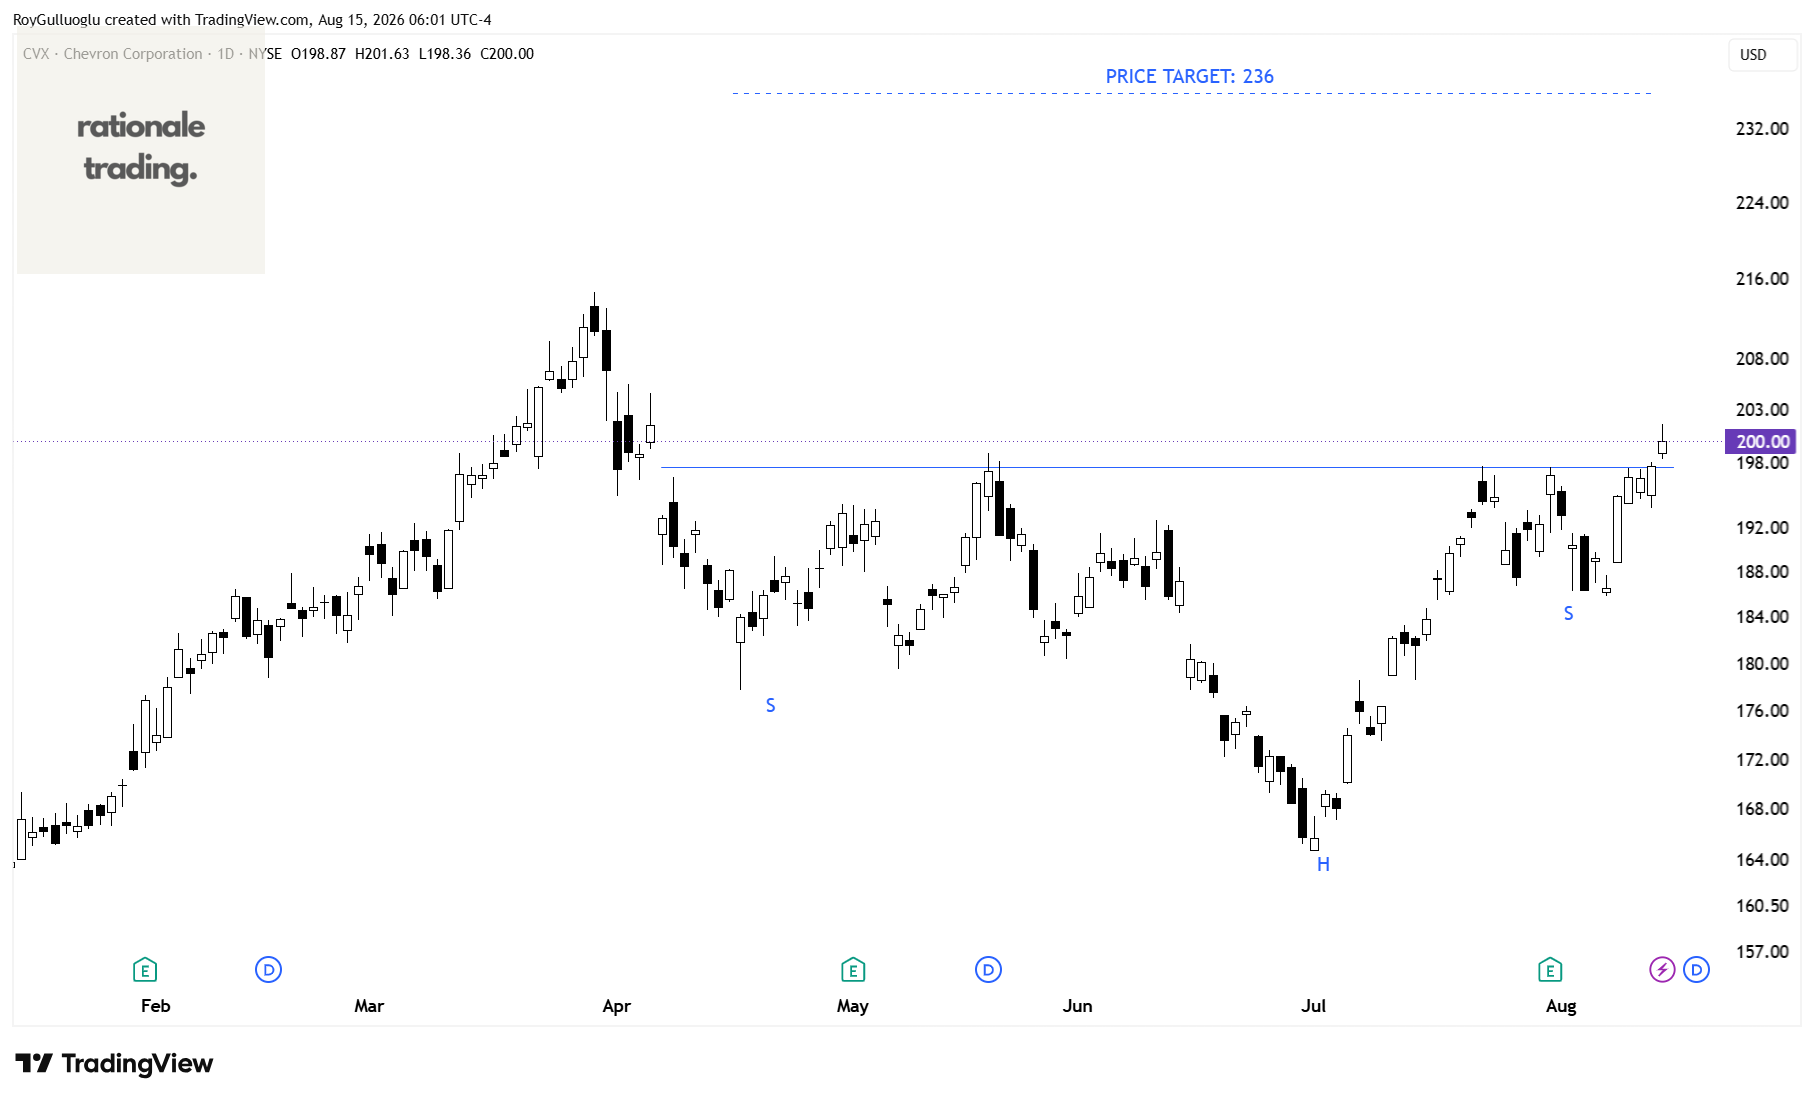
The above daily chart formed an approximately 3-month-long H&S bottom chart pattern as a bullish reversal after a downtrend.
Within this pattern, the horizontal boundary at 197.6 levels acts as a resistance.
A daily close above 203.5 levels would validate the breakout from the 3-month-long H&S bottom chart pattern.
Based on this chart pattern, the potential price target is 236 levels.
Gilead Sciences, Inc.-(GILD/NASDAQ)-Long Idea
Gilead Sciences, Inc., a biopharmaceutical company, discovers, develops, and commercializes medicines in the areas of unmet medical need in the United States, Europe, and internationally.
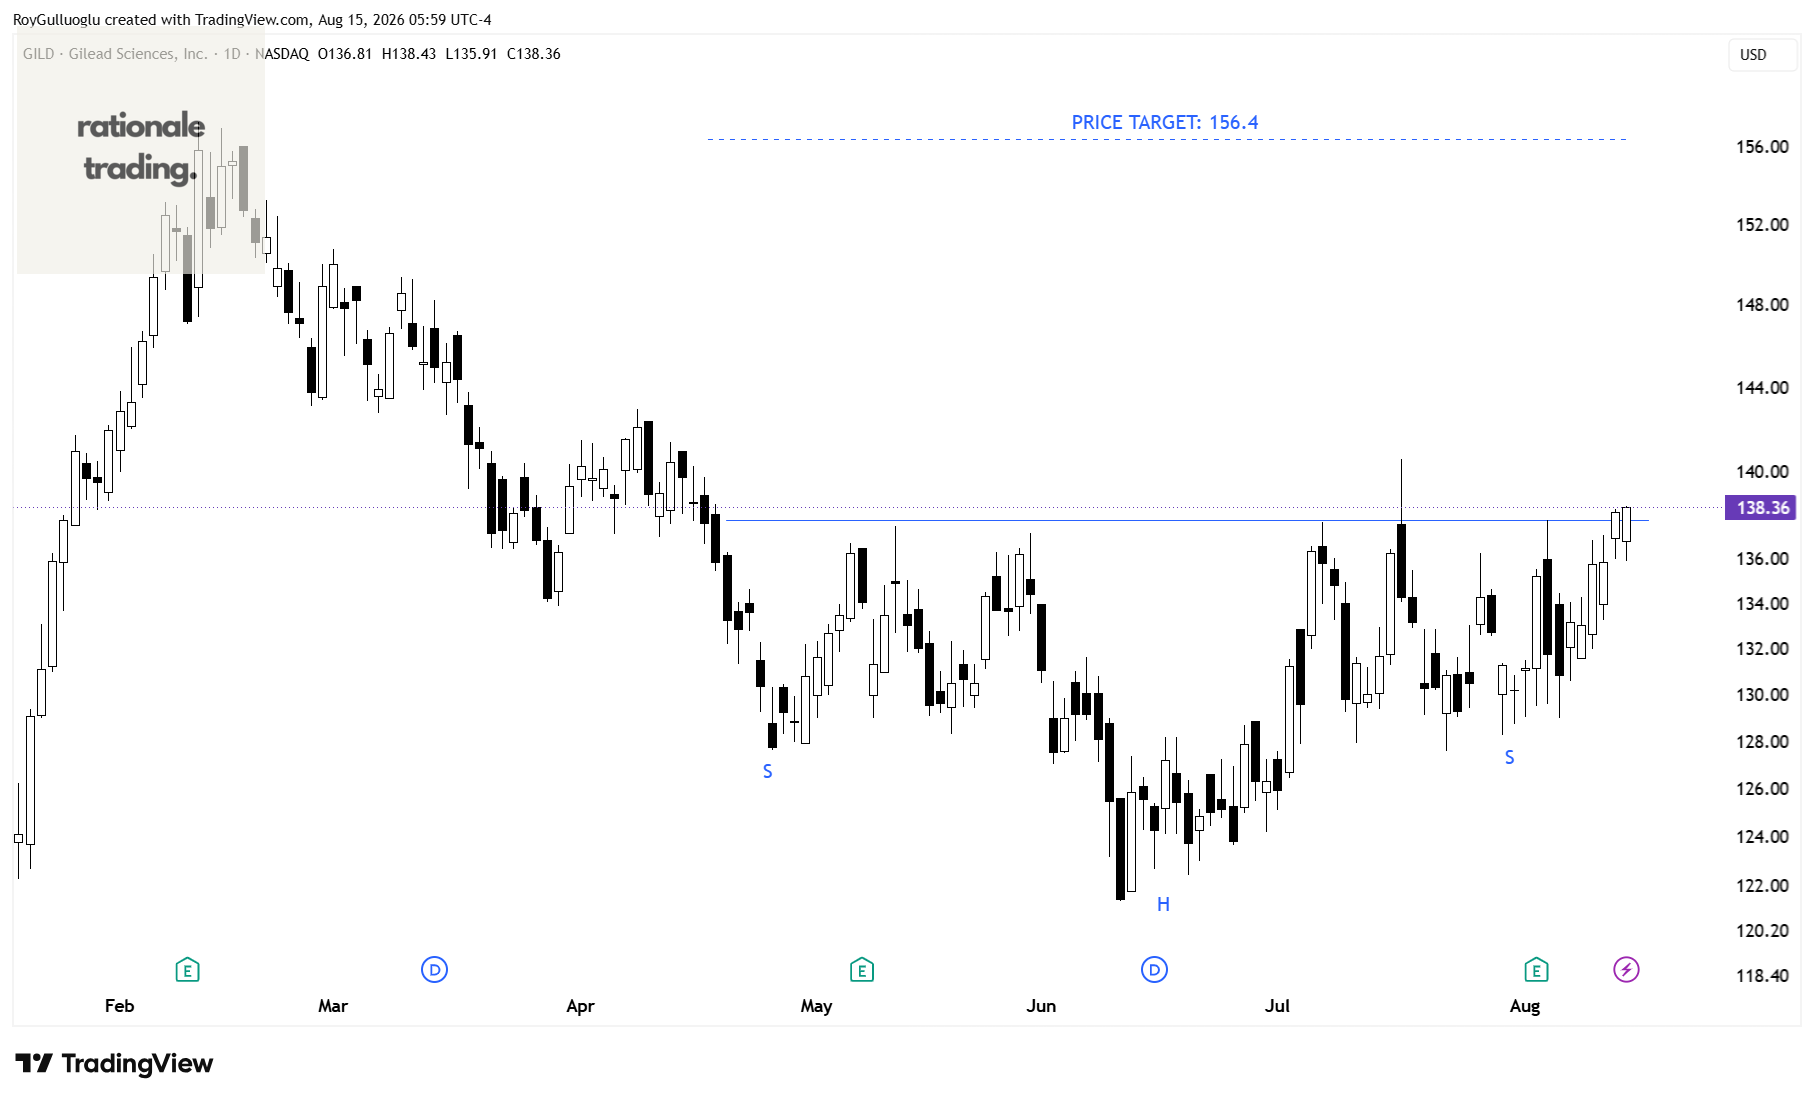
The above daily chart formed an approximately 3-month-long H&S bottom chart pattern as a bullish reversal after a downtrend.
Within this pattern, the horizontal boundary at 137.8 levels acts as a resistance.
A daily close above 141.9 levels would validate the breakout from the 3-month-long H&S bottom chart pattern.
Based on this chart pattern, the potential price target is 156.4 levels.
Darling Ingredients Inc.-(DAR/NYSE)-Long Idea
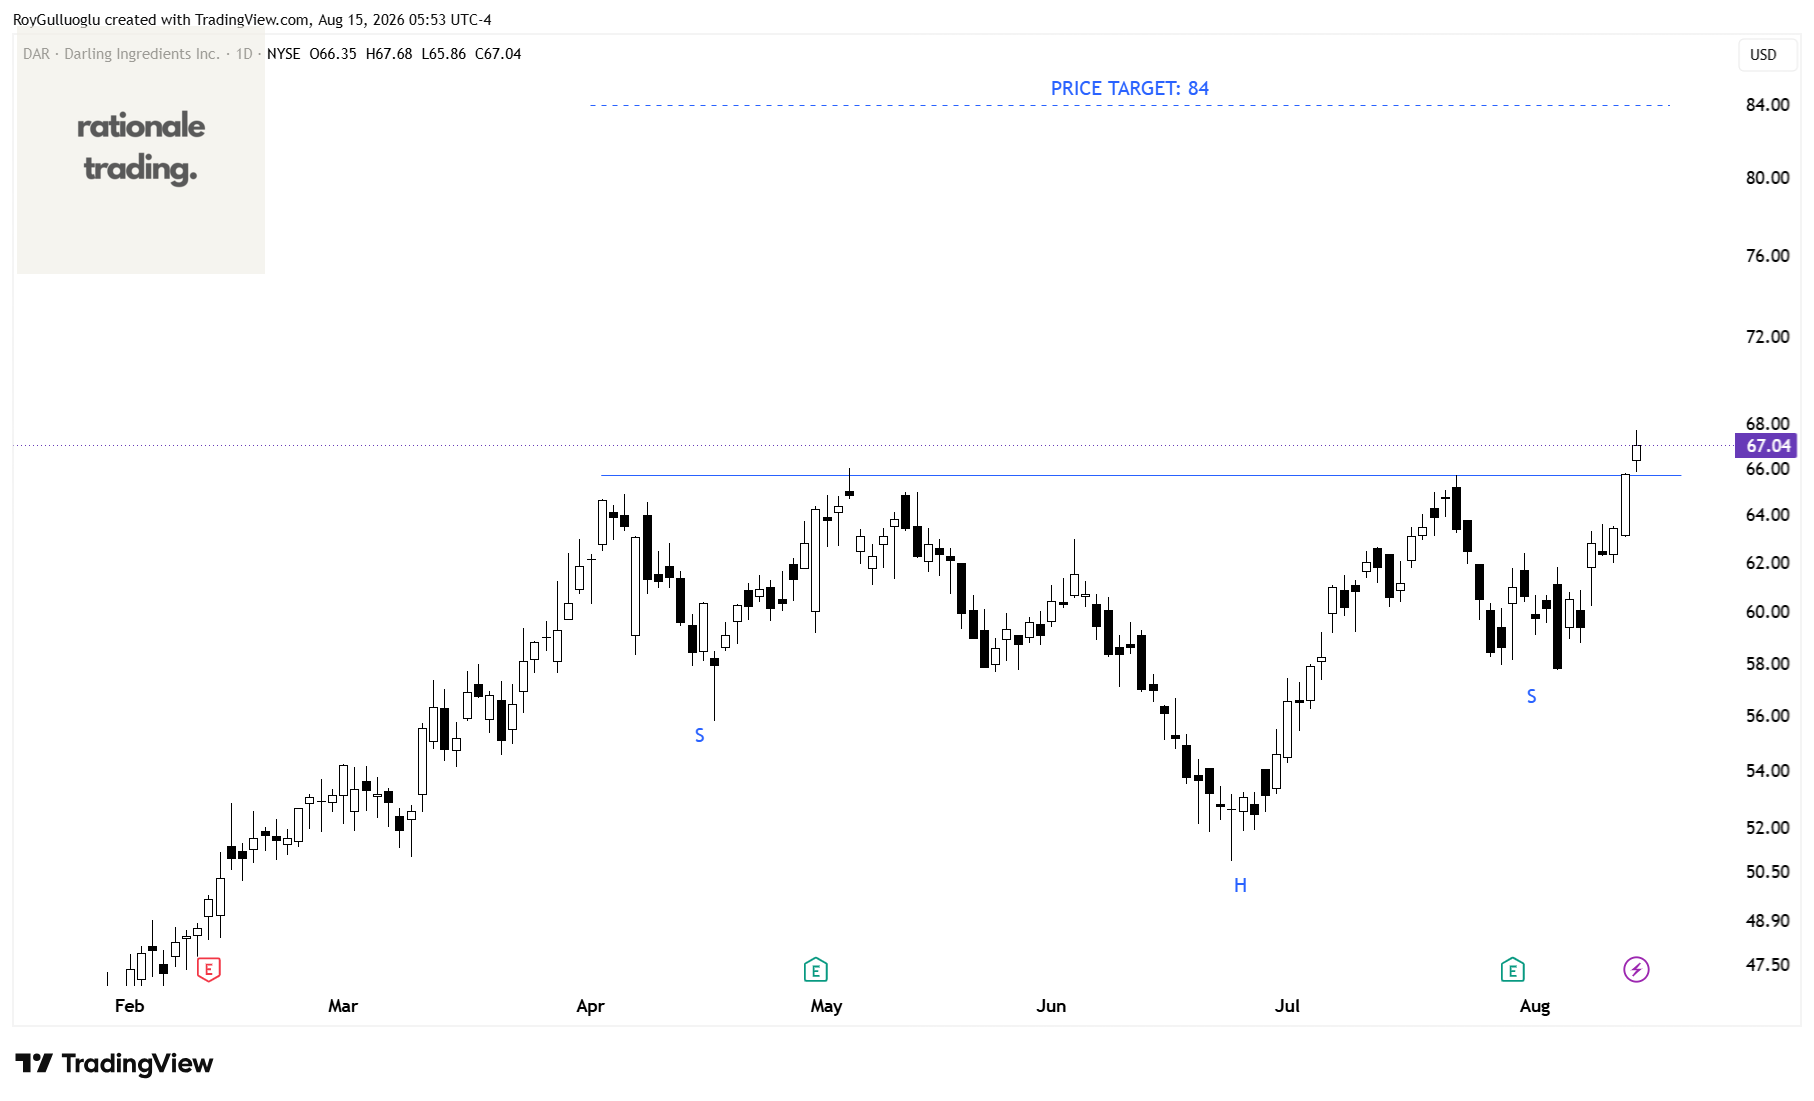
Darling Ingredients Inc. develops, produces, and sells sustainable natural ingredients from edible and inedible bio-nutrients in North America, Europe, China, South America, and internationally.
The above daily chart formed an approximately 3-month-long H&S continuation chart pattern.
Within this pattern, the horizontal boundary at 65.69 levels acts as a resistance.
A daily close above 67.66 levels would validate the breakout from the 3-month-long H&S continuation chart pattern.
Based on this chart pattern, the potential price target is 84 levels.
Great job and a big help. Thanks a lot!!
I ALSO BOUGHT $GILD https://thepriceactionletter.substack.com/p/a-health-care-giant-is-breaking-out?r=75gjt3&utm_campaign=post-expanded-share&utm_medium=post%20viewer