


NVIDIA Corporation-(NVDA/NASDAQ)-Long Idea
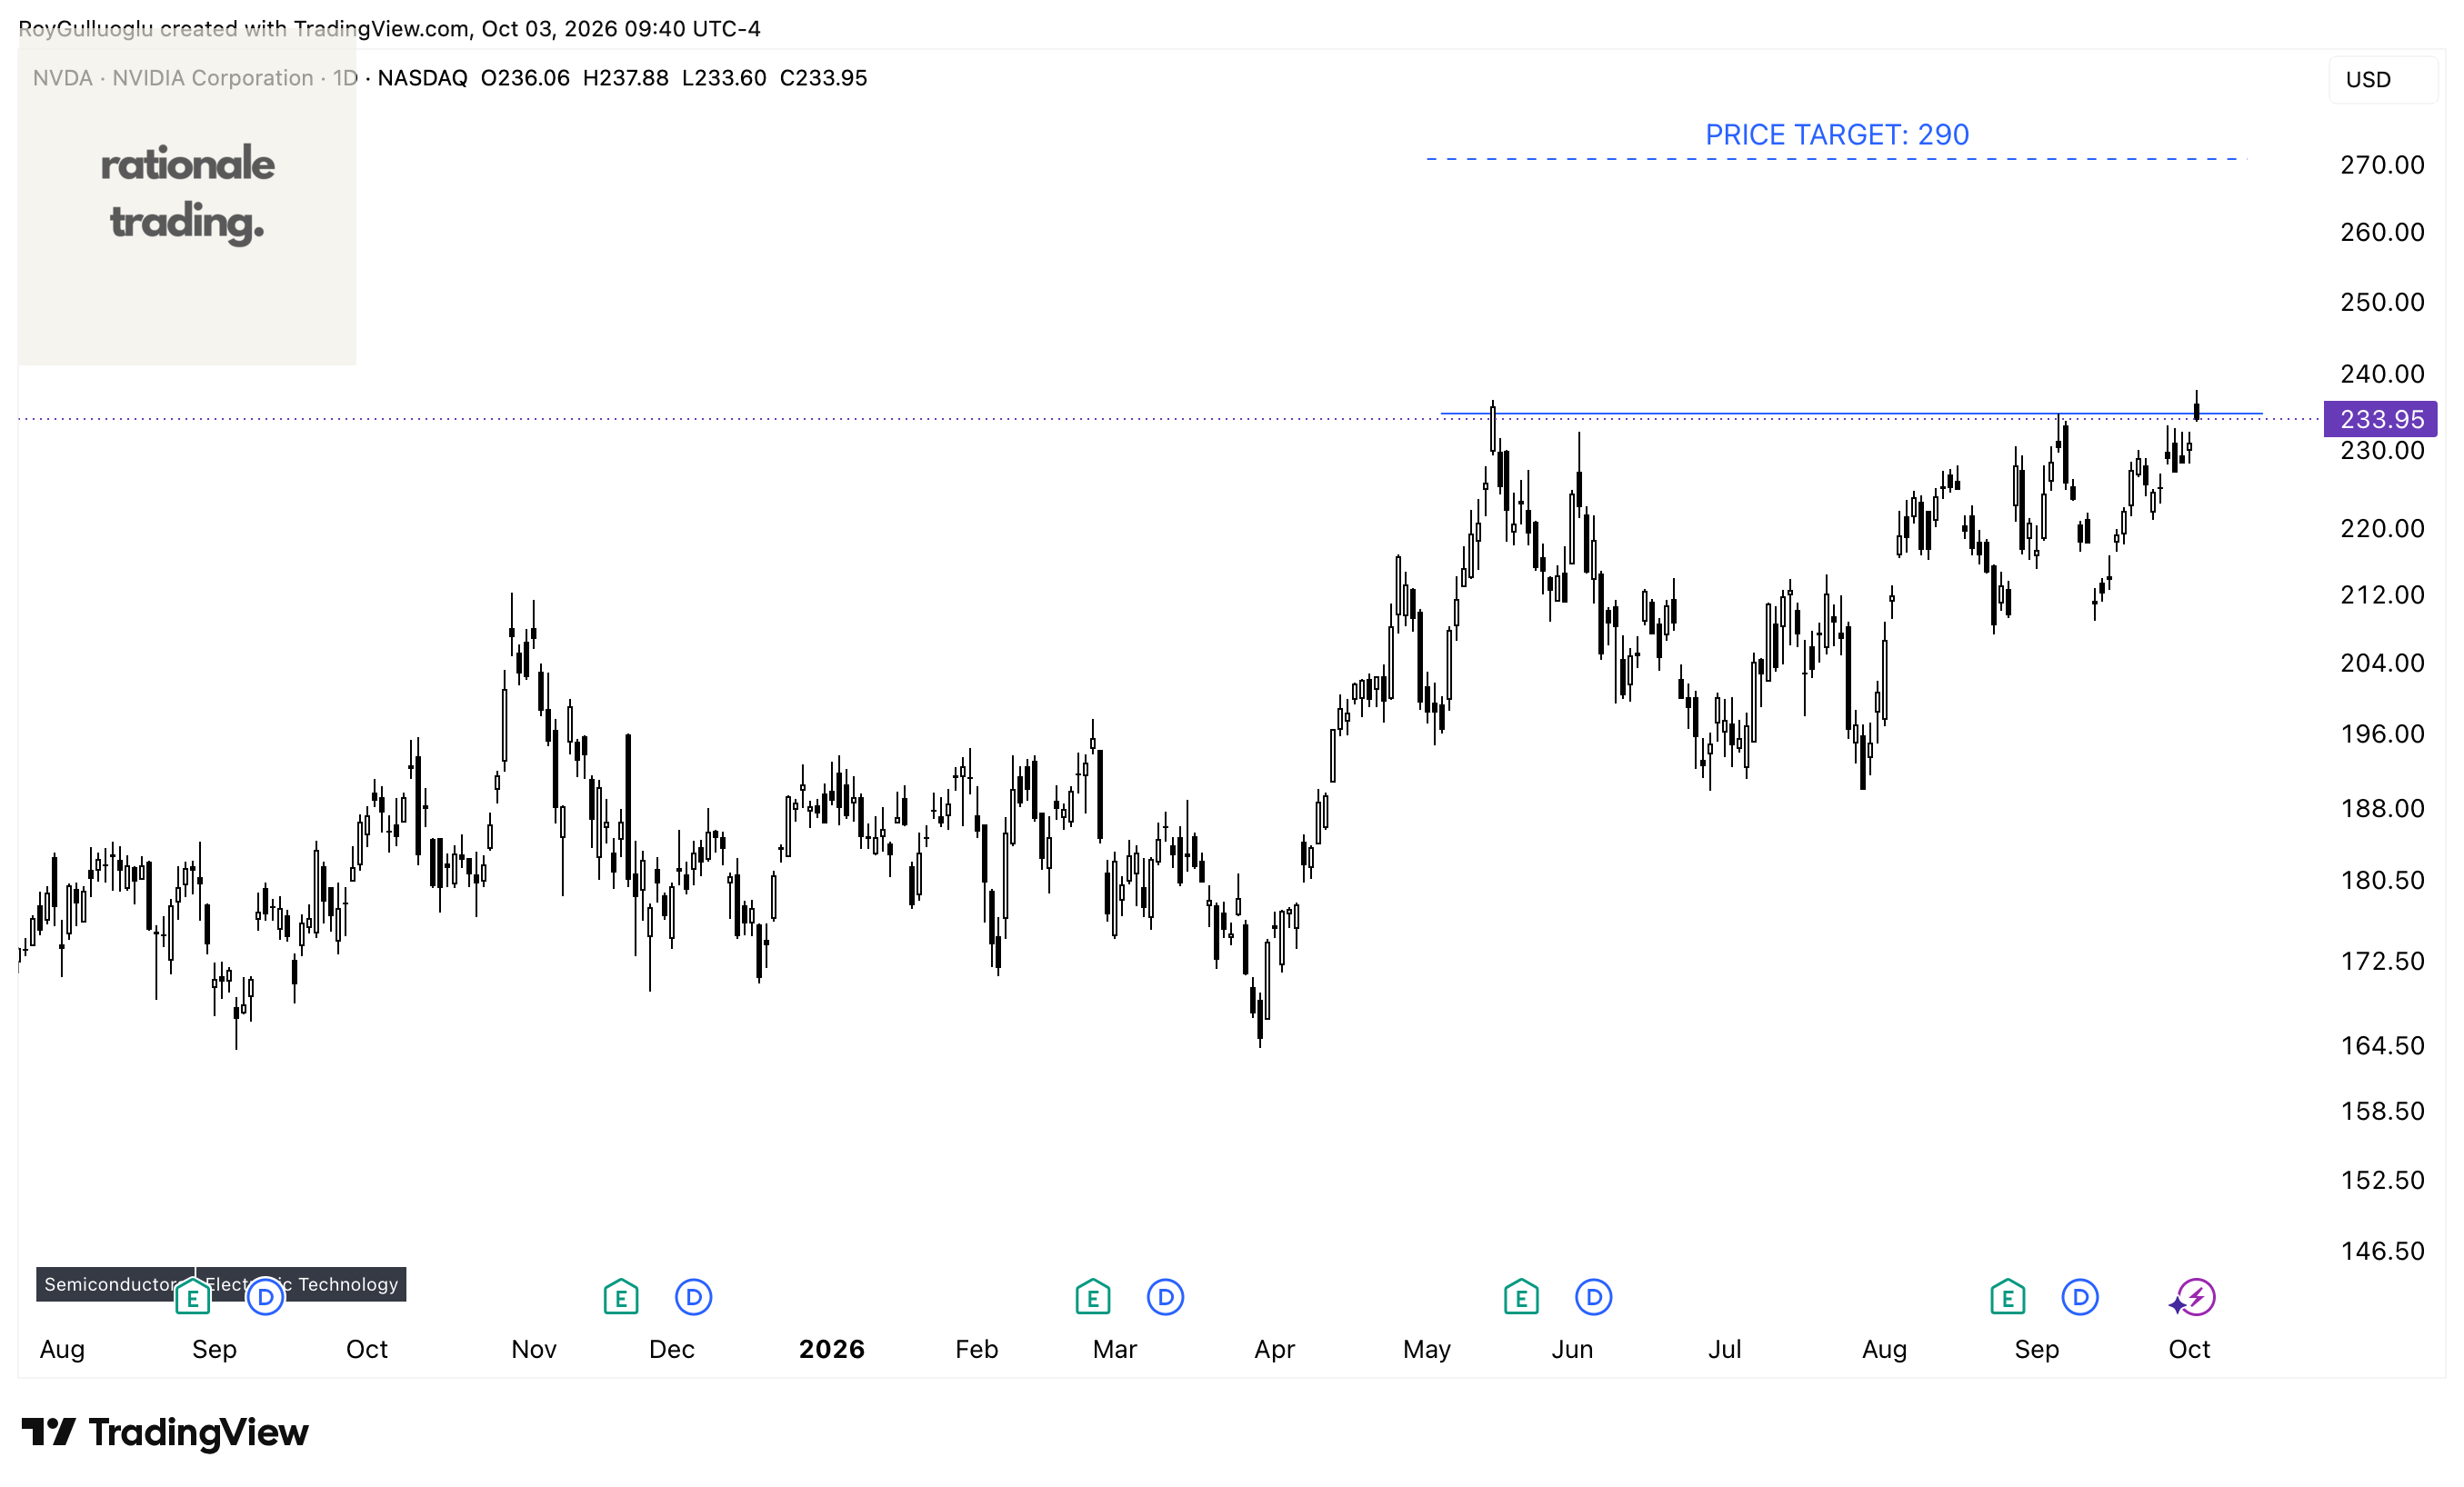
NVIDIA Corporation operates as a data center scale AI infrastructure company in the United States, Taiwan, China, Hong Kong, Europe, and internationally.
The above daily chart formed an approximately 3-month-long cup & handle chart pattern as a bullish continuation after a n uptrend.
Within this pattern, the horizontal boundary at 234.76 levels acts as a resistance.
A daily close above 241.8 levels would validate the breakout from the -month-long cup & handle chart pattern.
Based on this chart pattern, the potential price target is 290 levels.
ImmunityBio, Inc.-(IBRX/NASDAQ)-Long Idea
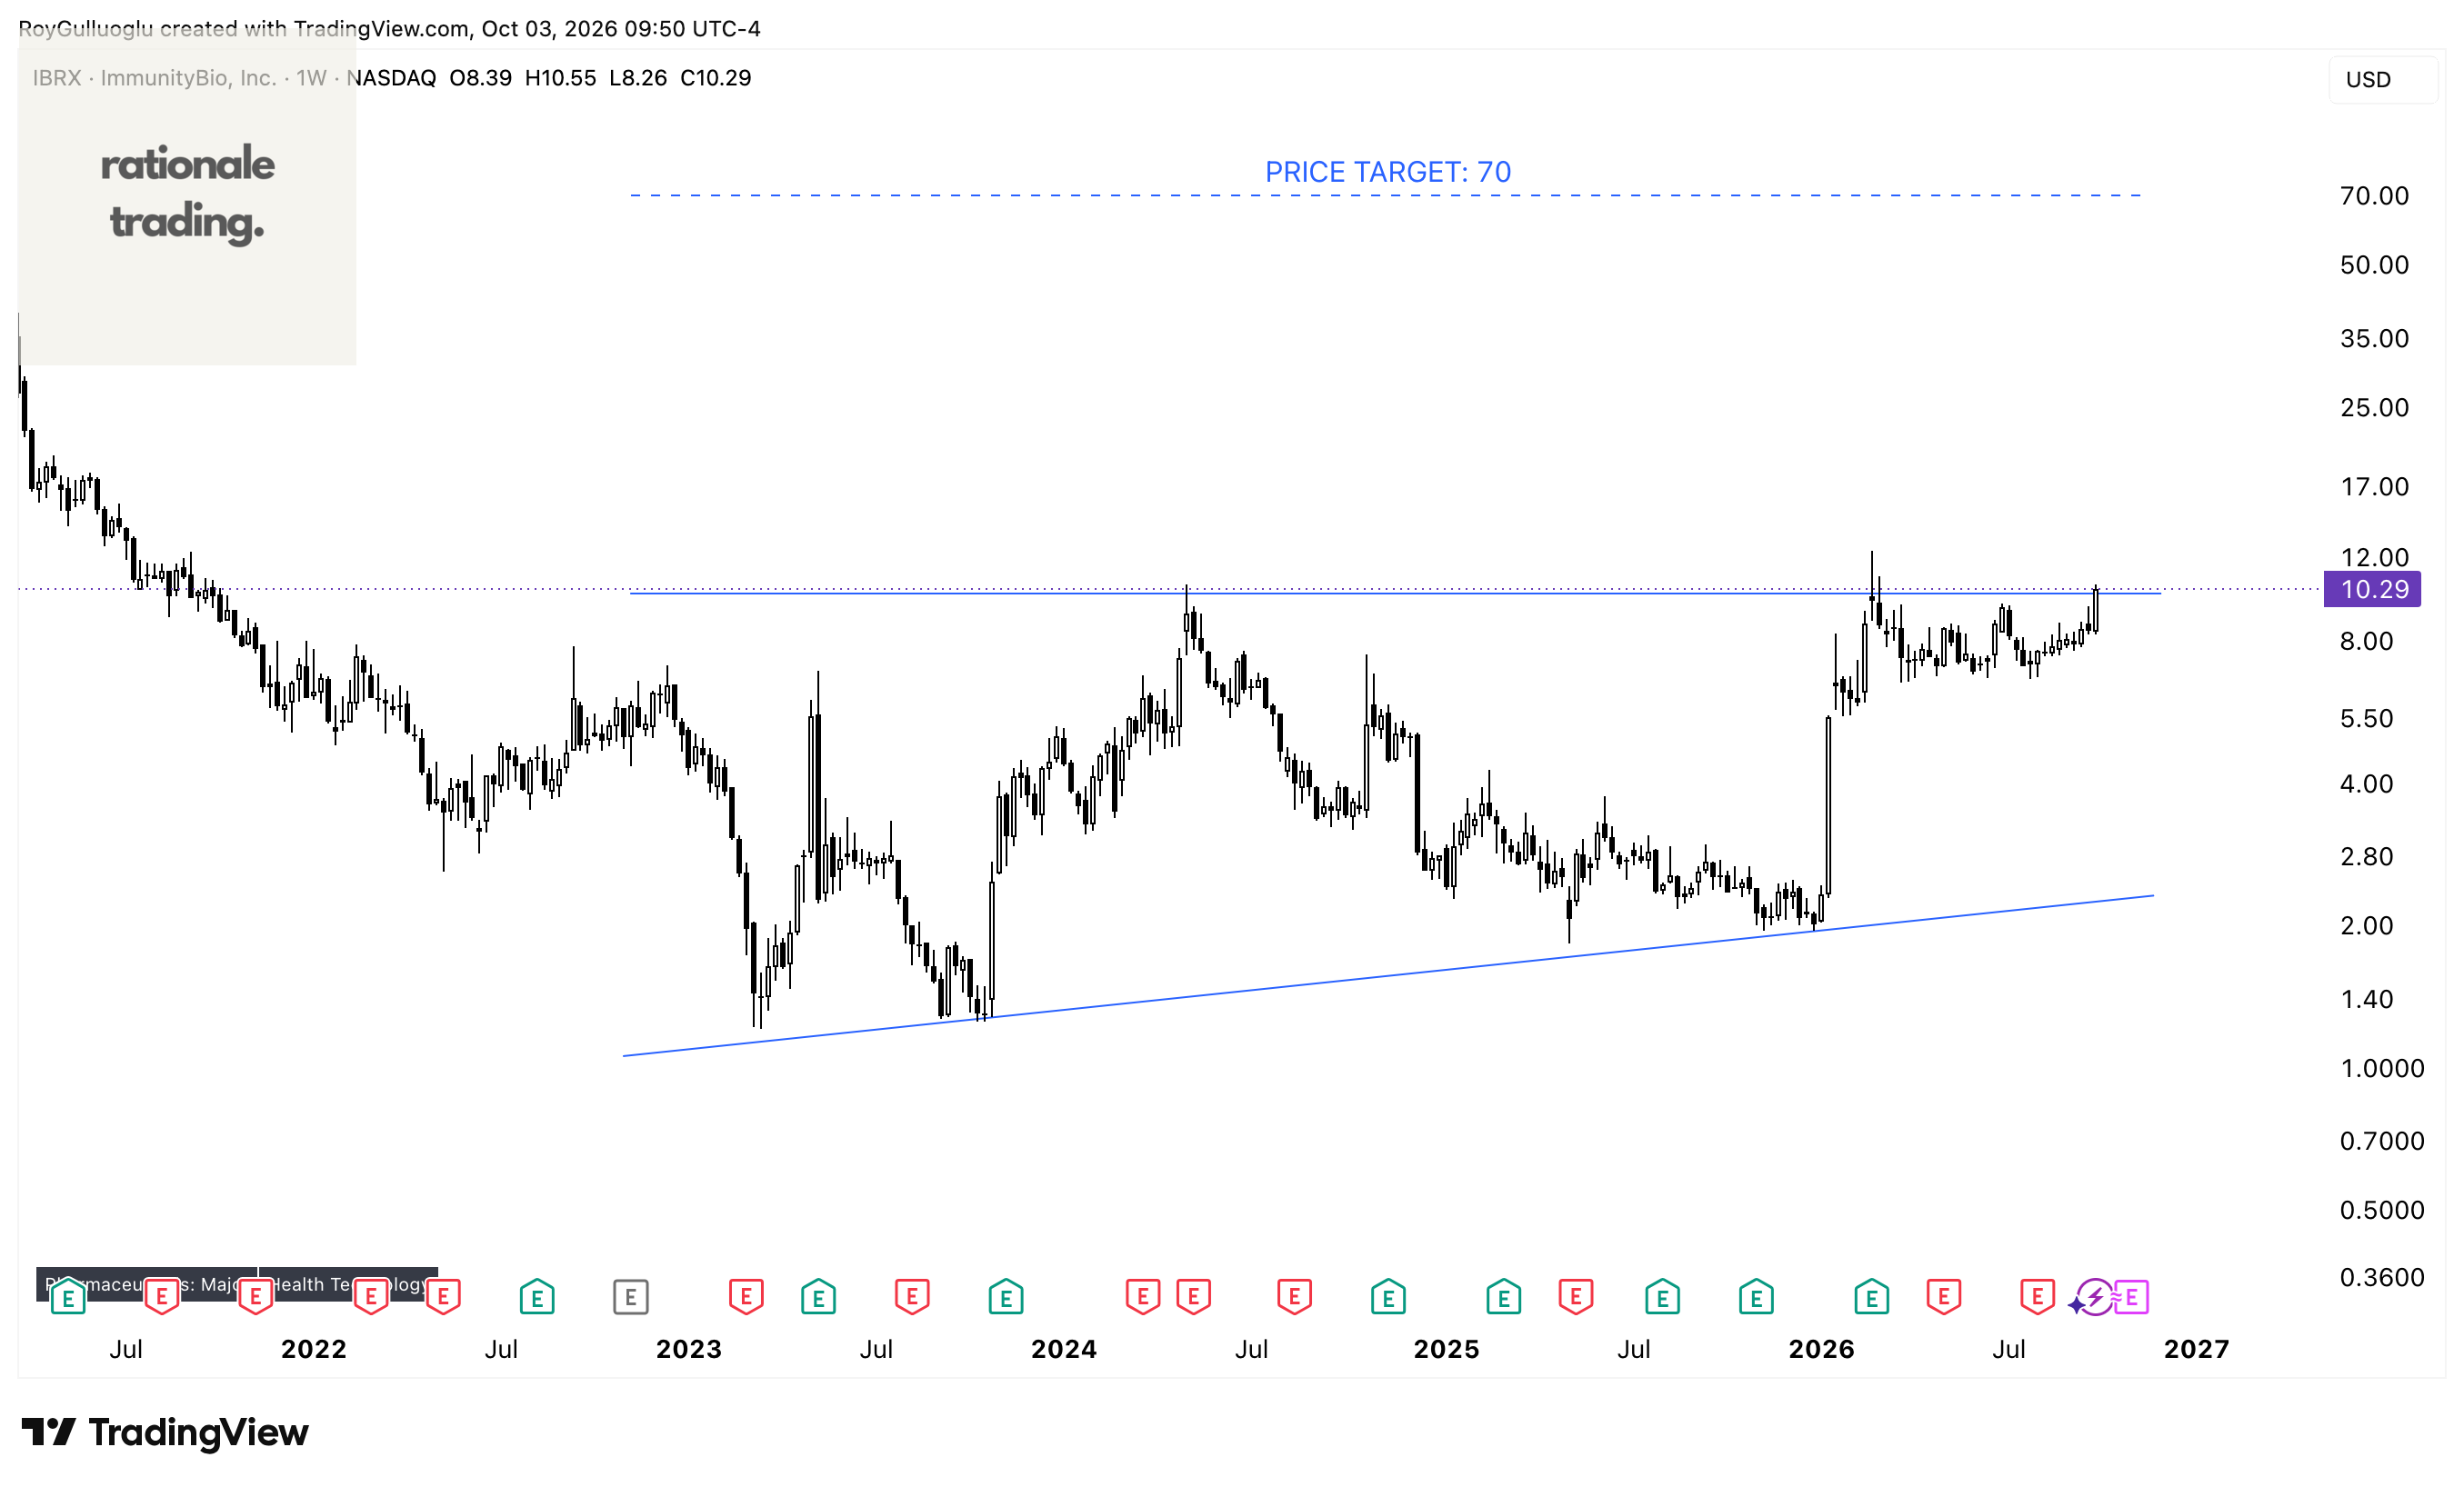
ImmunityBio, Inc., a biotechnology company, focuses on innovating, developing, and commercializing next-generation immunotherapies designed to activate the patient’s immune system and deliver durable protection against cancer and infectious diseases.
The above weekly chart formed an approximately 3-year-long ascending triangle chart pattern as a bullish reversal after a downtrend.
Within this pattern, the horizontal boundary at 10.09 levels acts as a resistance.
A daily close above 10.4 levels would validate the breakout from the 3-year-long ascending triangle chart pattern.
Based on this chart pattern, the potential price target is 70 levels.
Vistra Corp.-(VST/NYSE)-Short Idea
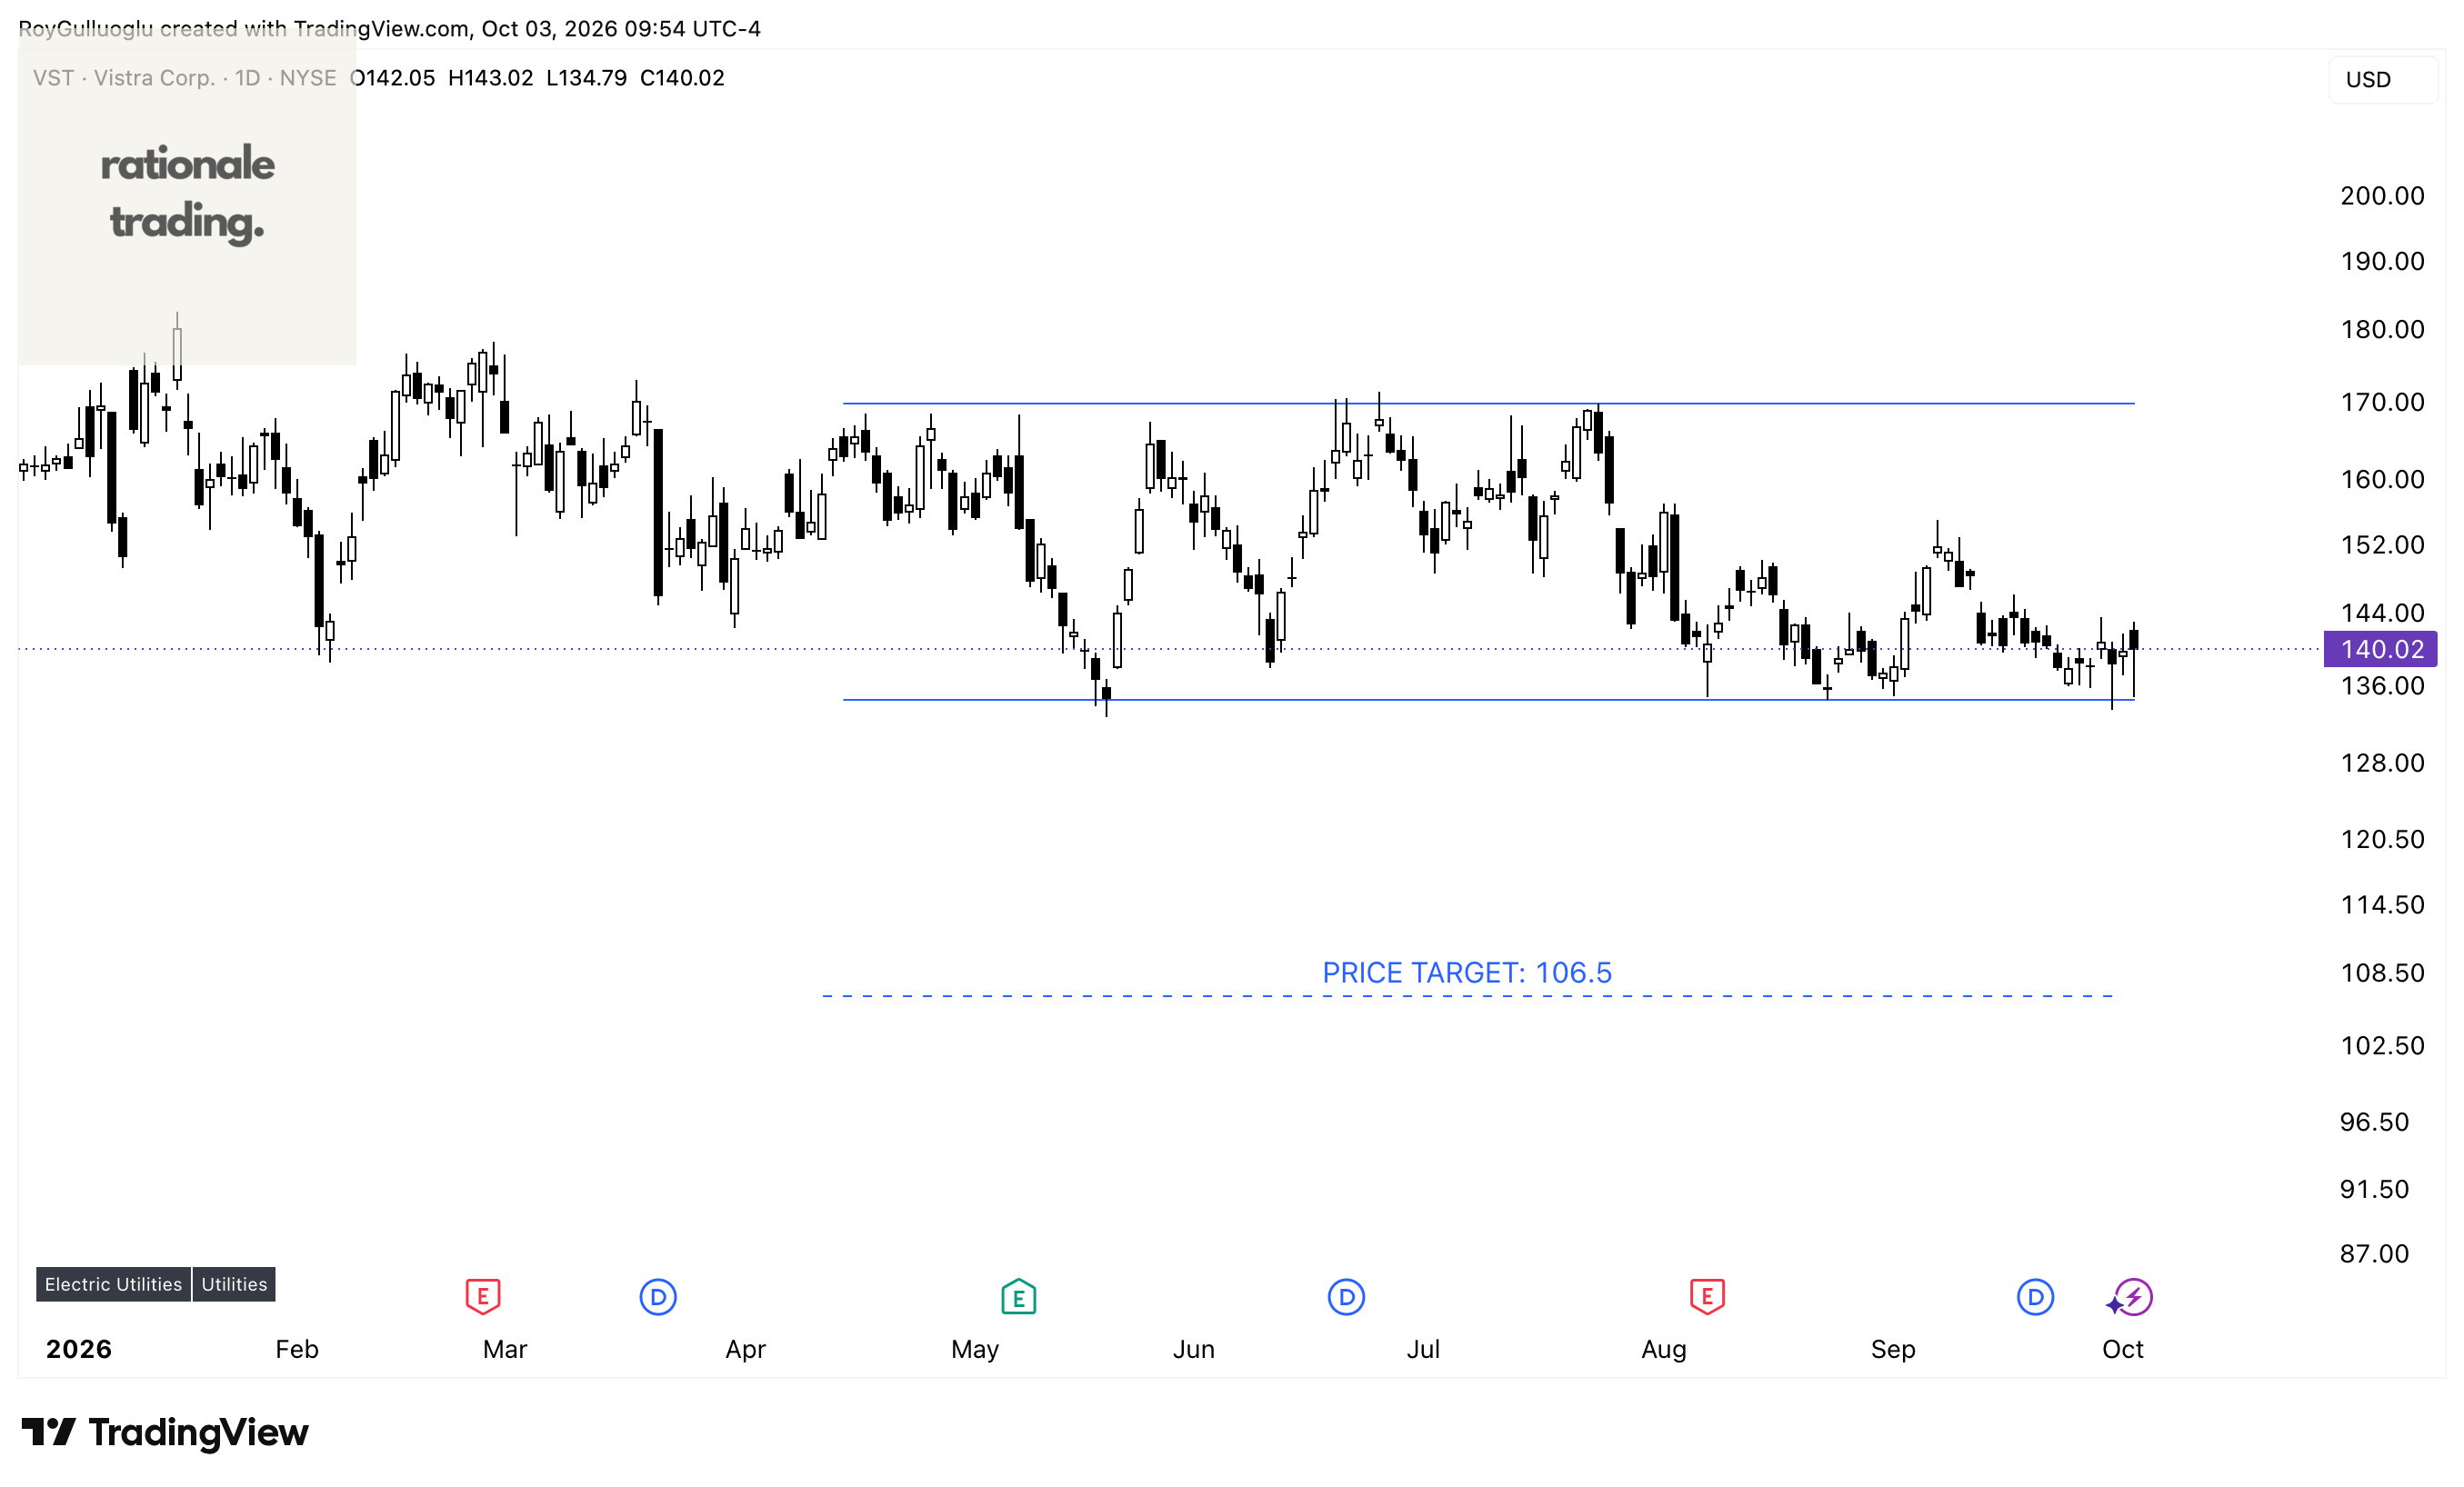
Vistra Corp., together with its subsidiaries, operates as an integrated retail electricity and power generation company in the United States.
The above daily chart formed an approximately 4-month-long rectangle chart pattern as a bearish continuation after a downtrend.
Within this pattern, the horizontal boundary at 134.5 levels acts as a support.
A daily close above 130.5 levels would validate the breakout from the 4-month-long rectangle chart pattern.
Based on this chart pattern, the potential price target is 106.5 levels.
CRISPR Therapeutics AG-(CRSP/NASDAQ)-Long Idea
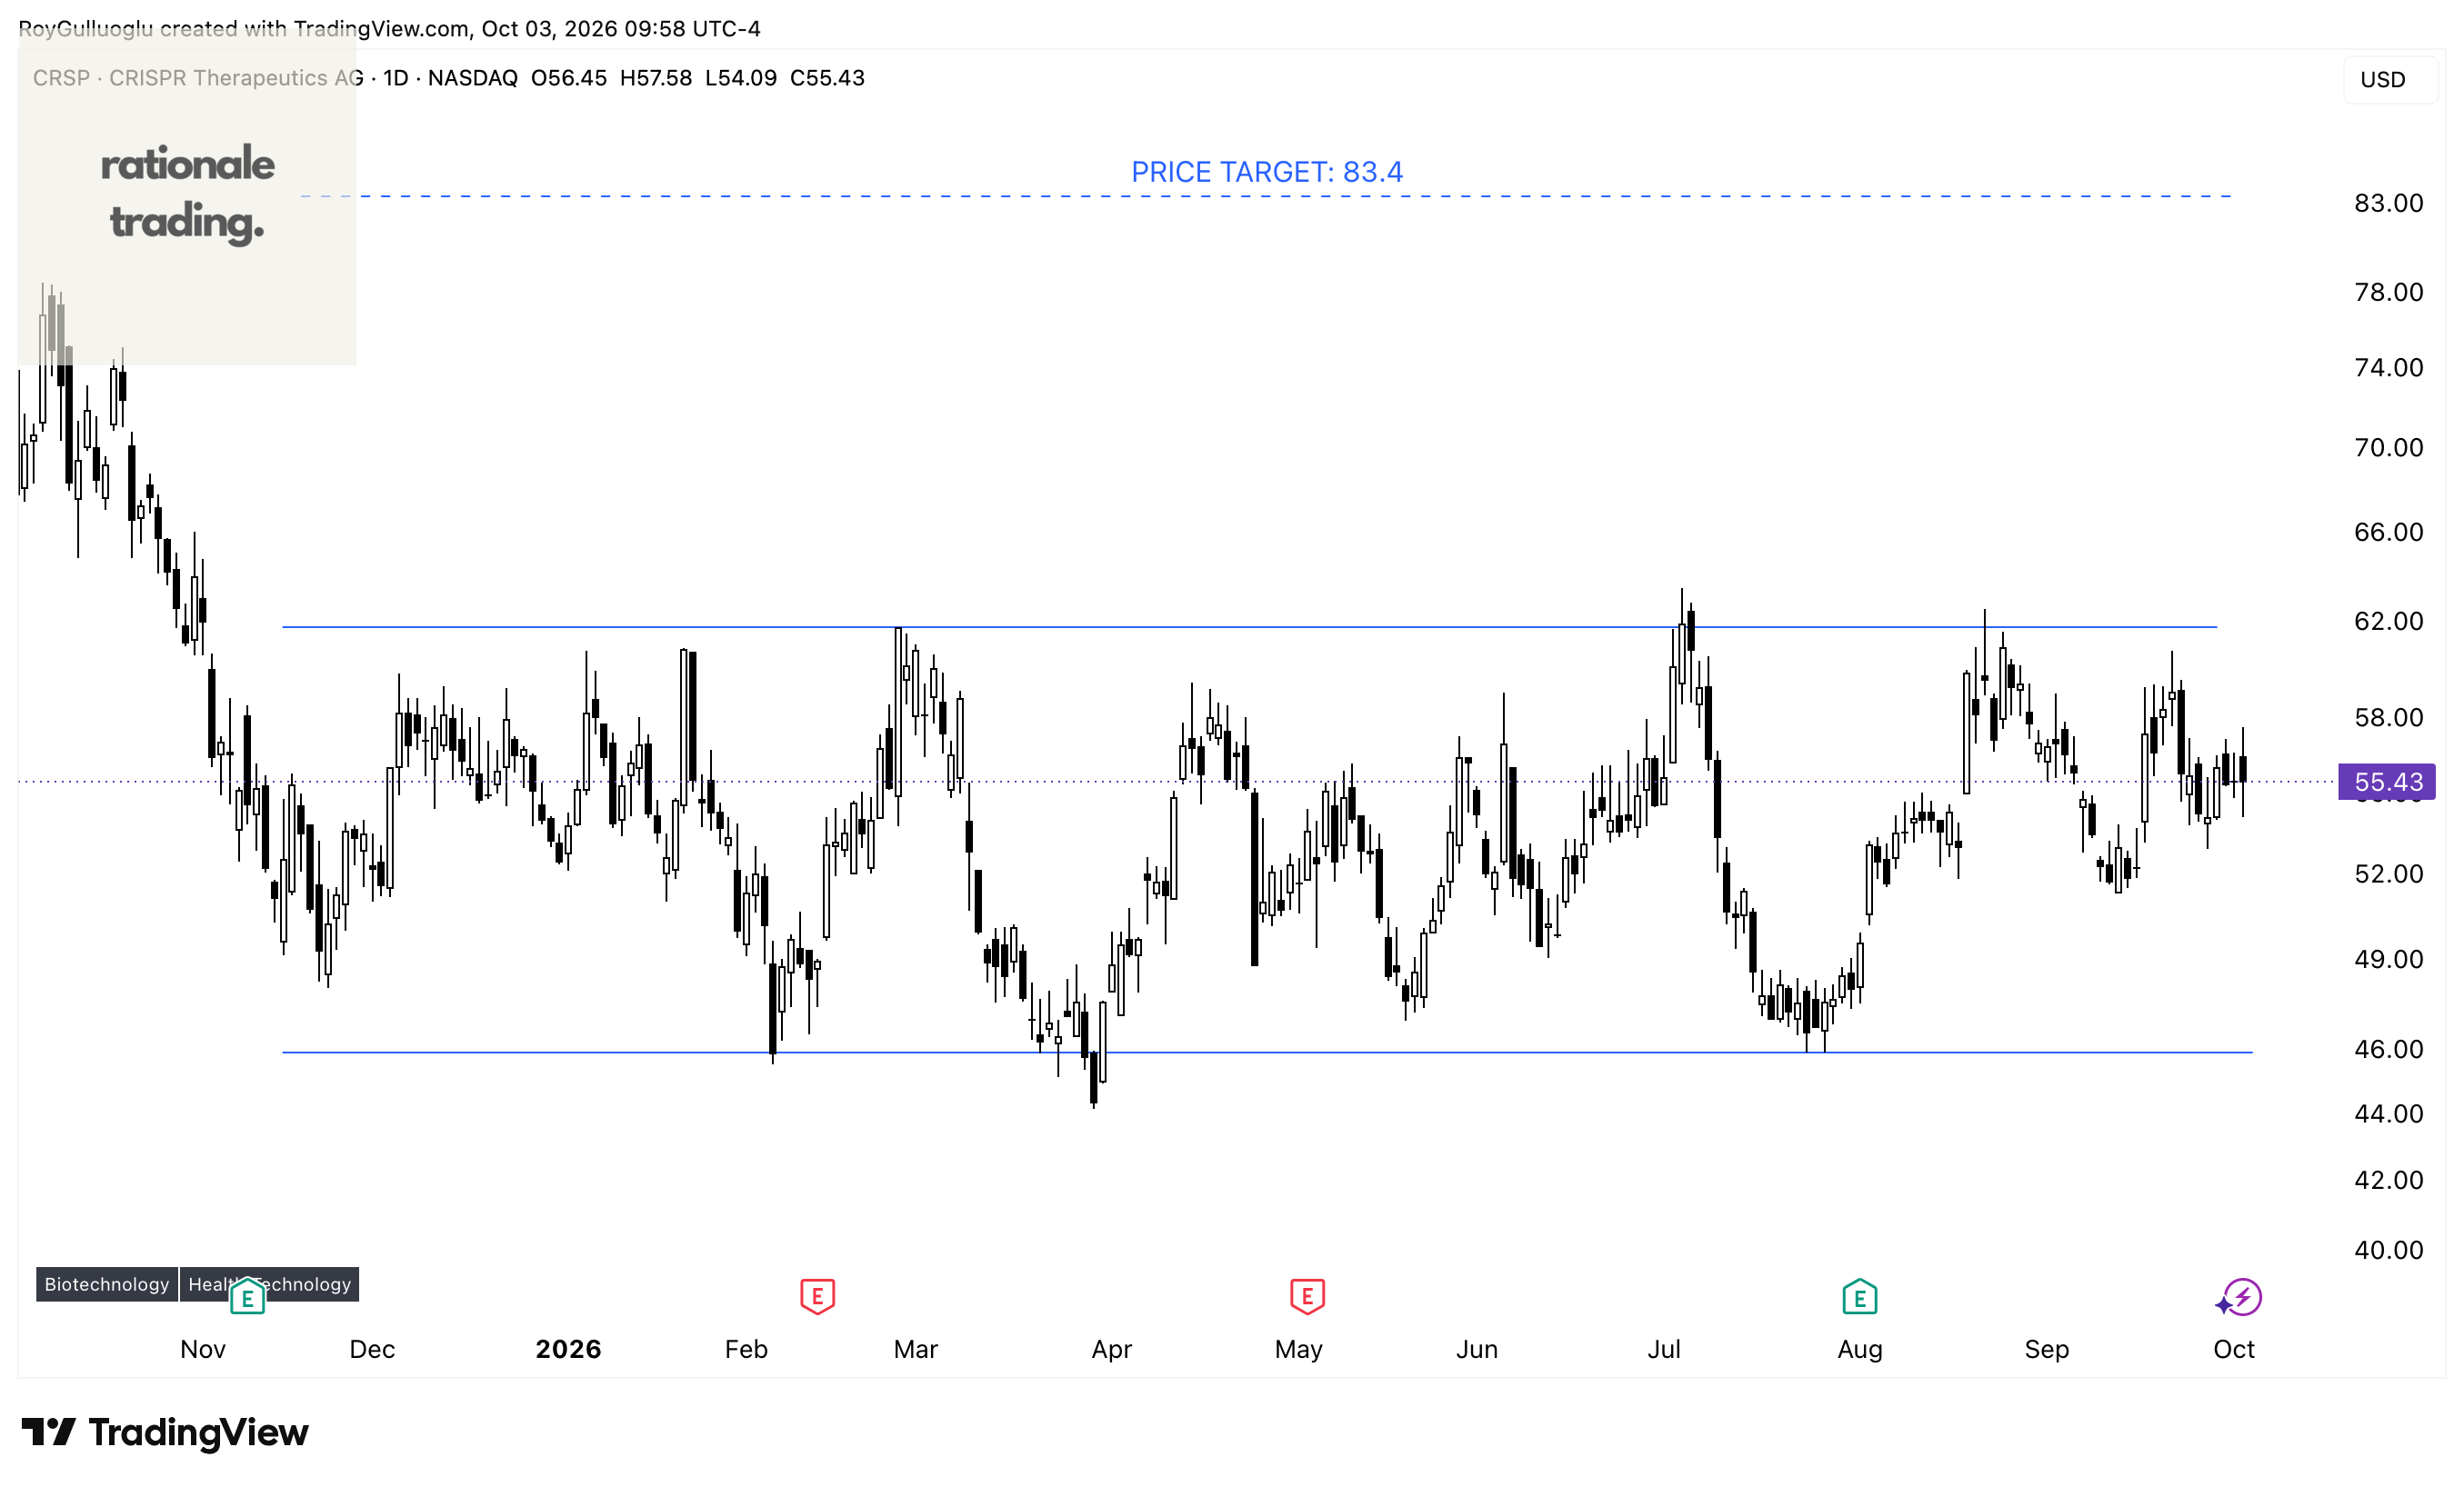
CRISPR Therapeutics AG, a gene editing company, focuses on developing gene-based medicines for serious human diseases using its Clustered Regularly Interspaced Short Palindromic Repeats (CRISPR)/CRISPR-associated protein 9 (Cas9) platform.
The above daily chart formed an approximately 6-month-long rectangle chart pattern as a bullish reversal after a downtrend.
Within this pattern, the horizontal boundary at 61.75 levels acts as a resistance.
A daily close above 63.6 levels would validate the breakout from the 6-month-long rectangle chart pattern.
Based on this chart pattern, the potential price target is 83.4 levels.