


New setups
TICKERS: MYGN(NASDAQ), SLP(NASDAQ), DOW(NYSE), BBW(NYSE), JD(NASDAQ), WEIR(LSE), MKS(LSE), TKFEN(BIST), GWIND(BIST), 600547(SSE), 600809(SSE), POLYMED(NSE), 4568(TSE), 4202(TSE)
Myriad Genetics, Inc.-(MYGN/NASDAQ)-Long Idea
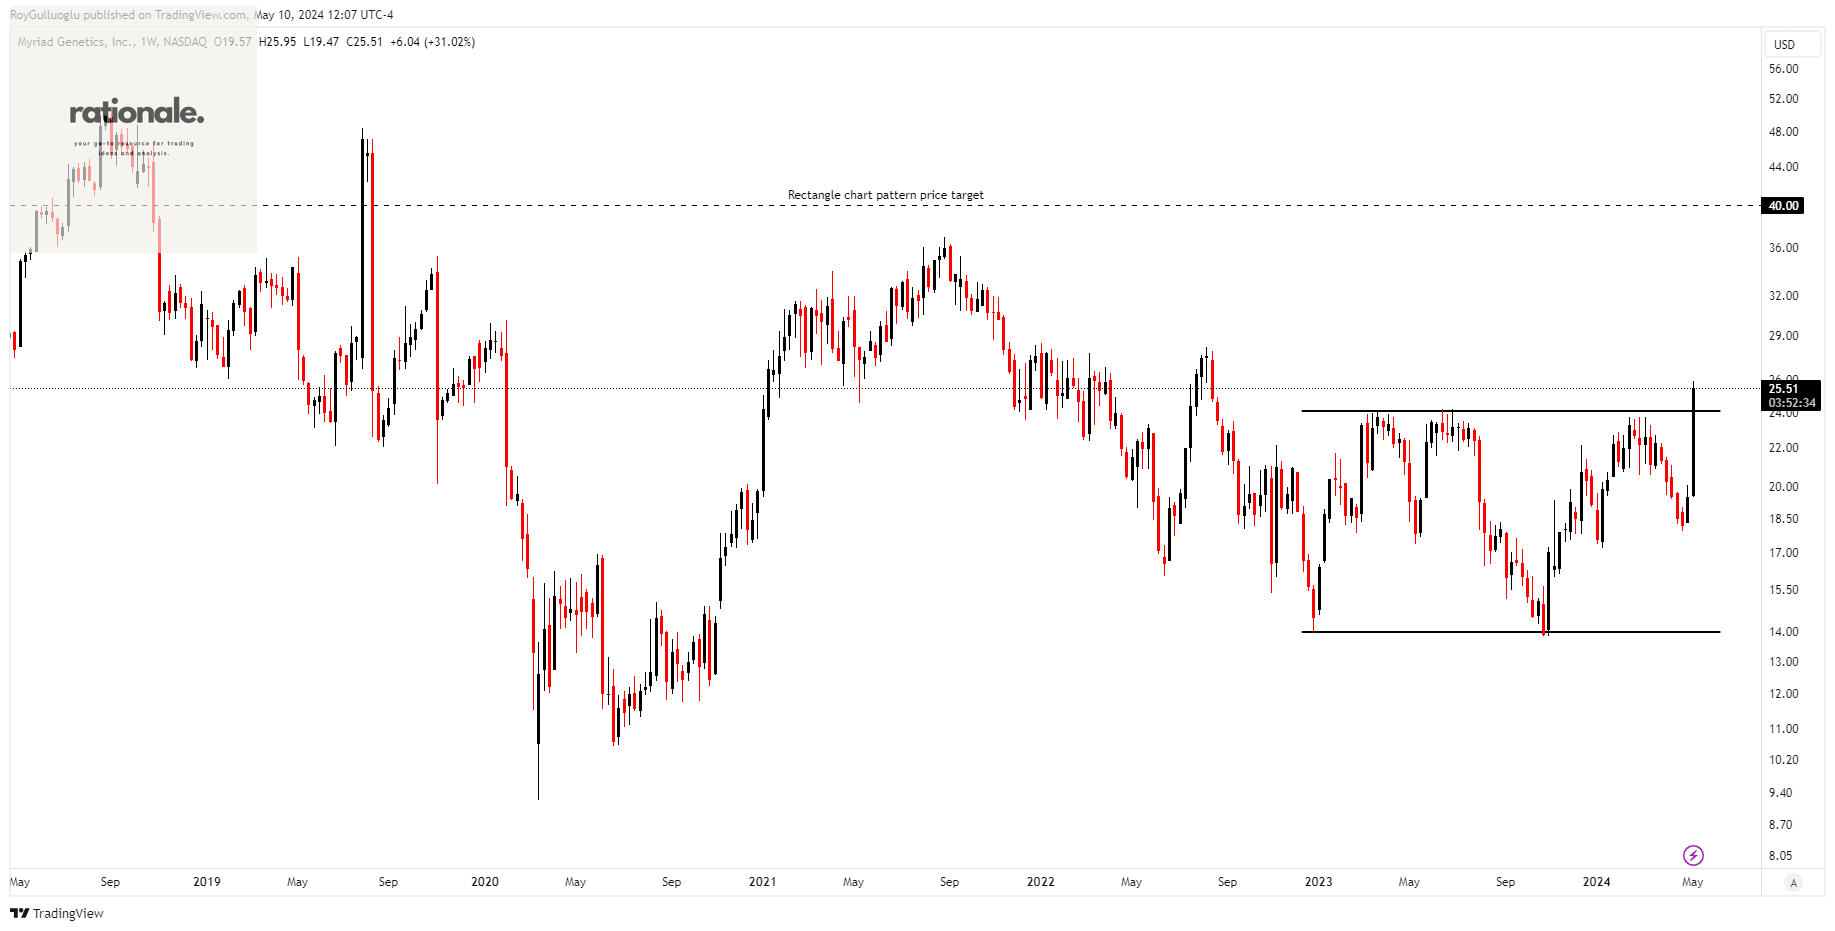
Myriad Genetics, Inc., a company specializing in genetic testing and precision medicine, creates genetic tests for both domestic and international markets. Its portfolio includes molecular diagnostic tests utilized in oncology, women's health, and pharmacogenomics.
The above weekly chart formed an approximately 18-month-long rectangle chart pattern as a bullish reversal after a downtrend.
The horizontal boundary at 24 levels acted as a support within this pattern.
A daily close above 24.7 levels validated the breakout from the 18-month-long rectangle chart pattern.
Based on this chart pattern, the potential price target is 40 levels.
MYGN, classified under the "healthcare" sector, falls under the “Mid Cap - Value” stock category.
Simulations Plus, Inc.-(SLP/NASDAQ)-Long Idea
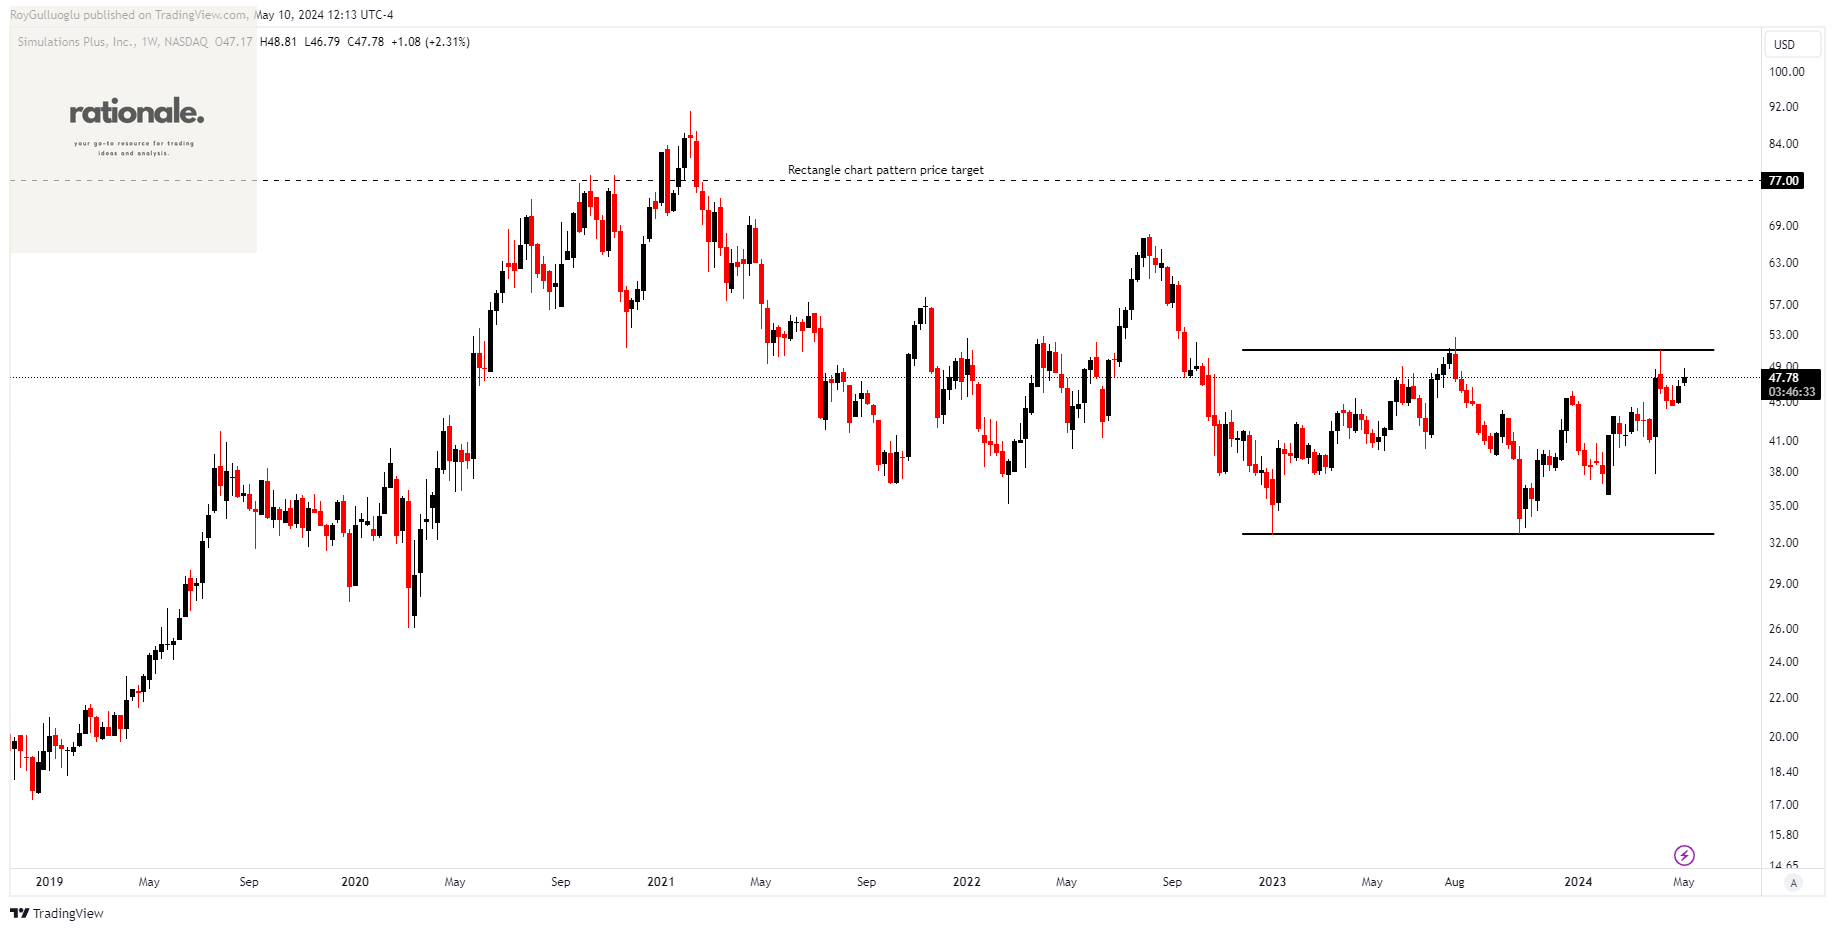
Simulations Plus, Inc. designs software for drug discovery and development, employing artificial intelligence and machine learning technology for modeling, simulating, and predicting molecular properties on a global scale.
The above weekly chart formed an approximately 18-month-long rectangle chart pattern as a bullish reversal after a downtrend.
The horizontal boundary at 51 levels acts as a support within this pattern.
A daily close above 52.53 levels would validate the breakout from the 18-month-long rectangle chart pattern.
Based on this chart pattern, the potential price target is 77 levels.
SLP, classified under the "healthcare" sector, falls under the “Small Cap - Value” stock category.
Dow Inc.-(DOW/NYSE)-Long Idea
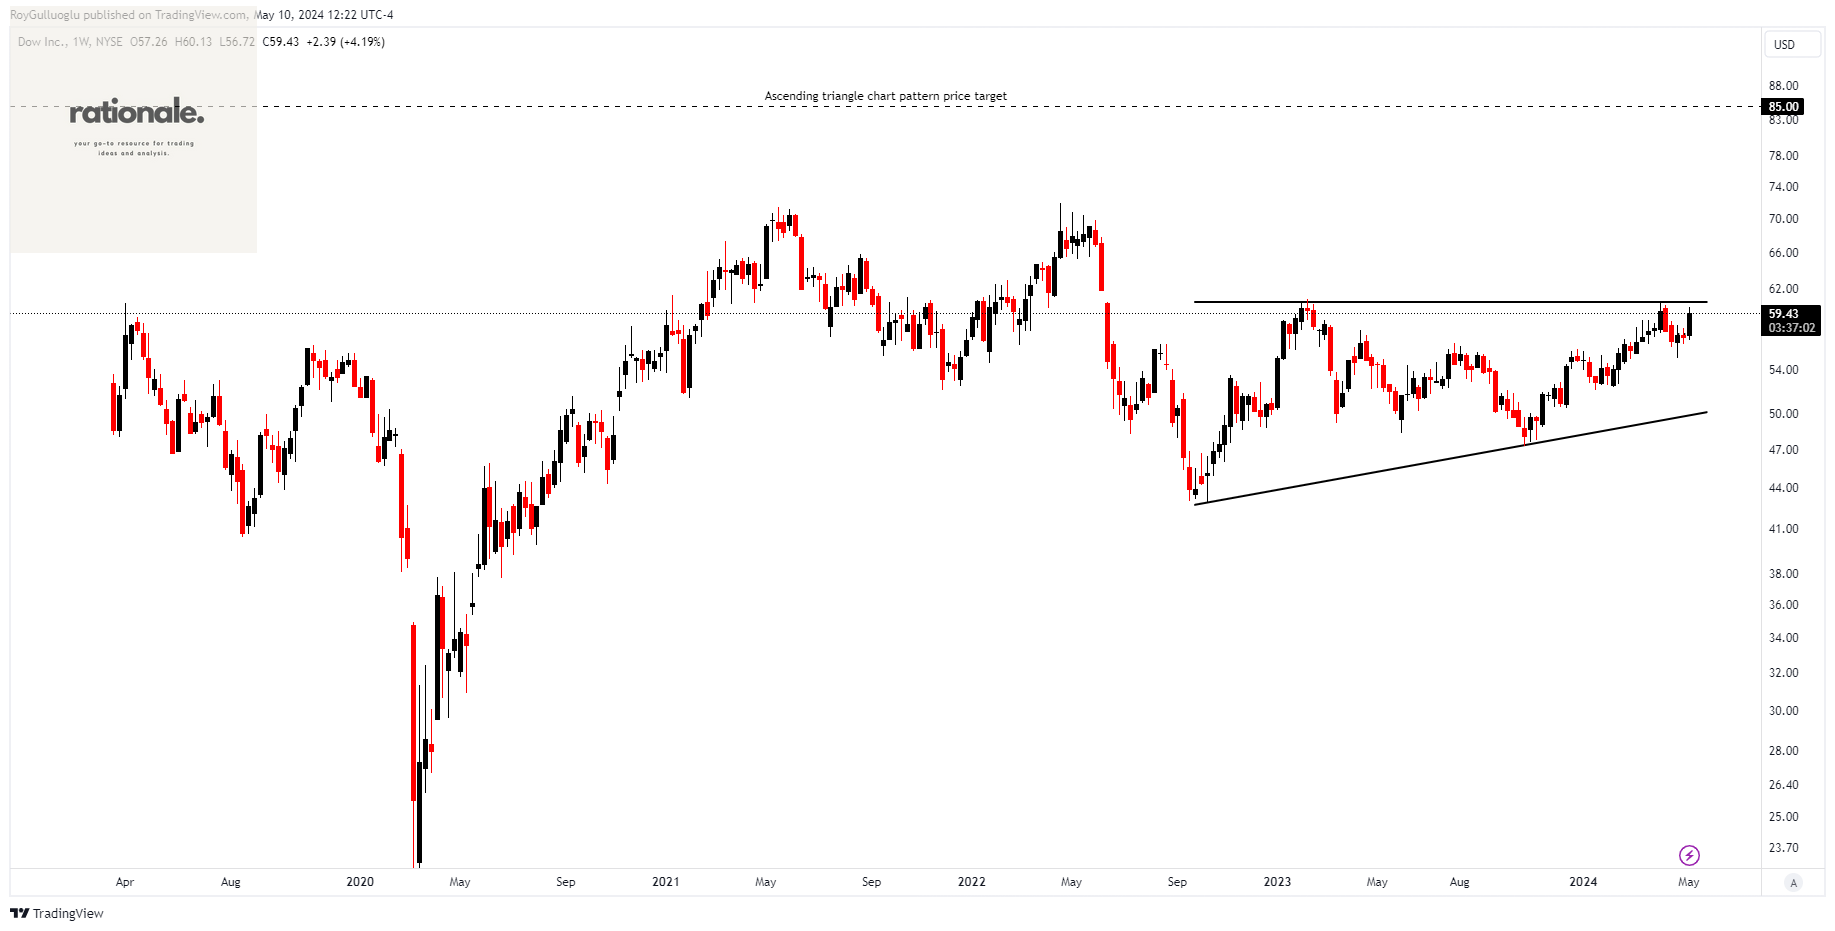
Dow Inc., along with its subsidiaries, provides diverse materials science solutions for packaging, infrastructure, mobility, and consumer applications across regions including the United States, Canada, Europe, the Middle East, Africa, India, the Asia Pacific, and Latin America.
The above weekly chart formed an approximately 20-month-long Cup & Handle chart pattern as a bullish continuation after an uptrend.
The horizontal boundary at 60.6 levels acted as a support within this pattern.
A daily close above 62.41 levels validated the breakout from the 20-month-long Cup & Handle chart pattern.
Based on this chart pattern, the potential price target is 85 levels.
DOW, classified under the "basic materials" sector, falls under the “Small Cap - Value” stock category.
Build-A-Bear Workshop, Inc.-(BBW/NYSE)-Long Idea
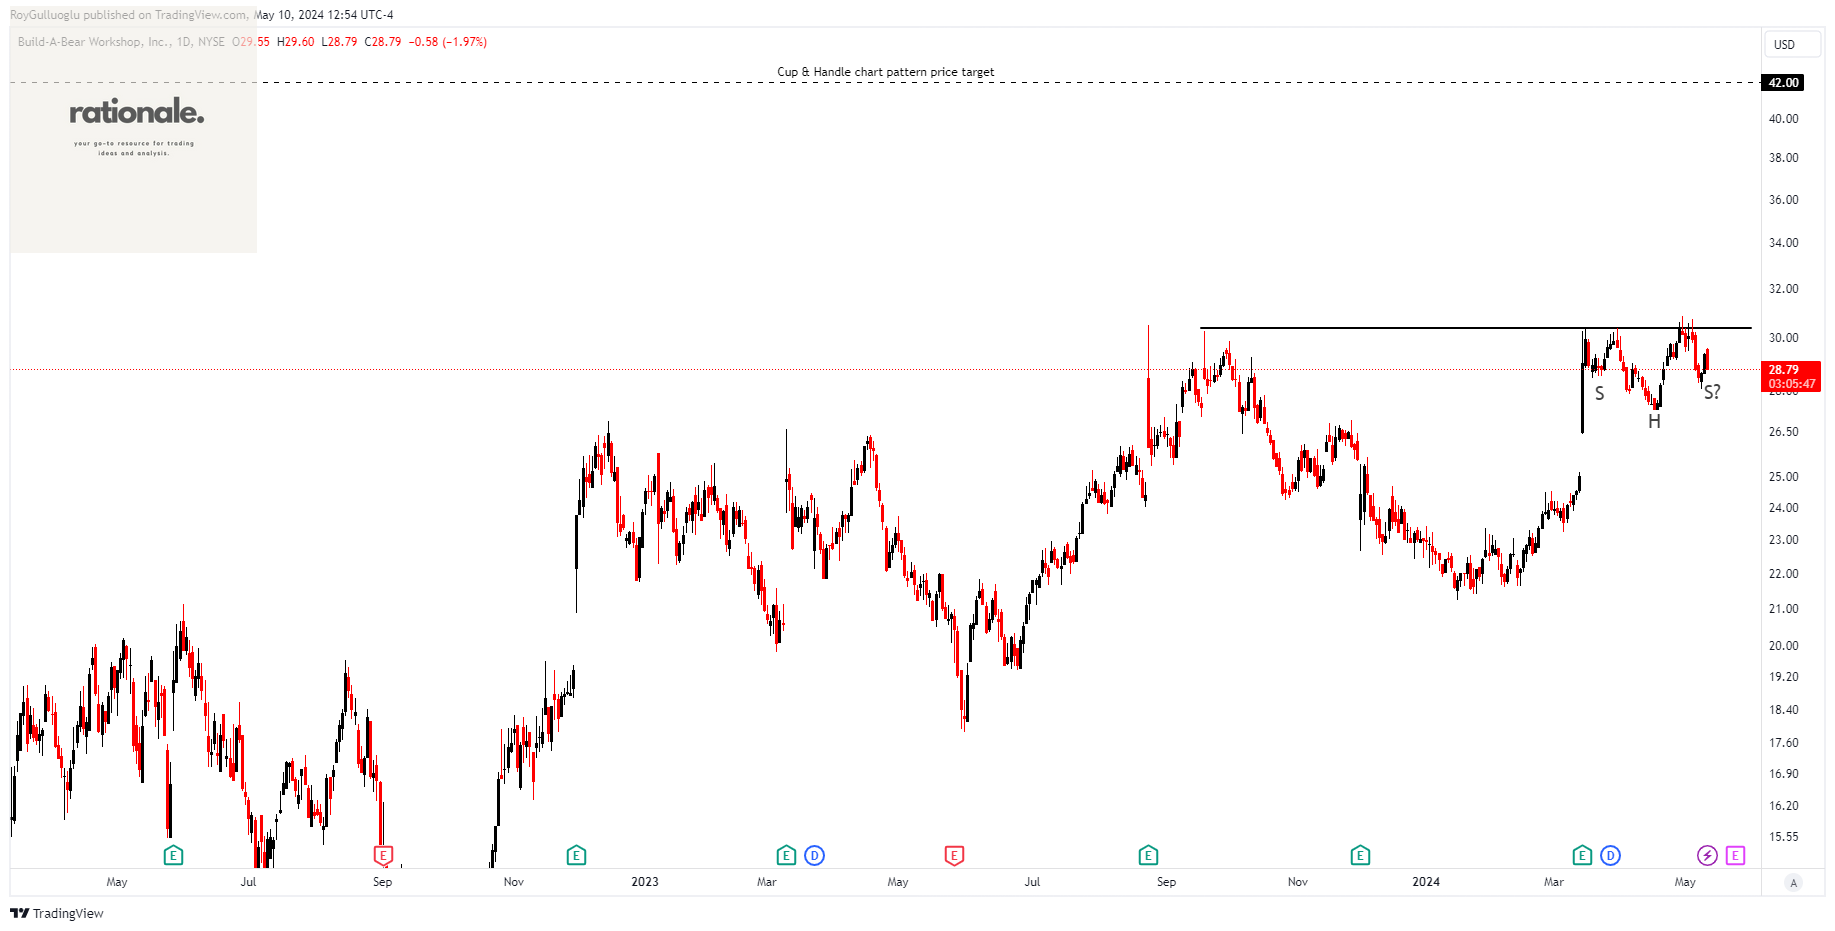
Build-A-Bear Workshop, Inc. functions as a multi-channel retailer specializing in plush animals and associated products, serving customers in the United States, Canada, the United Kingdom, Ireland, and across the globe.
The above daily chart formed an approximately 5-month-long Cup & Handle chart pattern as a bullish continuation after an uptrend.
The horizontal boundary at 30.38 levels acts as a support within this pattern.
A daily close above 31.3 levels would validate the breakout from the 5-month-long Cup & Handle chart pattern.
Based on this chart pattern, the potential price target is 42 levels.
BBW, classified under the "consumer cyclicals" sector, falls under the “Small Cap - Growth” stock category.
JD.com, Inc.-(JD/NASDAQ)-Long Idea
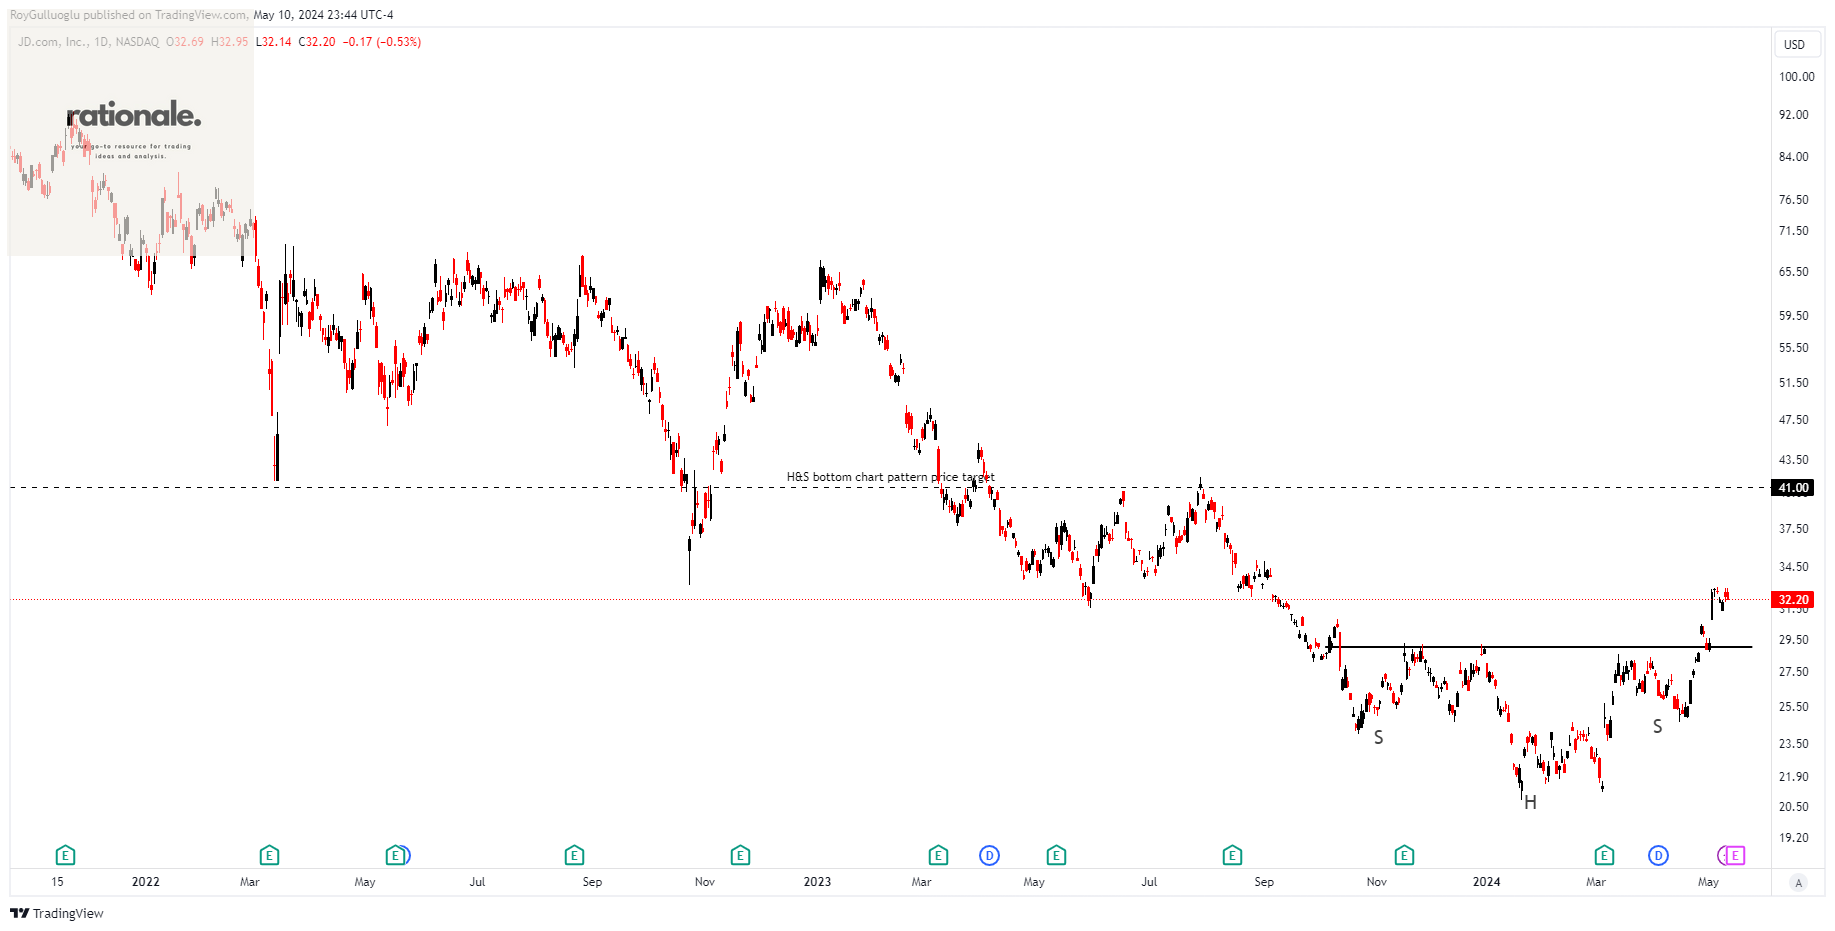
JD.com, Inc. functions as a technology and service provider rooted in supply chain operations within the People's Republic of China.
The above weekly chart formed an approximately 5-month-long H&S bottom chart pattern as a bullish reversal after a downtrend.
The horizontal boundary at 29 levels acted as a support within this pattern.
A daily close above 29.87 levels validated the breakout from the 5-month-long H&S bottom chart pattern.
Based on this chart pattern, the potential price target is 41 levels.
JD, classified under the "consumer cyclical" sector.
The Weir Group PLC-(WEIR/LSE)-Long Idea
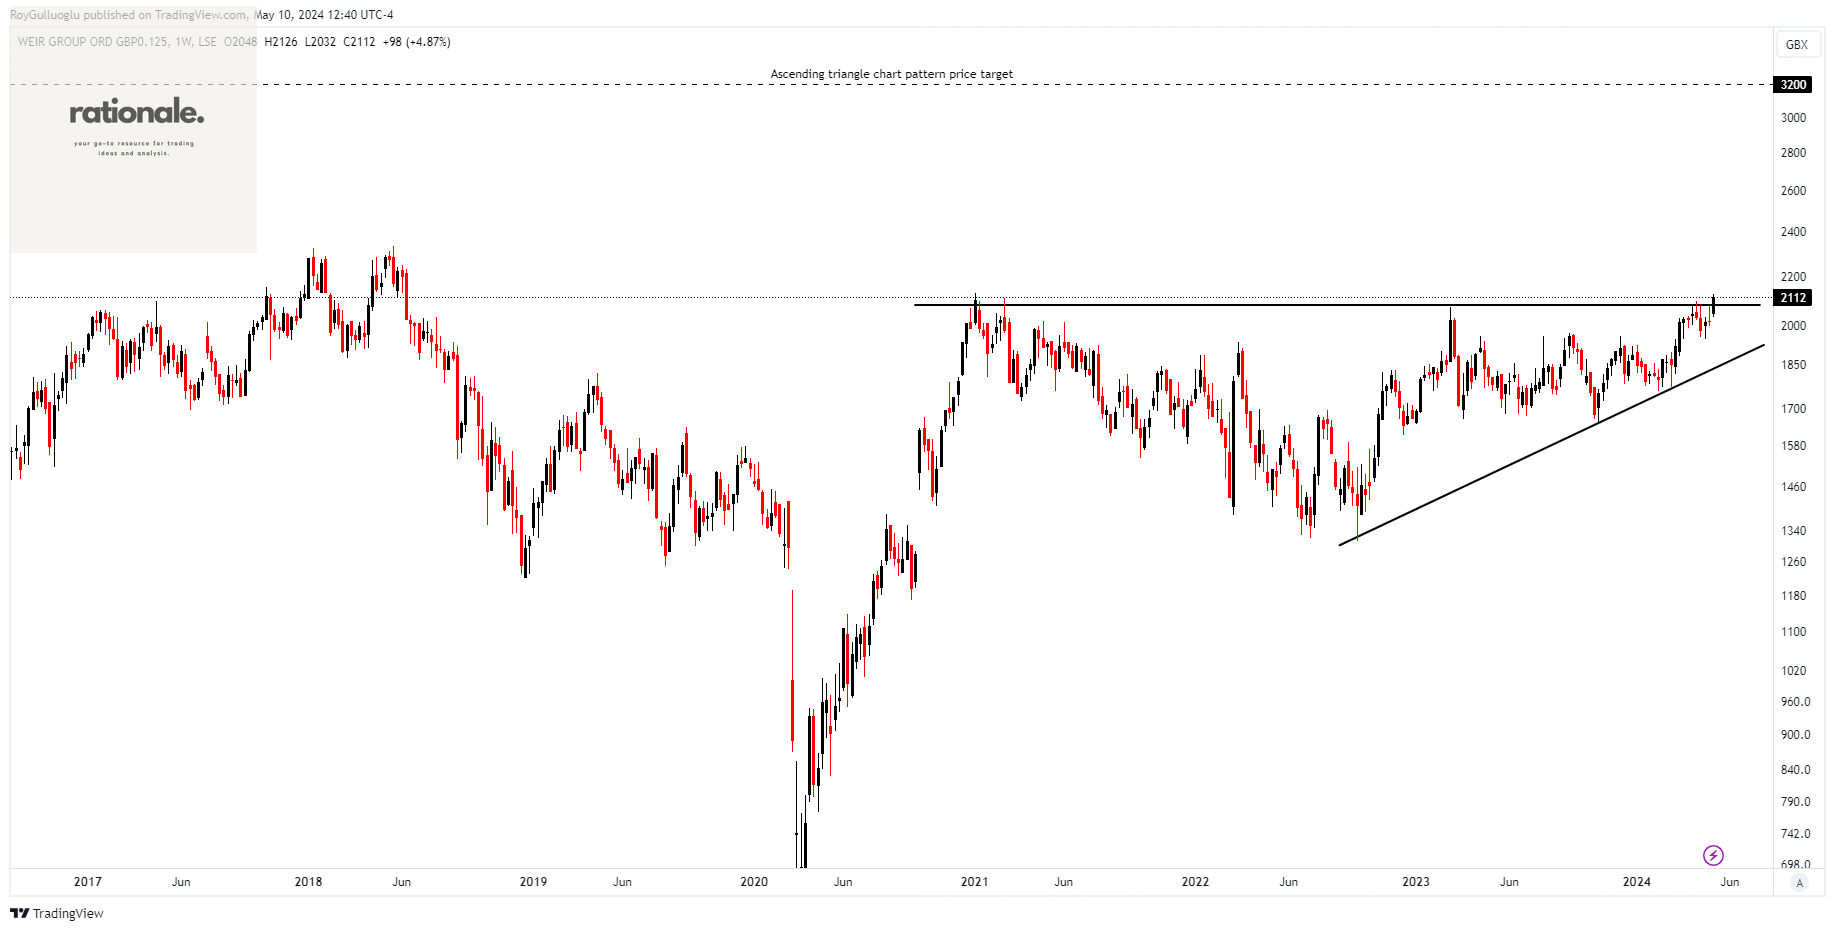
The Weir Group PLC manufactures and distributes highly engineered original equipment globally. Its operations are divided into two segments: Minerals and ESCO.
The above weekly chart formed an approximately 40-month-long ascending triangle chart pattern as a bullish continuation after an uptrend.
The horizontal boundary at 2080 levels acts as a support within this pattern.
A daily close above 2142 levels would validate the breakout from the 40-month-long ascending triangle chart pattern.
Based on this chart pattern, the potential price target is 3200 levels.
WEIR, classified under the "industrials" sector, falls under the “Mid Cap - Value” stock category.
Marks and Spencer Group plc-(MKS/LSE)-Long Idea
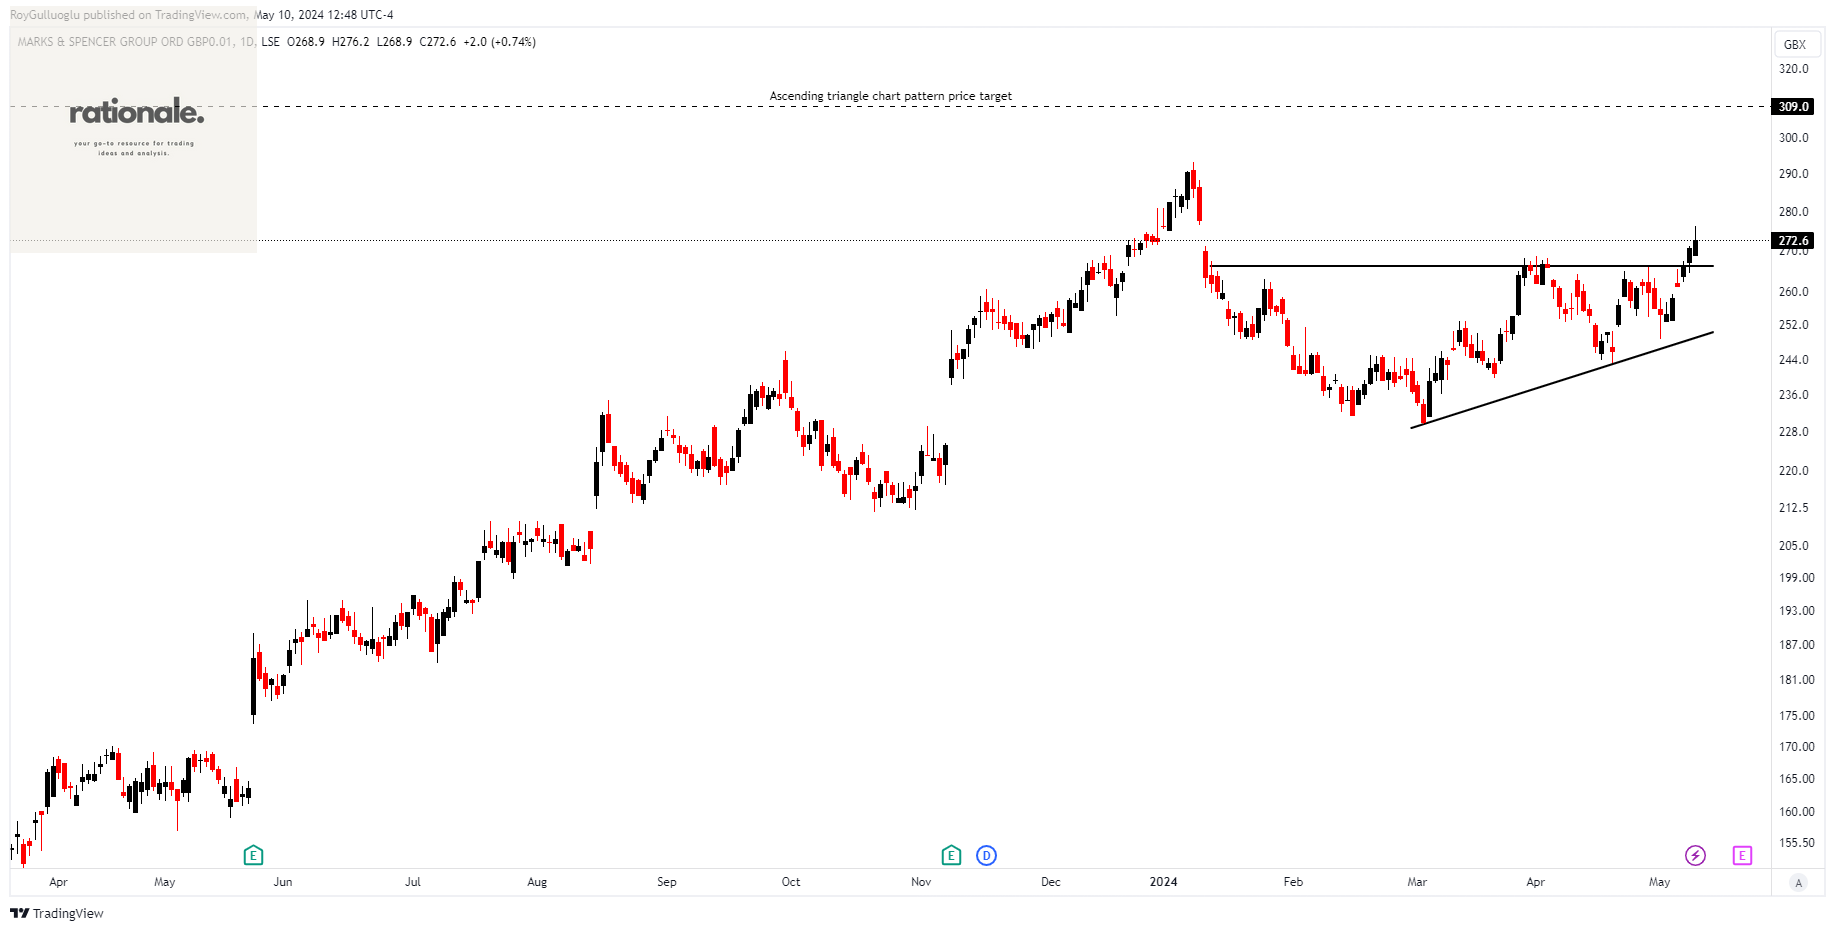
Marks and Spencer Group plc manages a range of retail outlets, organized into five segments: UK Clothing & Home, UK Food, International, Ocado, and All Other.
The above daily chart formed an approximately 3-month-long ascending triangle chart pattern as a bullish reversal after a downtrend.
The horizontal boundary at 266.3 levels acts as a support within this pattern.
A daily close above 274.28 levels would validate the breakout from the 3-month-long ascending triangle chart pattern.
Based on this chart pattern, the potential price target is 309 levels.
MKS, classified under the "consumer cyclicals" sector, falls under the “Mid Cap - Growth” stock category.
Tekfen Holding Anonim Sirketi-(TKFEN/BIST)-Long Idea
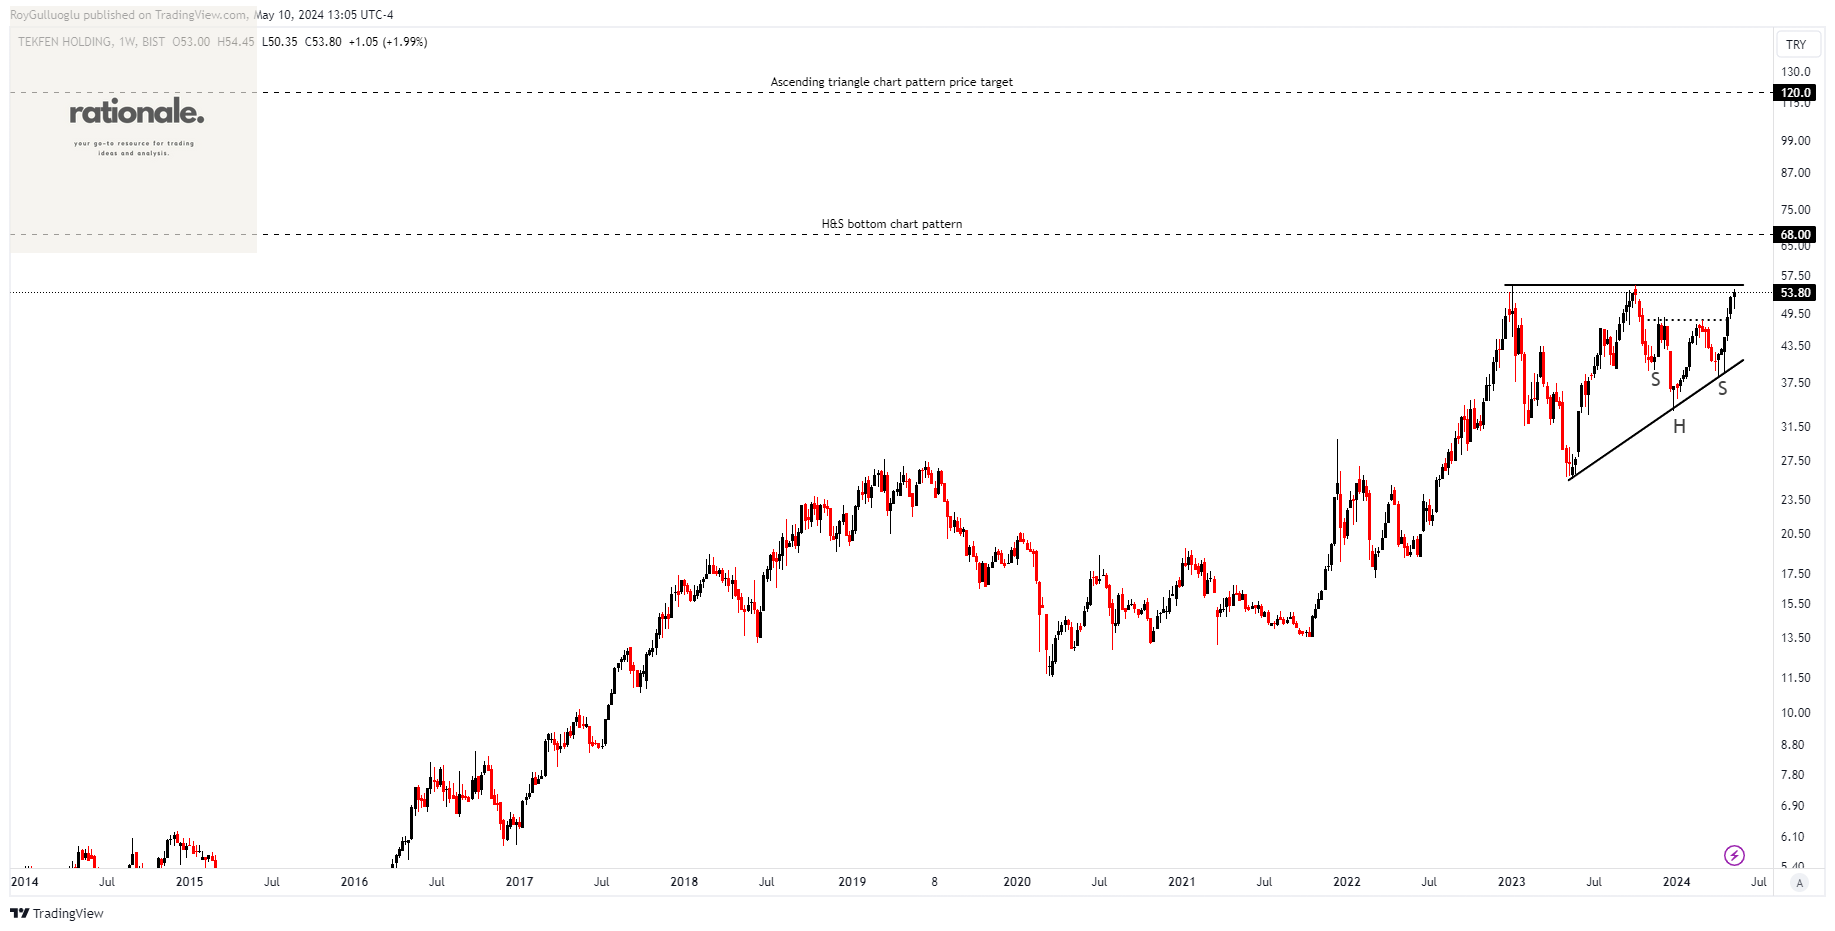
Tekfen Holding Anonim Sirketi, along with its subsidiaries, operates in various sectors including engineering and contracting, chemicals, agriculture, services, and investments across Turkey, the CIS countries, the Middle East, and worldwide.
The above weekly chart formed an approximately 18-month-long ascending triangle chart pattern as a bullish continuation after an uptrend.
The horizontal boundary at 55.4 levels acts as a resistance within this pattern.
A daily close above 57 levels would validate the breakout from the 18-month-long ascending triangle chart pattern.
Based on this chart pattern, the potential price target is 120 levels.
TKFEN, classified under the "industrials" sector, falls under the “Small Cap - Value” stock category.
Galata Wind Enerji A.S.-(GWIND/BIST)-Long Idea
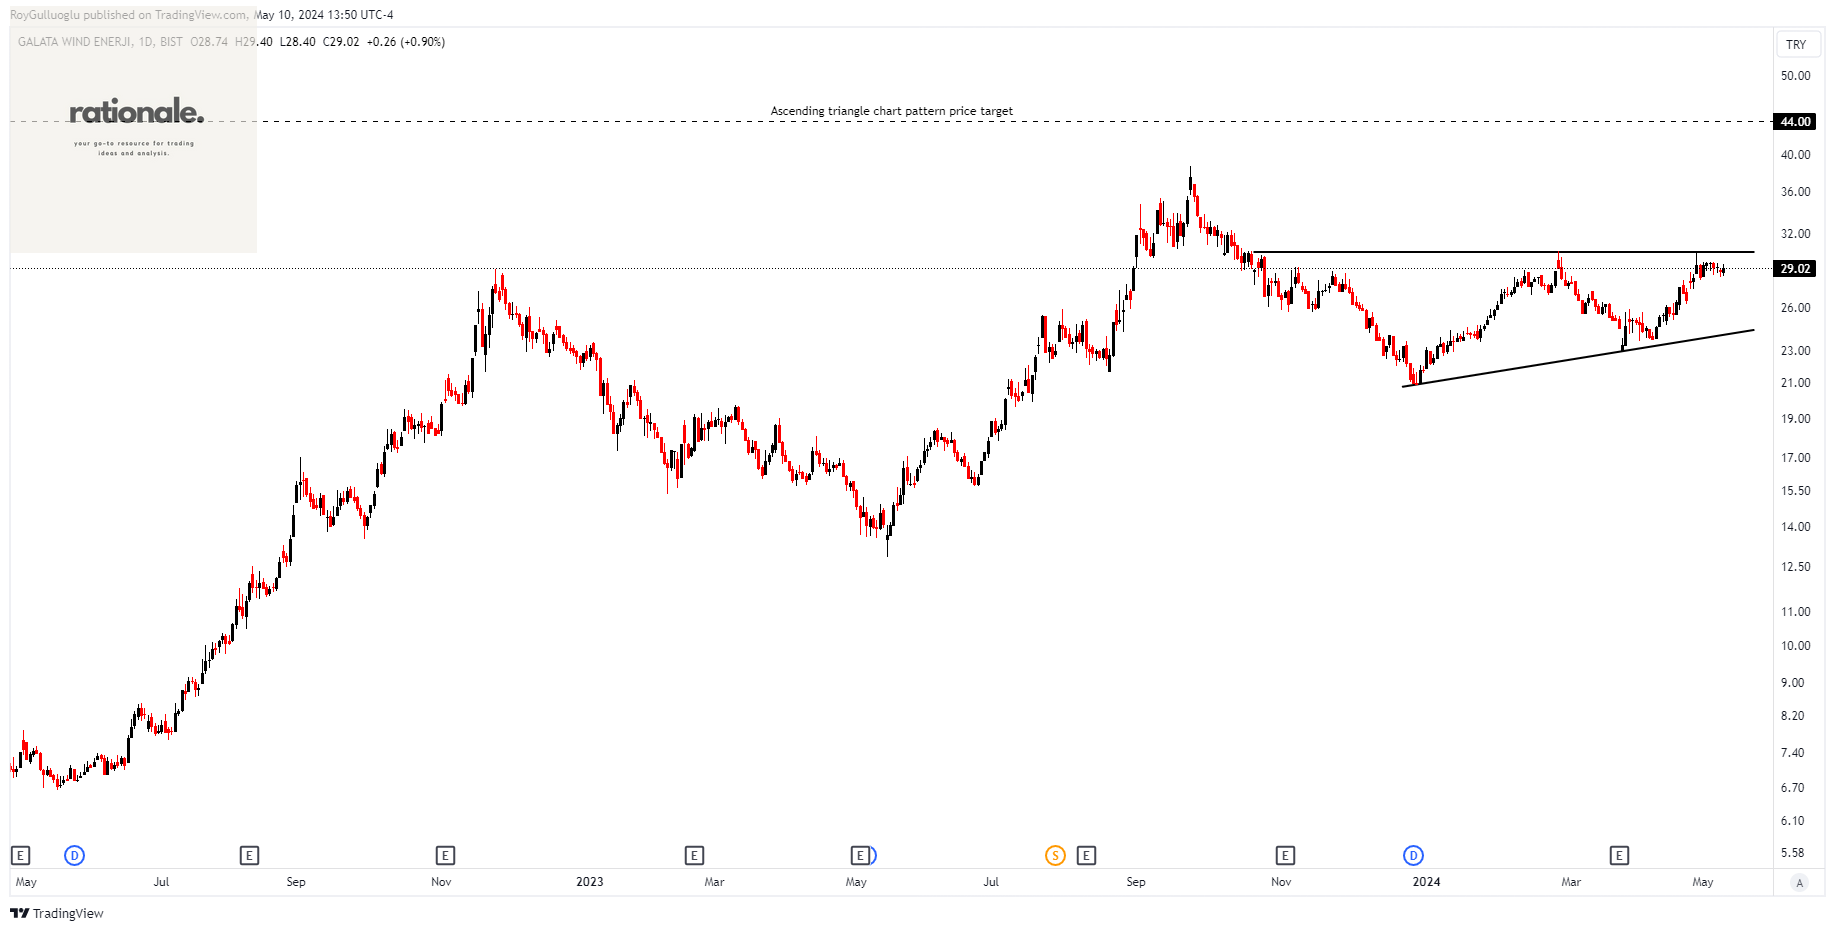
Galata Wind Enerji A.S. runs and leases electricity-generating facilities in Turkey.
The above daily chart formed an approximately 5-month-long ascending triangle chart pattern as a bullish reversal after a downtrend.
The horizontal boundary at 30.4 levels acts as a resistance within this pattern.
A daily close above 31.31 levels would validate the breakout from the 5-month-long ascending triangle chart pattern.
Based on this chart pattern, the potential price target is 44 levels.
GWIND, classified under the "utilities" sector, falls under the “Small Cap - Income” stock category.
Shandong Gold Mining Co., Ltd.-(600547/SSE)-Long Idea
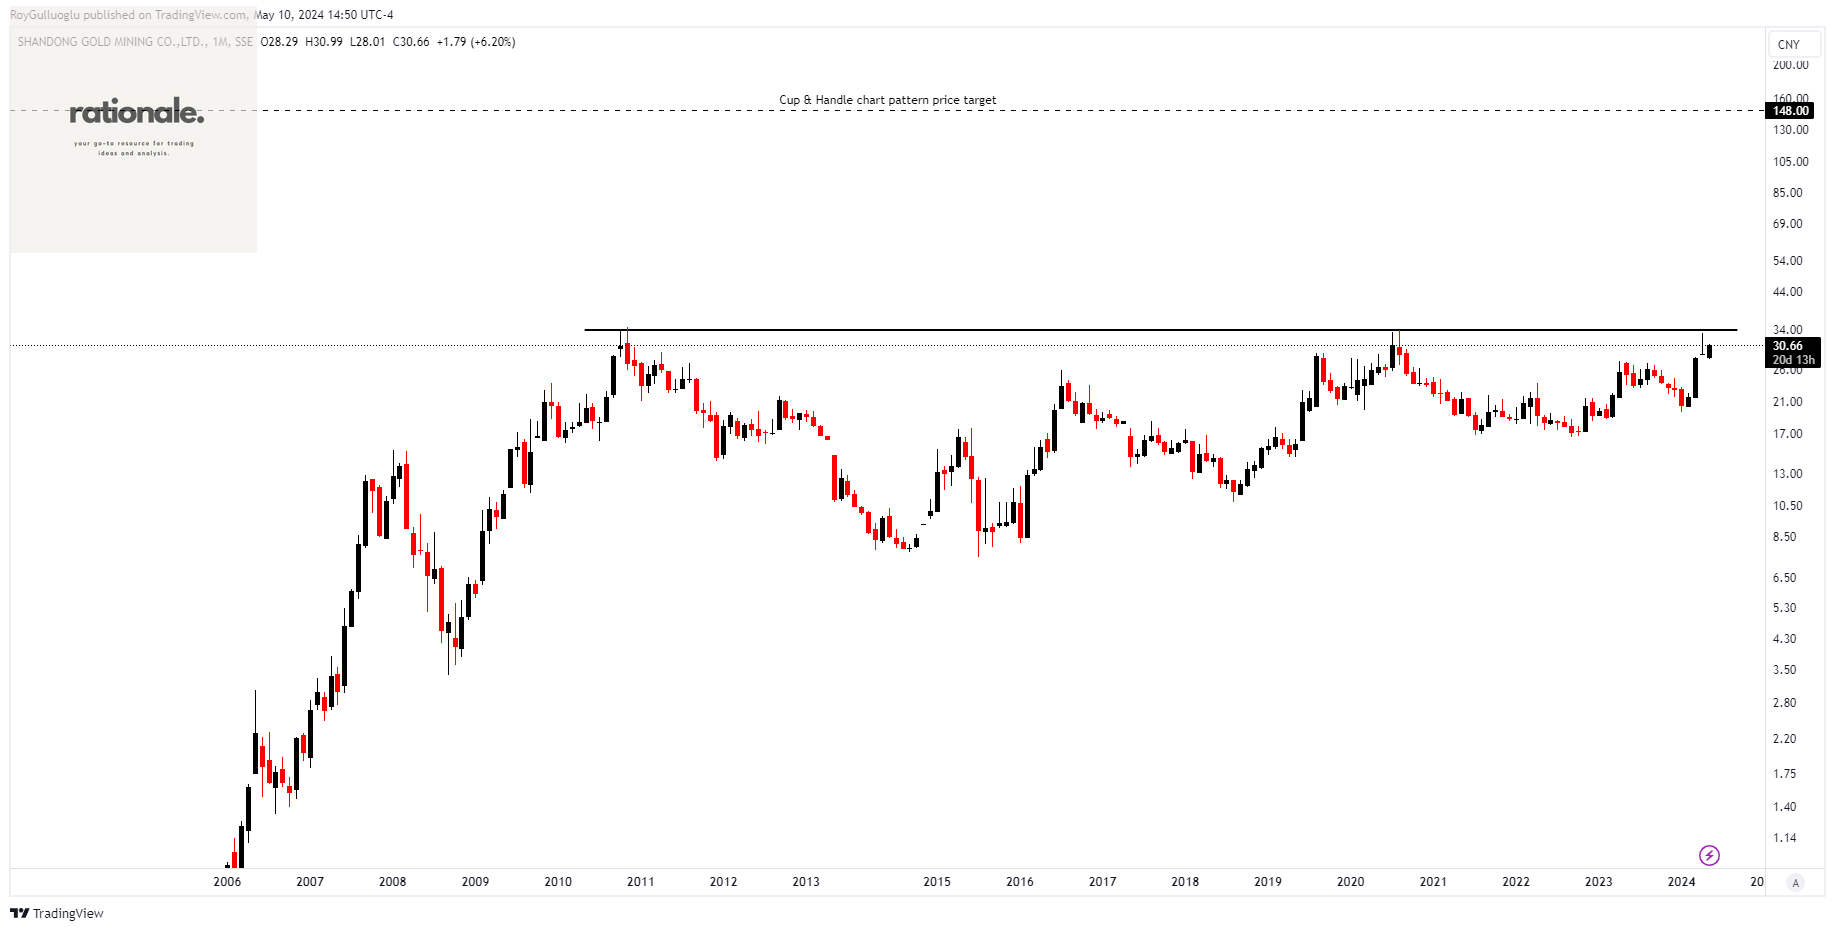
Shandong Gold Mining Co., Ltd. is involved in the exploration, mining, processing, smelting, and sales of gold and silver ores within the People's Republic of China.
The above monthly chart potentially forms an approximately 13-year-long cup & handle chart pattern as a bullish continuation after an uptrend.
The horizontal boundary at 33.94 levels acts as a support within this pattern.
A daily close above 34.95 levels would validate the breakout from the 13-year-long cup & handle chart pattern.
Based on this chart pattern, the potential price target is 148 levels.
600547, classified under the "basic materials" sector, falls under the “Large Cap - Value” stock category.
Shanxi Xinghuacun Fen Wine Factory Co.,Ltd.-(600809/SSE)-Long Idea
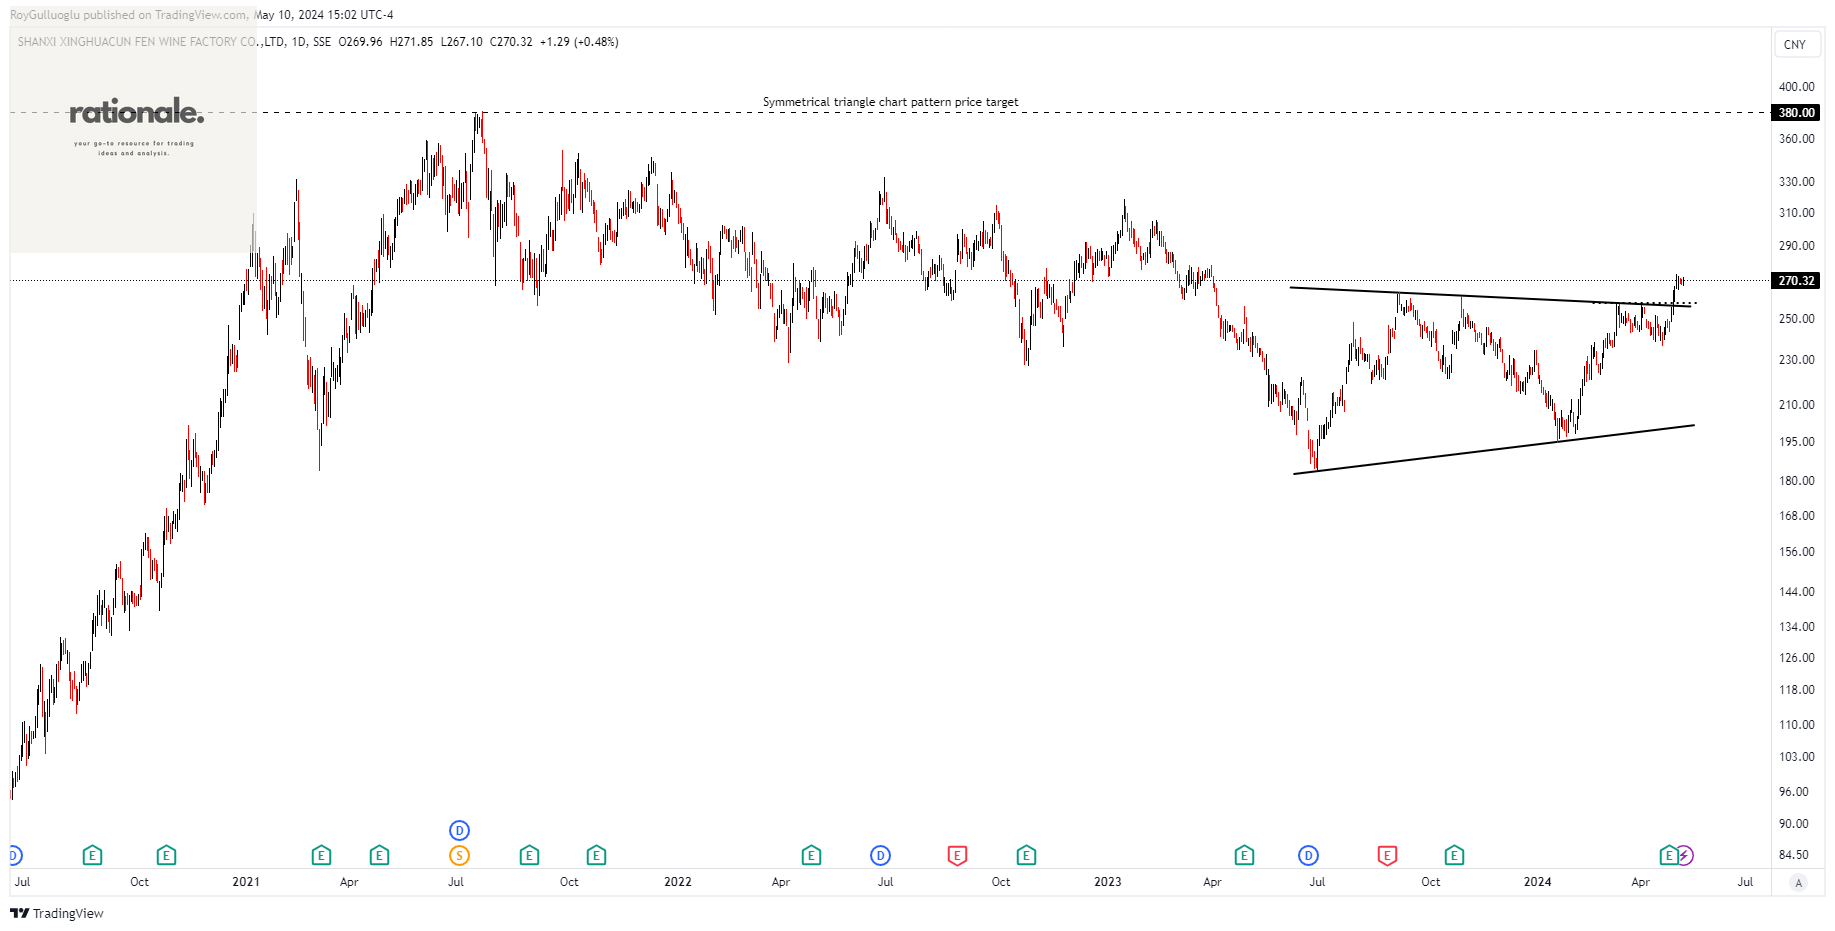
Shanxi Xinghuacun Fen Wine Factory Co., Ltd. manufactures and distributes wine within China.
The above daily chart forms an approximately 6-year-long symmetrical triangle chart pattern as a bullish reversal after a downtrend.
The horizontal boundary at 258 levels acts as a support within this pattern.
A daily close above 265.74 levels would validate the breakout from the 6-year-long symmetrical triangle chart pattern.
Based on this chart pattern, the potential price target is 380 levels.
600809, classified under the "consumer defensive" sector, falls under the “Large Cap - Value” stock category.
Poly Medicure Limited-(POLYMED/NSE)-Long Idea
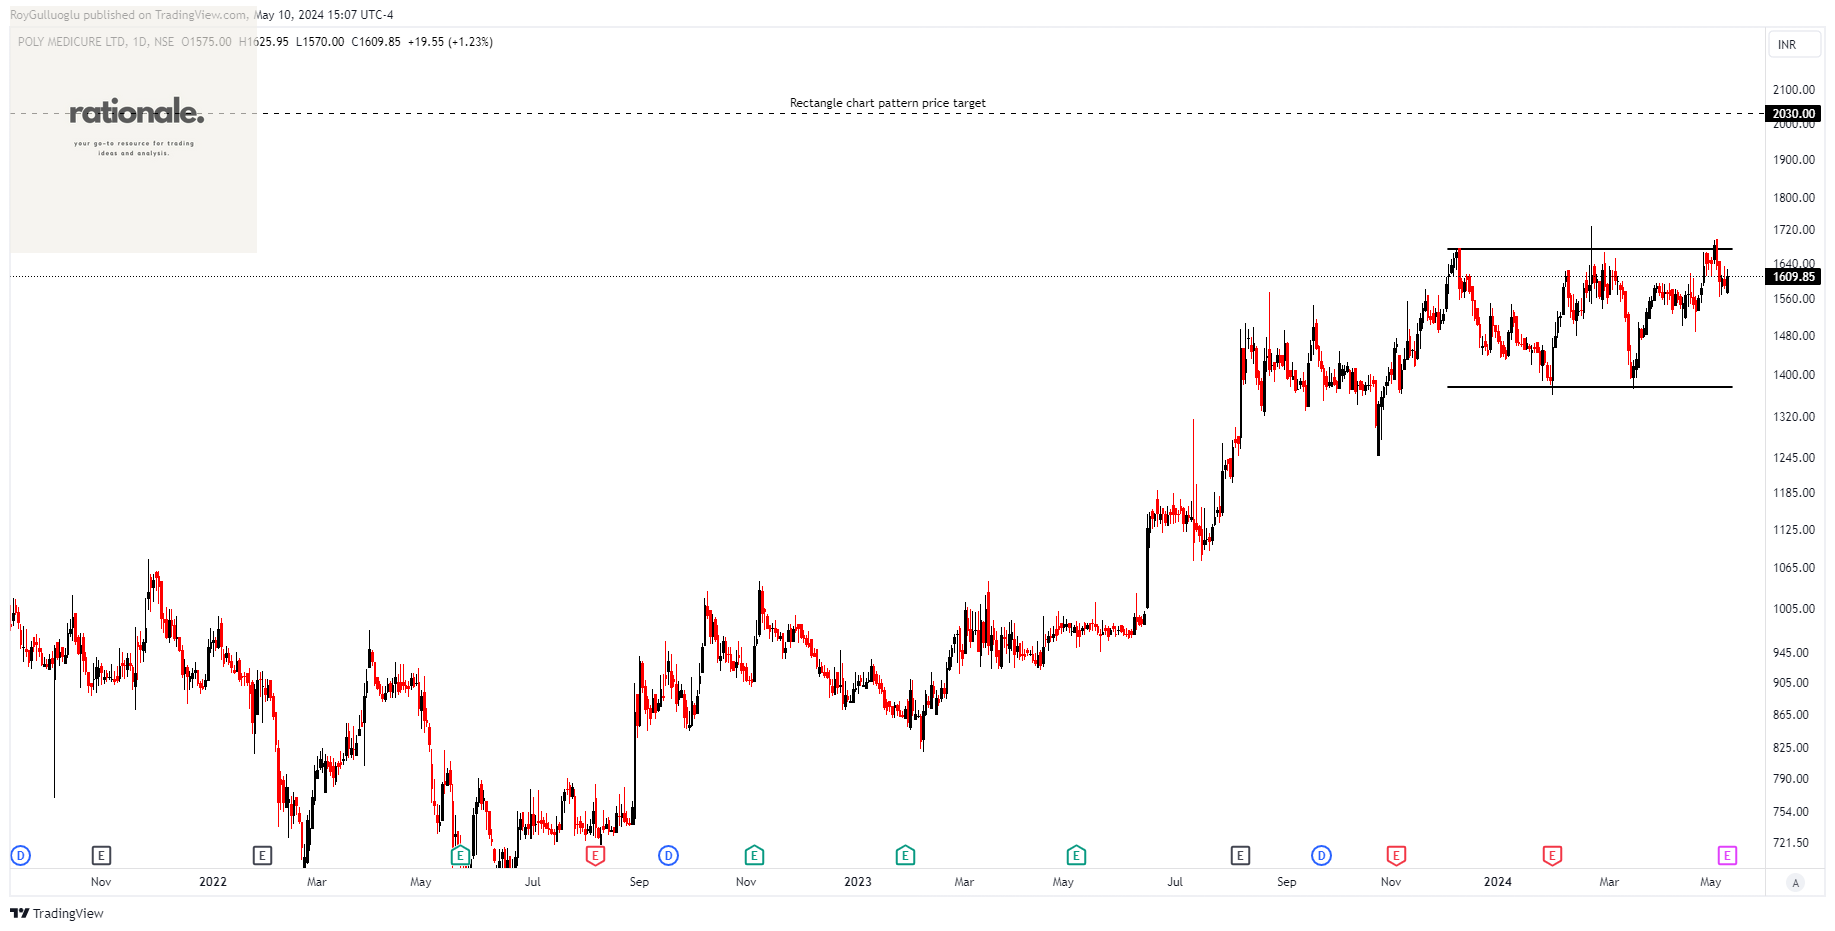
Poly Medicure Limited produces and markets medical devices in both domestic and international markets, with a focus on India.
The above daily chart forms an approximately 3-month-long rectangle chart pattern as a bullish continuation after a downtrend.
The horizontal boundary at 1673 levels acts as a support within this pattern.
A daily close above 1724 levels would validate the breakout from the 3-month-long rectangle chart pattern.
Based on this chart pattern, the potential price target is 2030 levels.
POLYMED, classified under the "healthcare" sector, falls under the “Small Cap - Value” stock category.
Daiichi Sankyo Company, Limited-(4568/TSE)-Long Idea
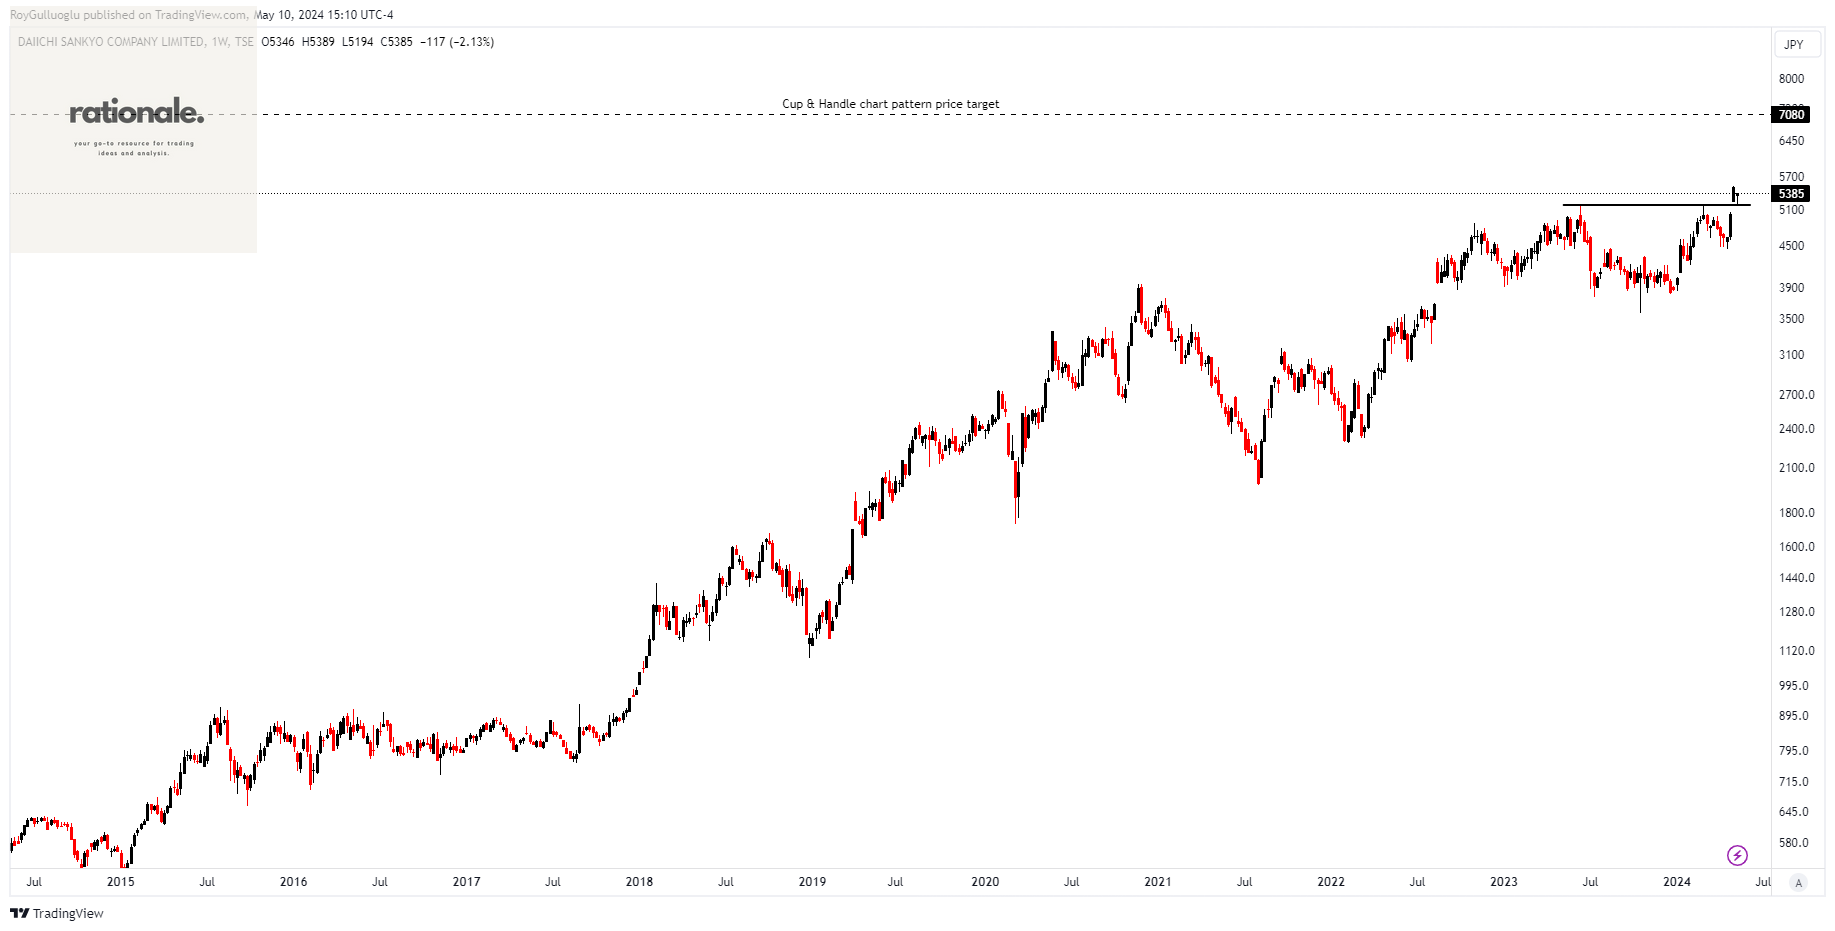
Daiichi Sankyo Company, Limited manufactures, markets, and distributes pharmaceutical products globally.
The above daily chart formed an approximately 2-month-long Cup & Handle chart pattern as a bullish continuation after an uptrend.
The horizontal boundary at 5170 levels acts as a support within this pattern.
A daily close above 5325 levels validated the breakout from the 2-month-long Cup & Handle chart pattern.
Based on this chart pattern, the potential price target is 7080 levels.
4568, classified under the "healthcare" sector, falls under the “Large Cap - Value” stock category.
Daicel Corporation-(4202/TSE)-Long Idea
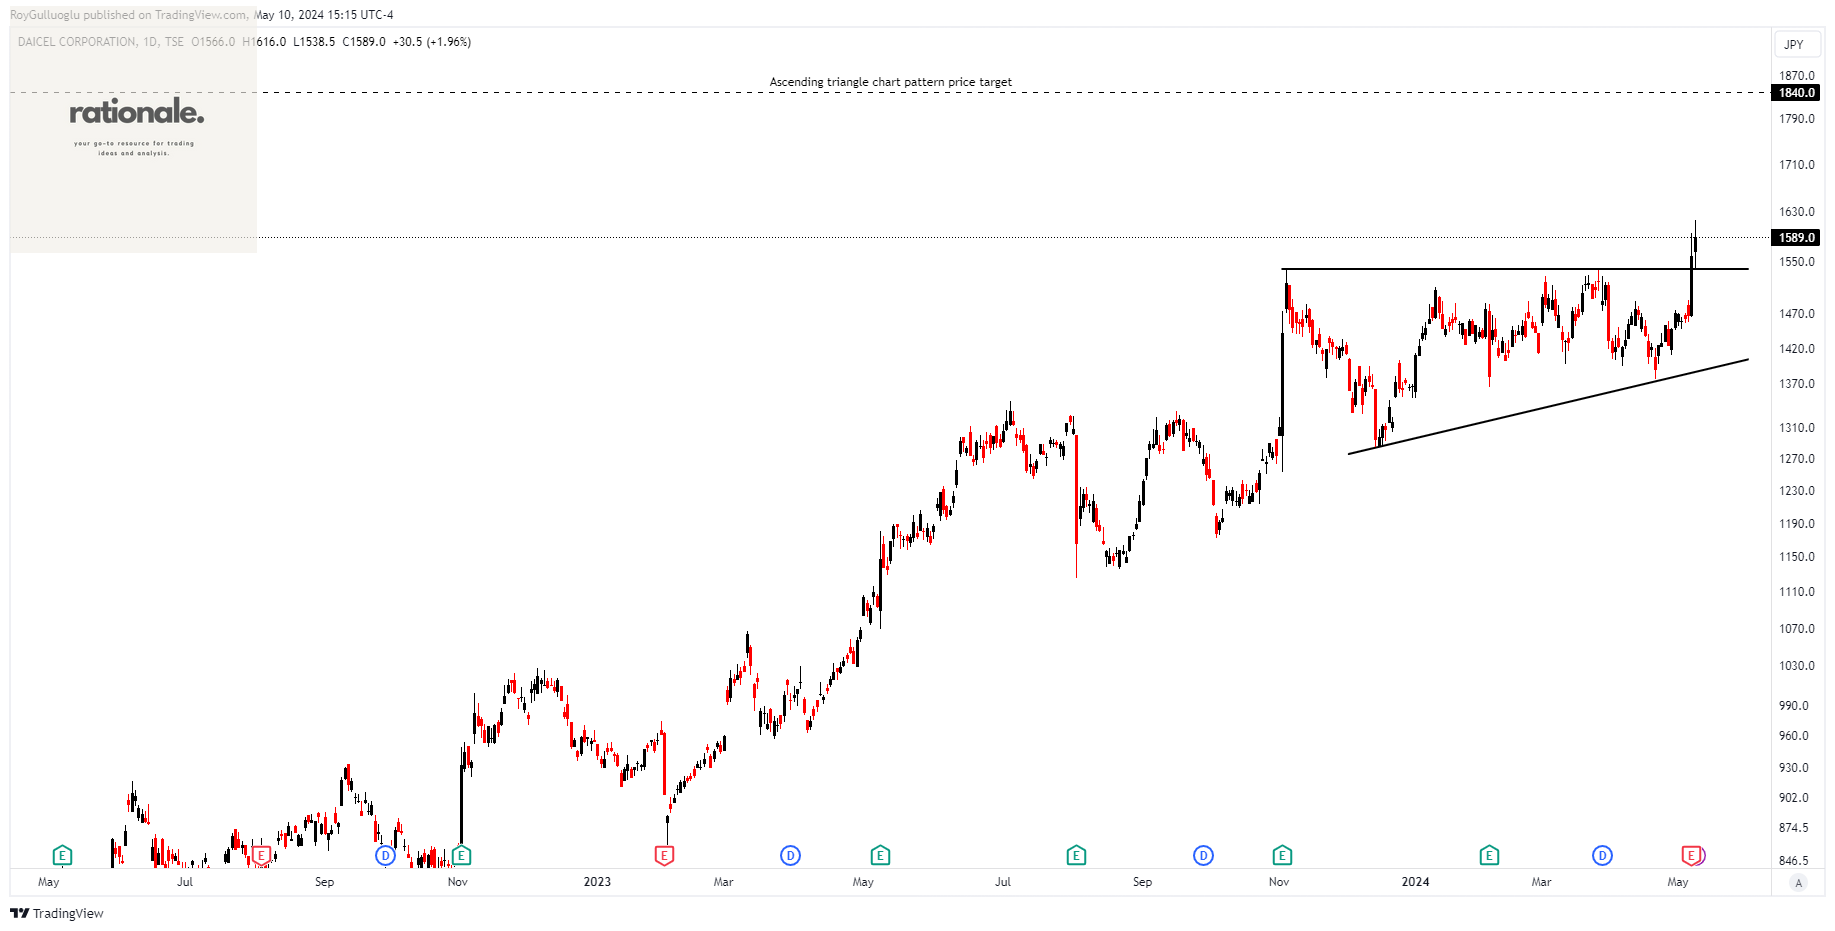
Daicel Corporation operates in various sectors including materials, medical/healthcare, smart technology, safety, engineering plastics, and other industries, spanning Japan, China, and worldwide.
The above daily chart formed an approximately 4-month-long ascending triangle chart pattern as a bullish continuation after an uptrend.
The horizontal boundary at 1538 levels acted as a support within this pattern.
A daily close above 1585 levels validated the breakout from the 4-month-long ascending triangle chart pattern.
Based on this chart pattern, the potential price target is 1840 levels.
4202, classified under the "basic materials" sector, falls under the “Mid Cap - Value” stock category.