


Palantir Technologies Inc.-(PLTR/NASDAQ)-Long Idea
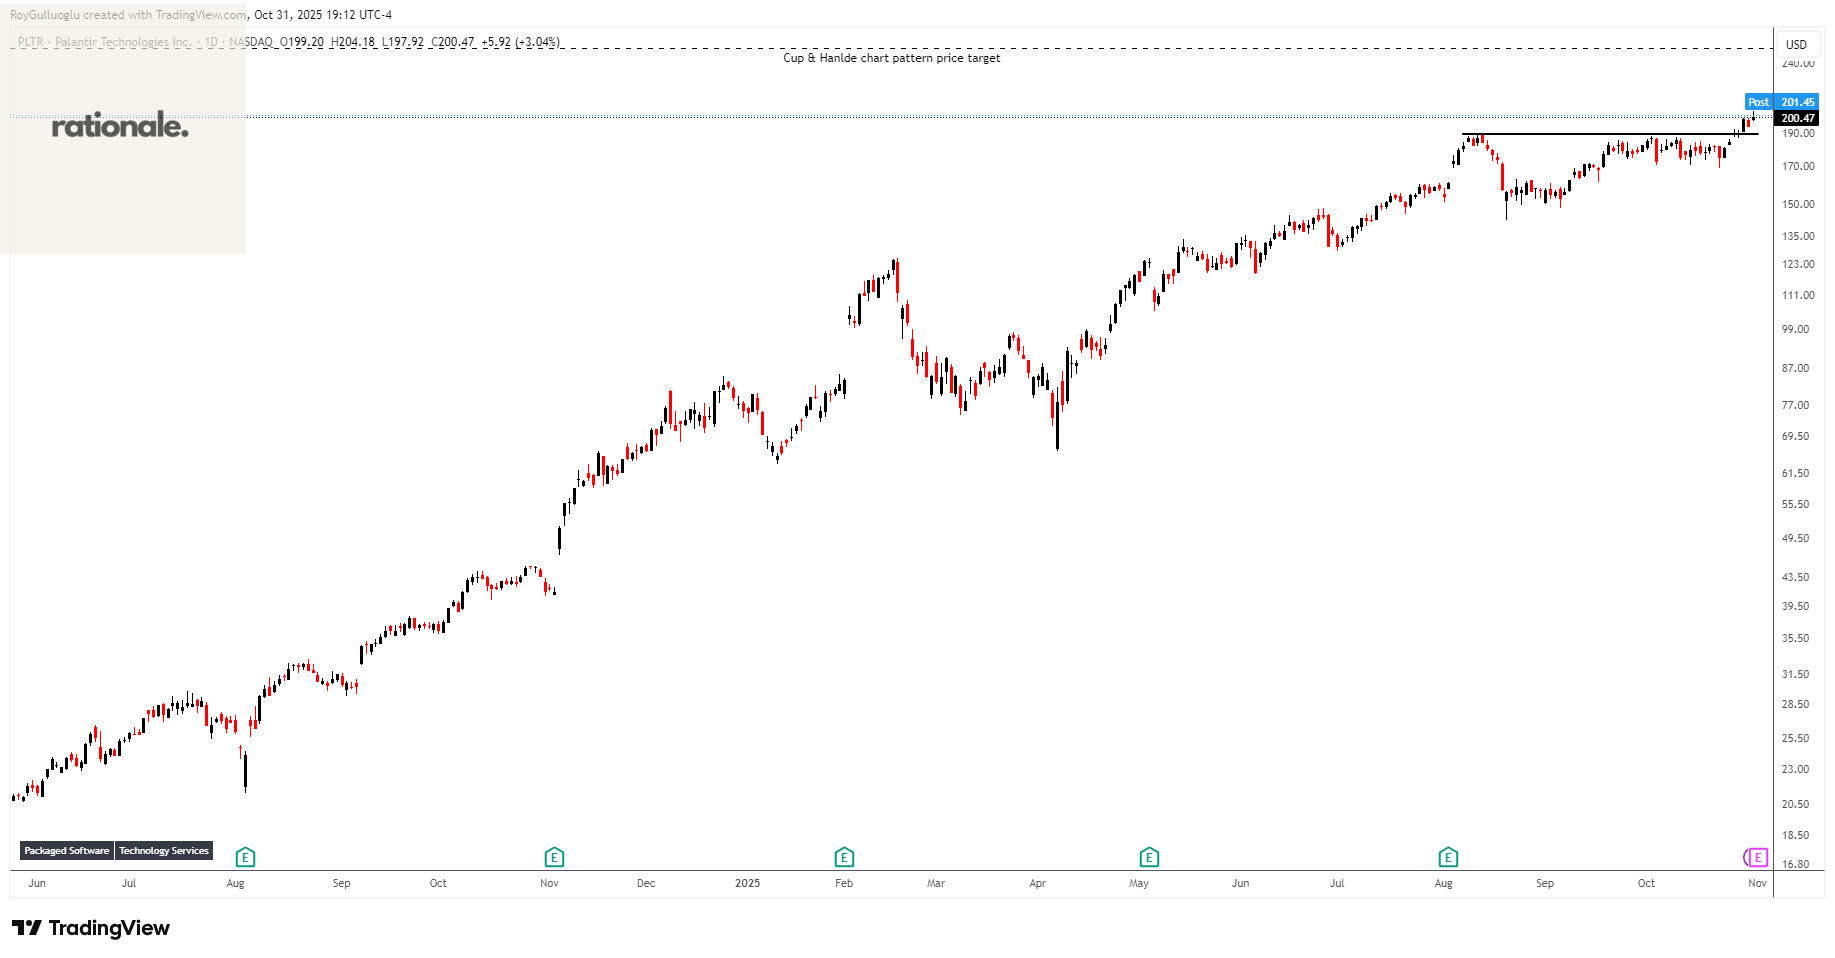
Palantir Technologies Inc. builds and deploys software platforms for the intelligence community to assist in counterterrorism investigations and operations in the United States, the United Kingdom, and internationally.
The above daily chart formed an approximately 2-month-long cup & handle chart pattern as a bullish continuation after an uptrend.
The horizontal boundary at 189.35 levels acted as a resistance within this pattern.
A daily close above 195 levels validated the breakout from the 2-month-long cup & handle chart pattern.
Based on this chart pattern, the potential price target is 252 levels.
PLTR, classified under the “technology” sector, falls under the “Large Cap - Growth” stock category.
Omnicell, Inc.-(OMCL/NASDAQ)-Long Idea
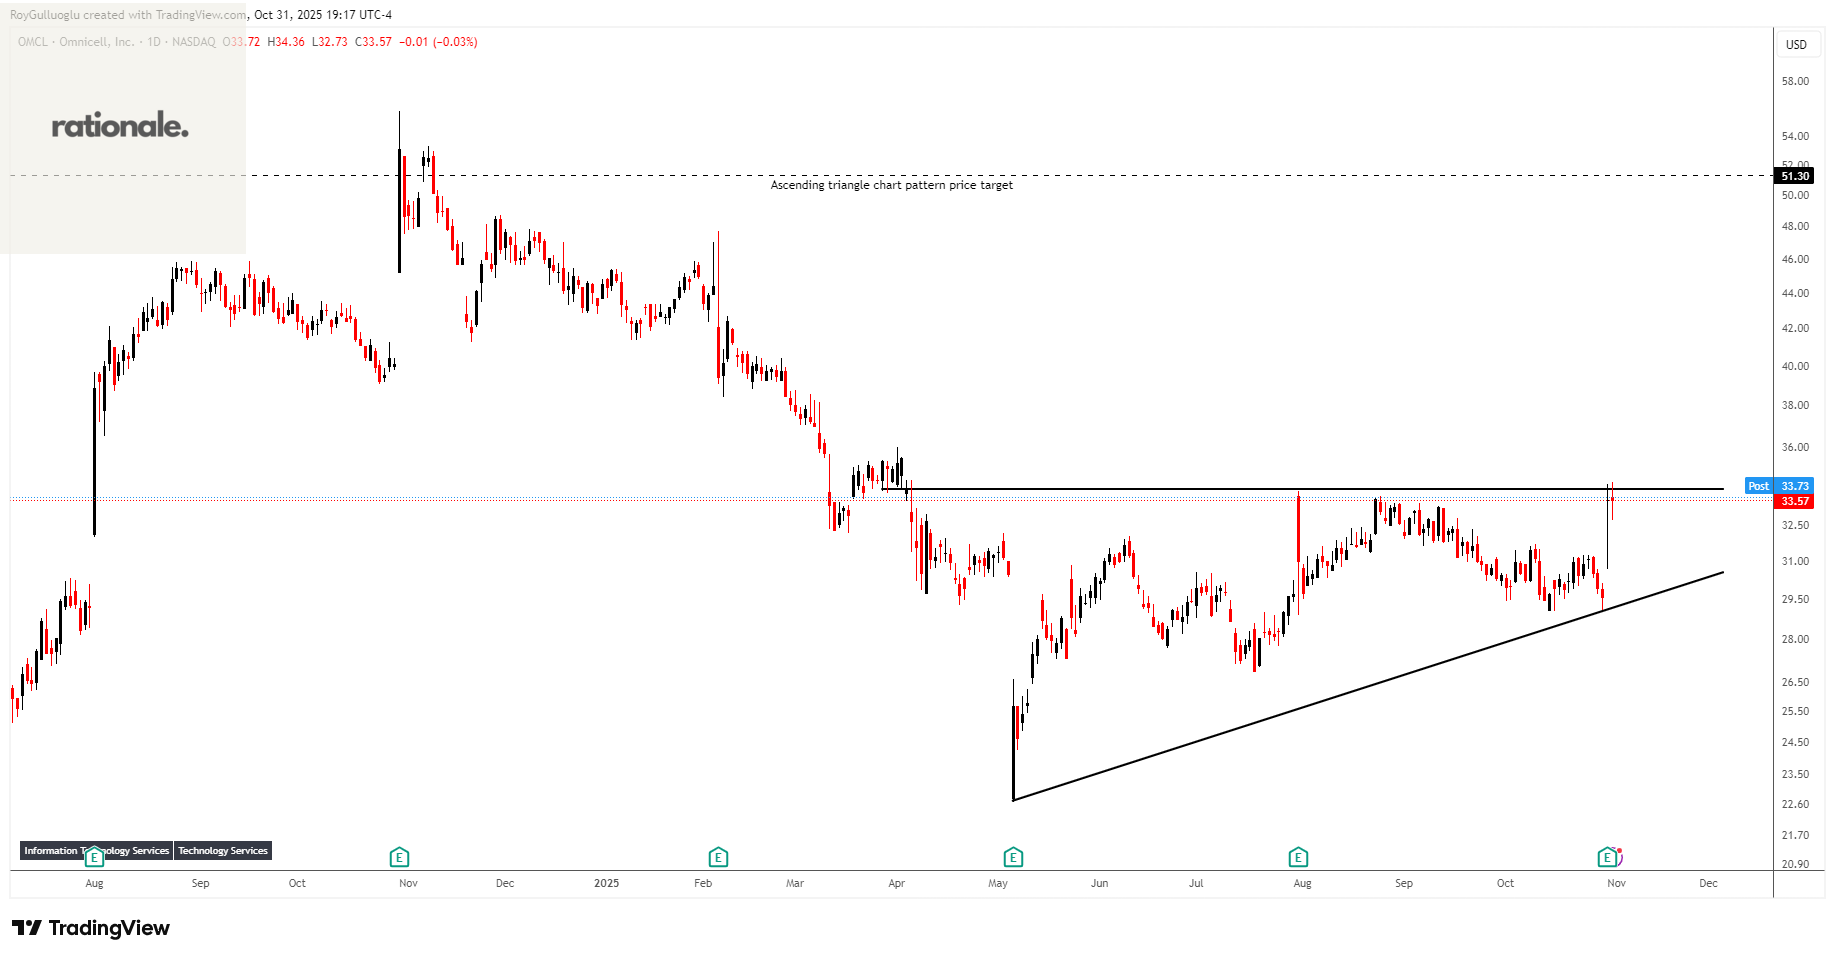
Omnicell, Inc., together with its subsidiaries, provides medication management solutions and adherence tools for healthcare systems and pharmacies the United States and internationally.
The above daily chart formed an approximately 4-month-long ascending triangle chart pattern as a bullish reversal after a downtrend.
The horizontal boundary at 34 levels acts as a resistance within this pattern.
A daily close above 35 levels would validate the breakout from the 4-month-long ascending triangle chart pattern.
Based on this chart pattern, the potential price target is 51.3 levels.
OMCL, classified under the “healthcare” sector, falls under the “Small Cap - Value” stock category.
Kodiak Gas Services, Inc.-(KGS/NASDAQ)-Long Idea
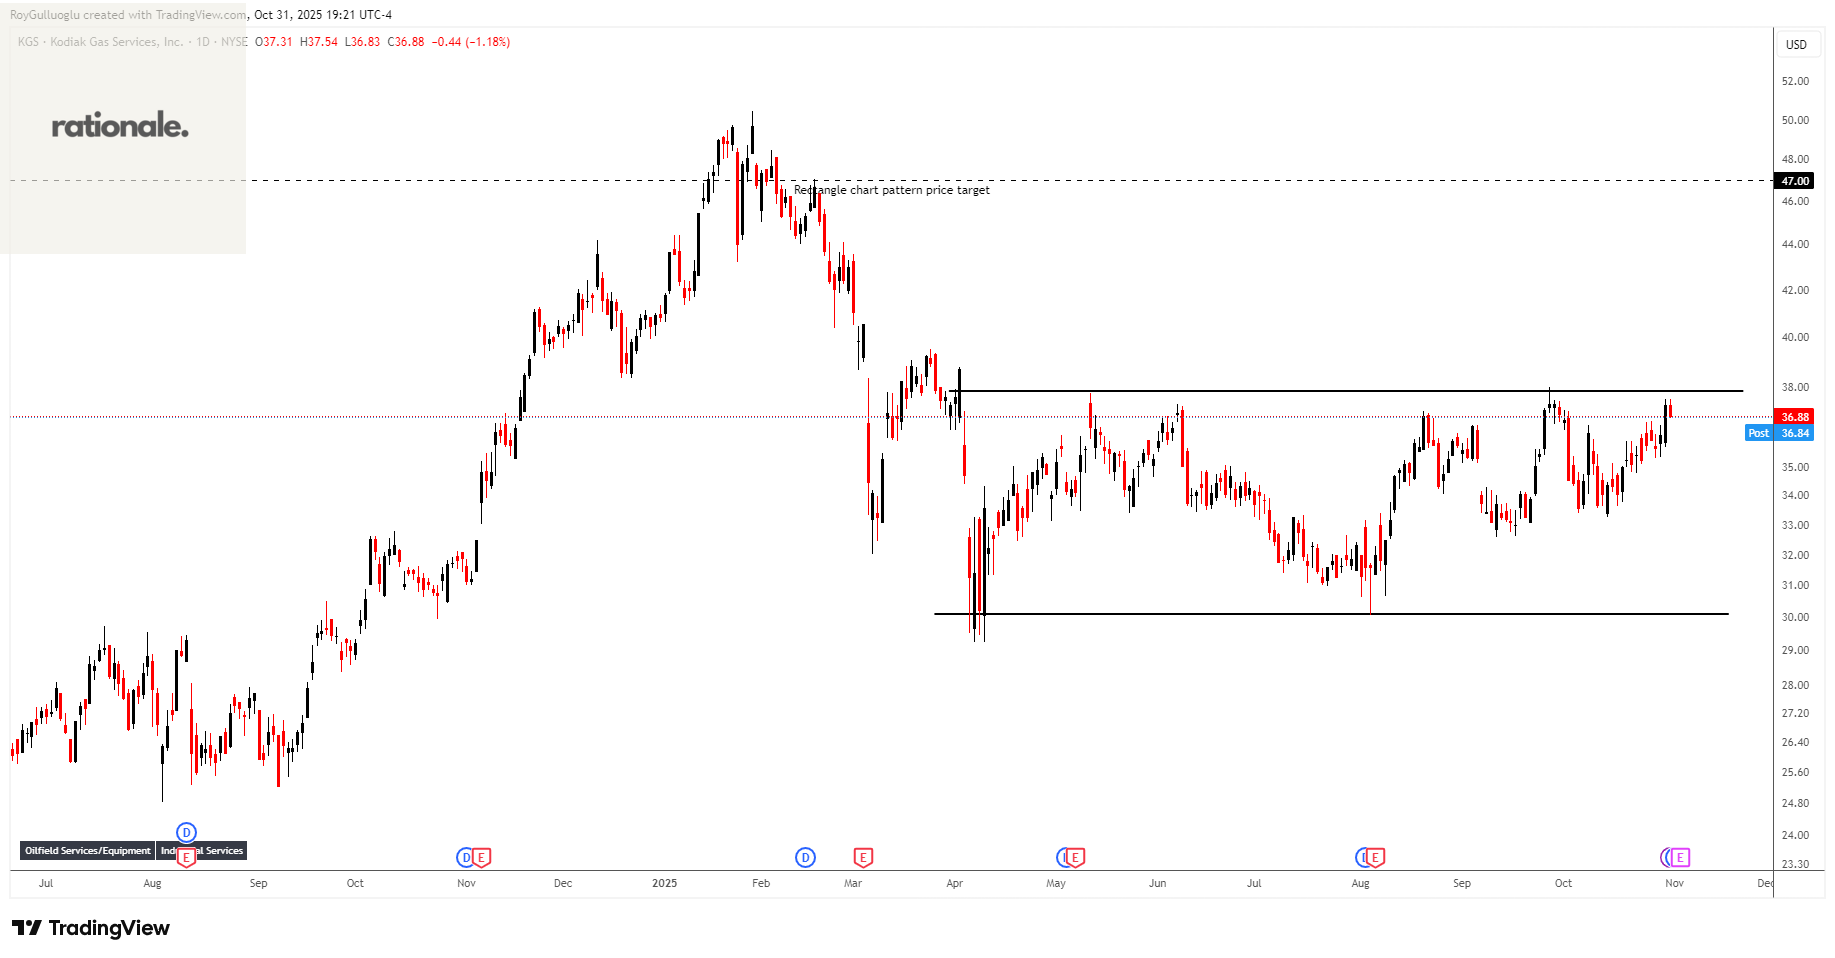
Kodiak Gas Services, Inc. operates contract compression infrastructure for customers in the oil and gas industry in the United States.
The above daily chart formed an approximately 5-month-long rectangle chart pattern as a bullish reversal after a downtrend.
Within this pattern, the horizontal boundary at 37.83 levels acts as a resistance.
A daily close above 38.96 levels would validate the breakout from the 5-month-long rectangle chart pattern.
Based on this chart pattern, the potential price target is 47 levels.
KGS, classified under the “energy” sector, falls under the “Mid Cap - Income” stock category.
MediaAlpha, Inc.-(MAX/NYSE)-Long Idea
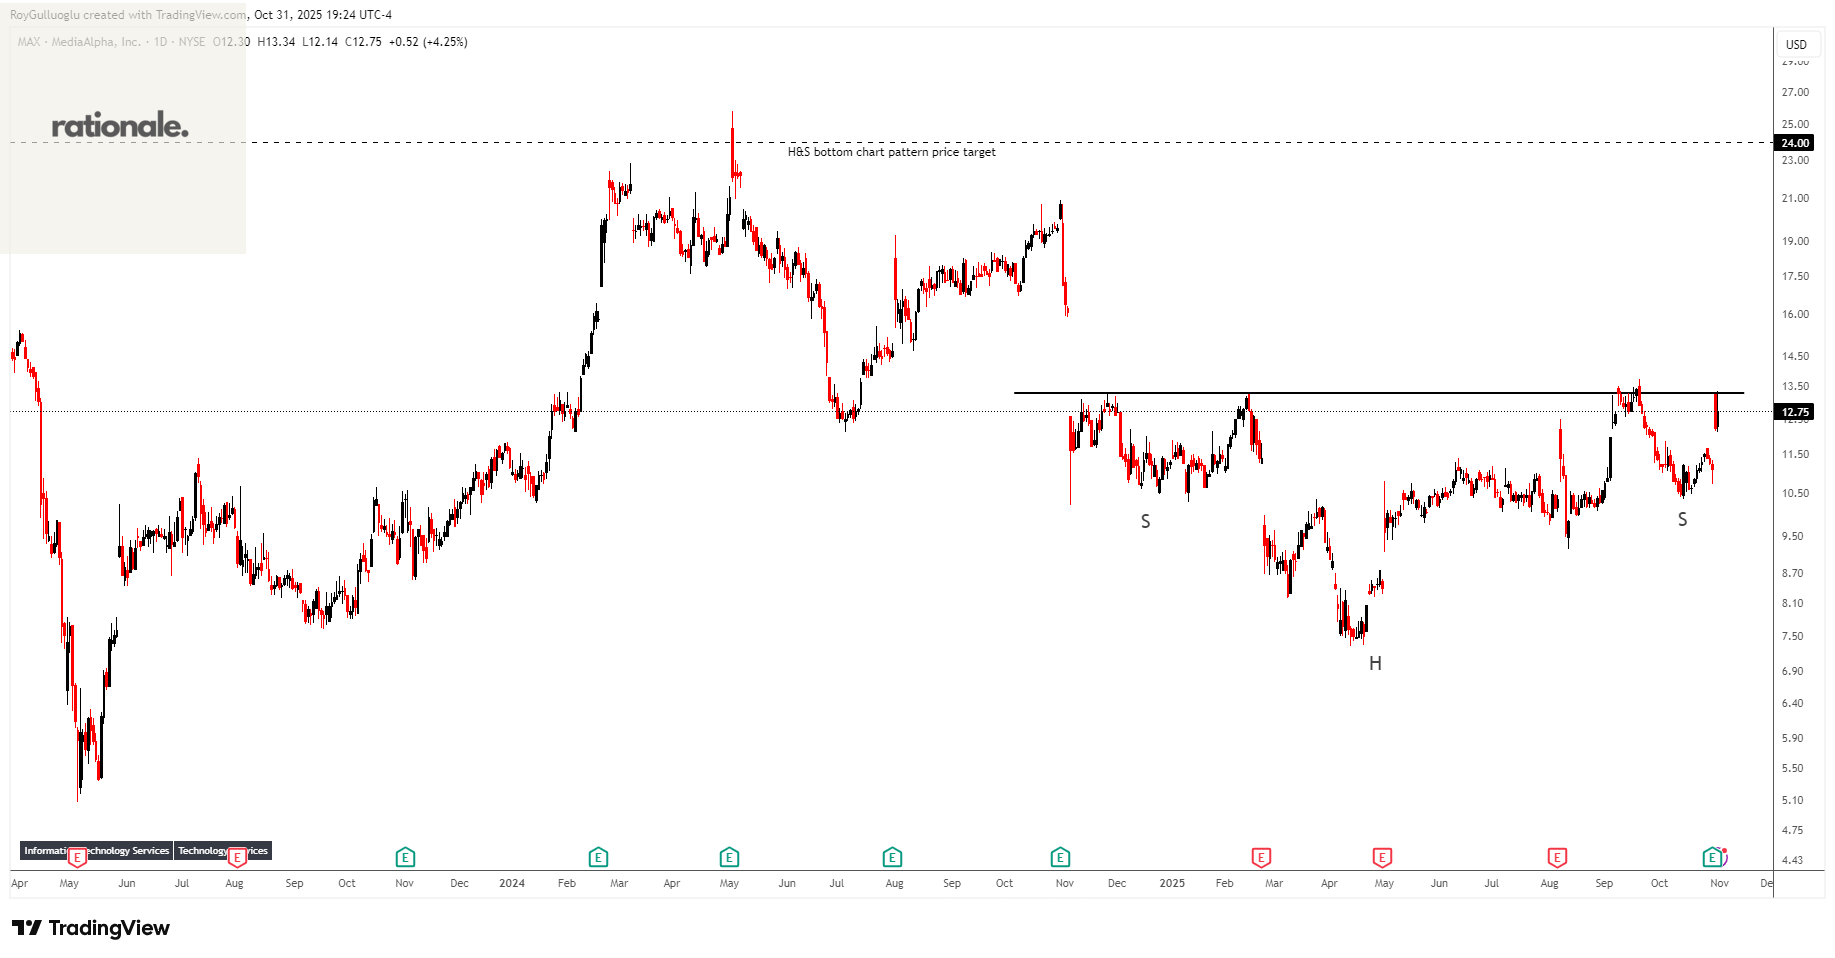
MediaAlpha, Inc., through its subsidiaries, operates an insurance customer acquisition platform in the United States.
The above daily chart formed an approximately 8-months-long H&S bottom chart pattern as a bullish reversal after a downtrend.
The boundary at 13.29 levels acts as a resistance within this pattern.
A daily close above 13.7 levels would validate the breakout from the 8-months-long H&S bottom chart pattern.
Based on this chart pattern, the potential price target is 24 levels.
MAX, classified under the “communication services” sector, falls under the “Small Cap - Growth” stock category.
Bilibili Inc.-(BILI/NASDAQ)-Long Idea
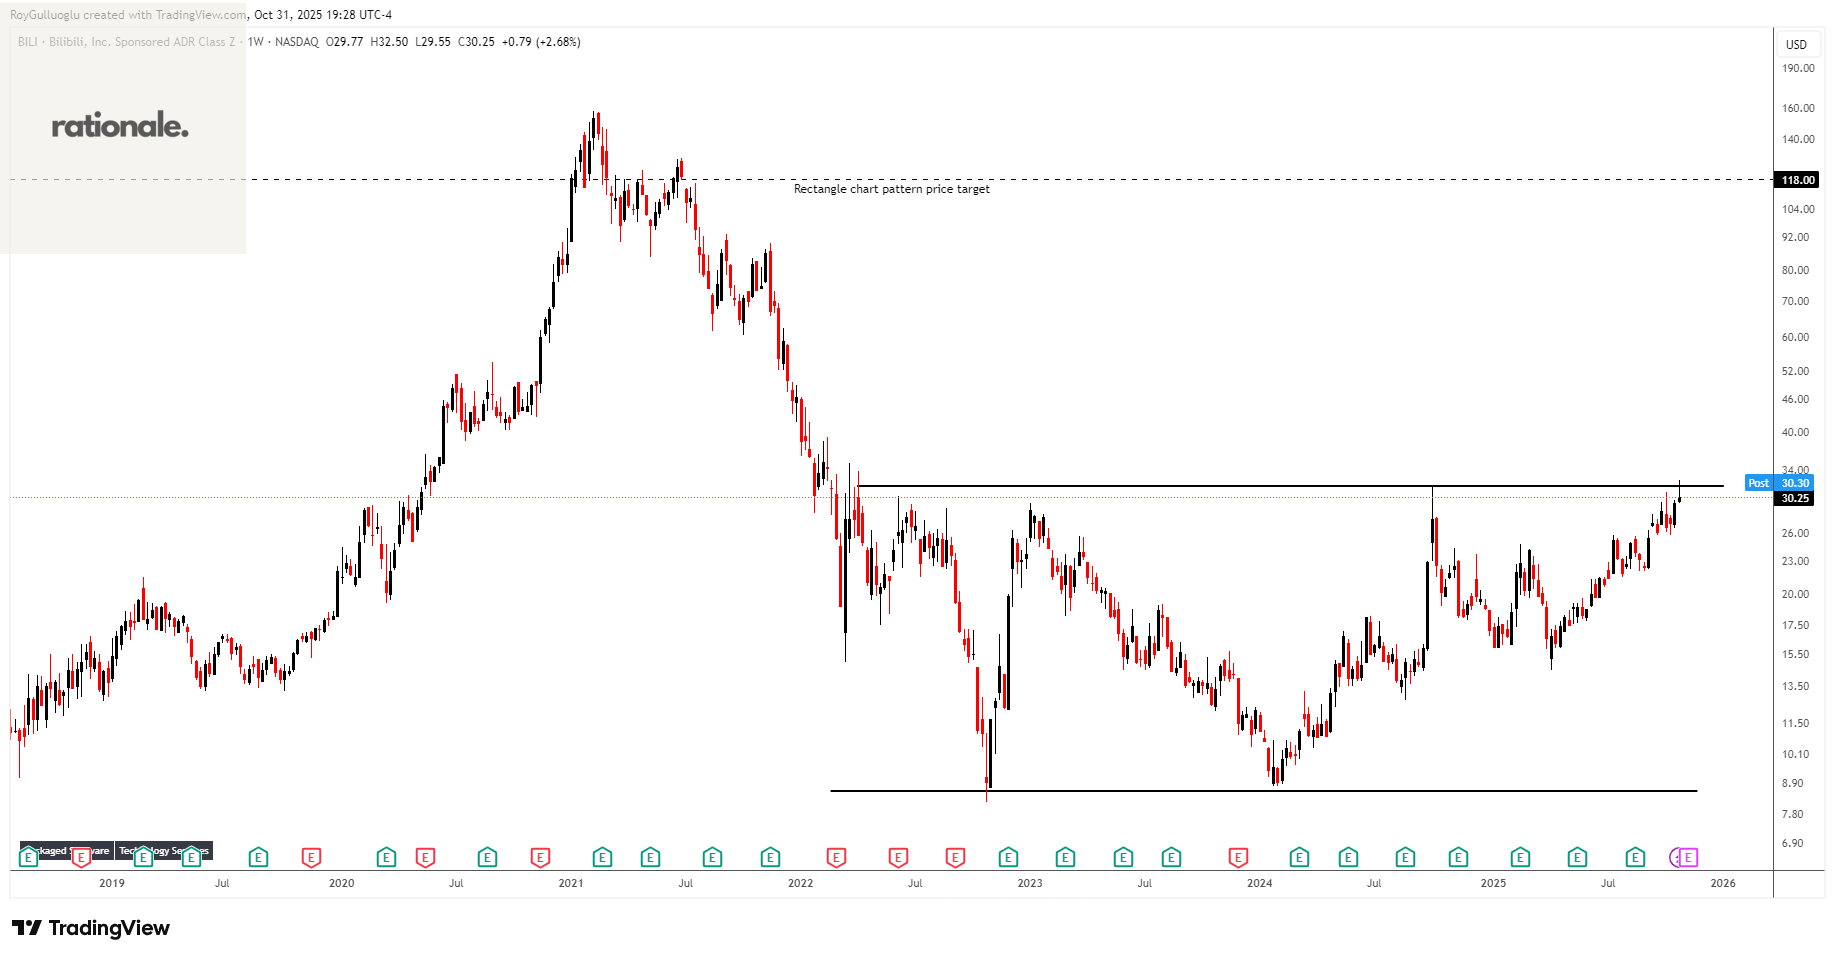
Bilibili Inc. provides online entertainment services for the young generations in the People’s Republic of China
The above weekly chart formed an approximately 40-month-long rectangle chart pattern as a bullish continuation after an uptrend.
The horizontal boundary at 31.7 levels acts as a resistance within this pattern.
A daily close above 32.65 levels would validate the breakout from the 40-month-long rectangle chart pattern.
Based on this chart pattern, the potential price target is 118 levels.
BILI, classified under the “communication services” sector, falls under the “Large Cap - Growth” stock category.
Teşekkürler Roy