

Trade Ideas Equities
ATEC(NASDAQ), LIVN(NASDAQ), HAFC(NASDAQ), SHC(NYSE), DAC(NYSE), CLBK(NASDAQ)

Alphatec Holdings, Inc.-(ATEC/NASDAQ)-Long Idea
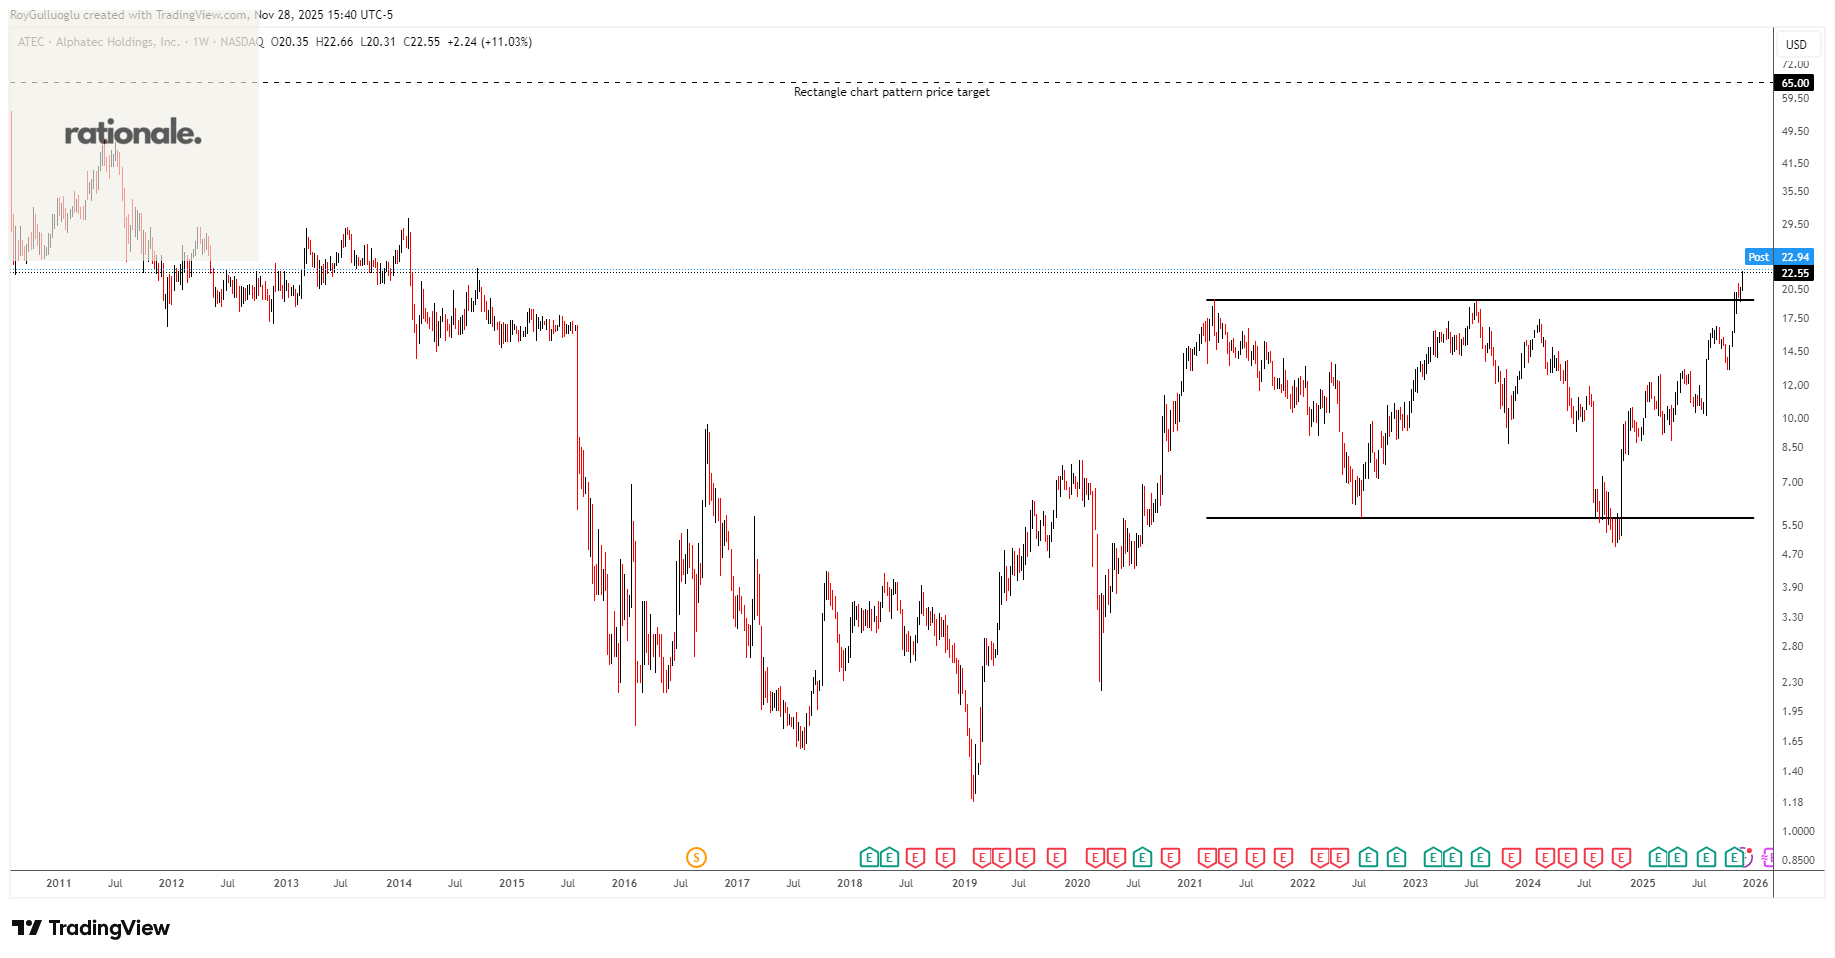
Alphatec Holdings, Inc., a medical technology company, designs, develops, and advances technologies for the surgical treatment of spinal disorders in the United States and internationally.
The above weekly chart formed an approximately 55-month-long rectangle chart pattern as a bullish continuation after an uptrend.
The horizontal boundary at 19.3 levels acted as a resistance within this pattern.
A daily close above 19.88 levels validated the breakout from the 55-month-long rectangle chart pattern.
Based on this chart pattern, the potential price target is 65 levels.
LivaNova PLC-(LIVN/NASDAQ)-Long Idea
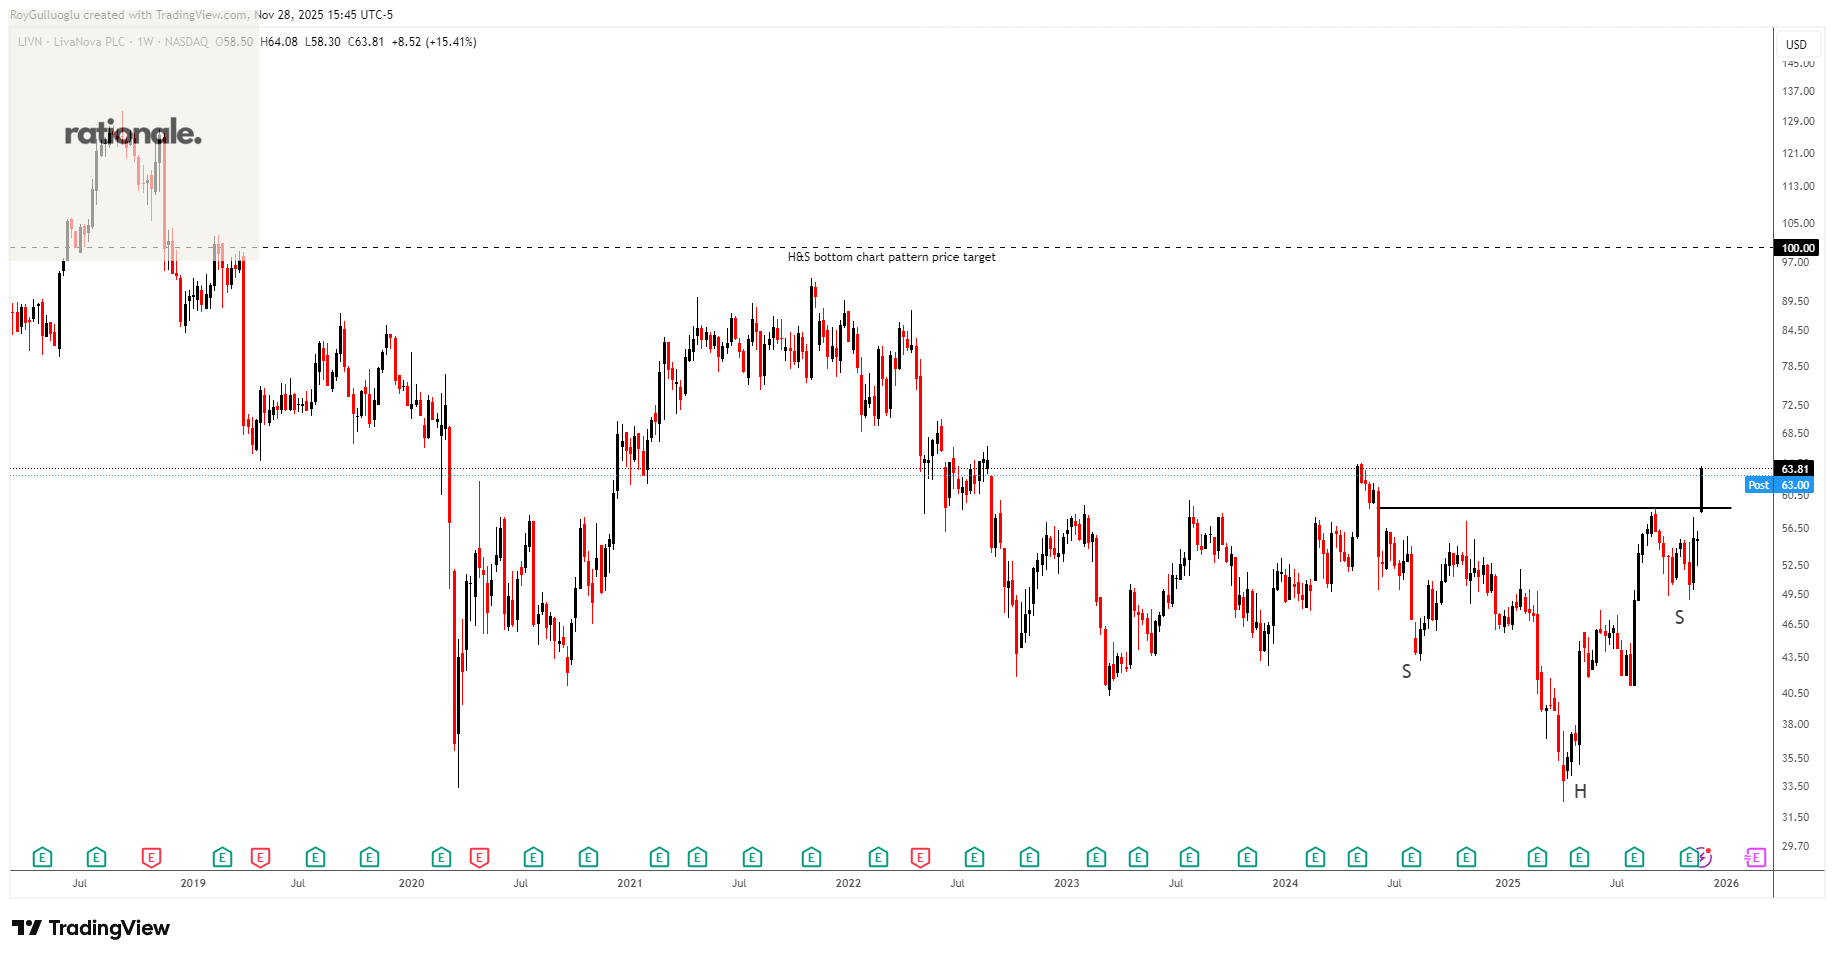
LivaNova PLC, a medical technology company, designs, develops, manufactures, markets, and sells products and therapies for neurological and cardiac conditions worldwide.
The above weekly chart formed an approximately 20-month-long H&S bottom chart pattern as a bullish reversal after a downtrend.
The horizontal boundary at 58.89 levels acted as a resistance within this pattern.
A daily close above 60.65 levels validated the breakout from the 20-month-long H&S bottom chart pattern.
Based on this chart pattern, the potential price target is 100 levels.
Hanmi Financial Corporation-(HAFC/NASDAQ)-Long Idea
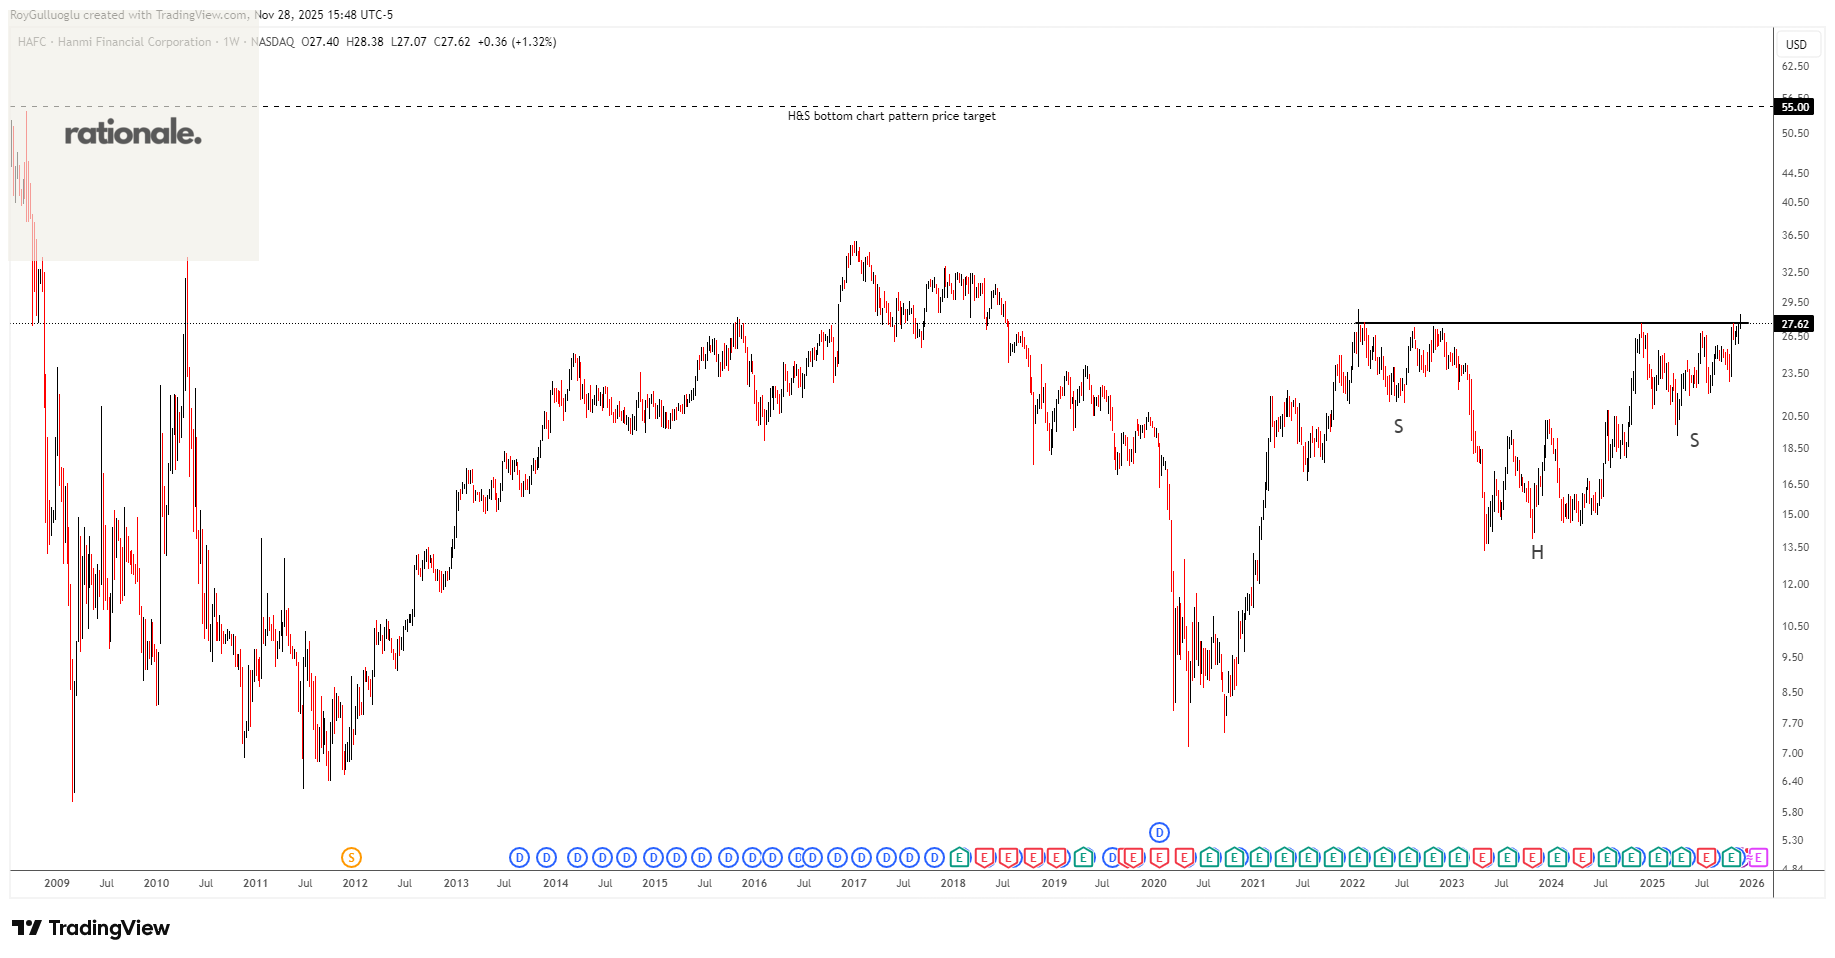
Hanmi Financial Corporation operates as the holding company for Hanmi Bank that provides business banking products and services in the United States.
The above weekly chart formed an approximately 45-month-long H&S bottom chart pattern as a bullish reversal after a downtrend.
The horizontal boundary at 27.6 levels acts as a resistance within this pattern.
A daily close above 28.4 levels would validate the breakout from the 45-month-long H&S bottom chart pattern.
Based on this chart pattern, the potential price target is 55 levels.
Sotera Health Company-(SHC/NYSE)-Long Idea
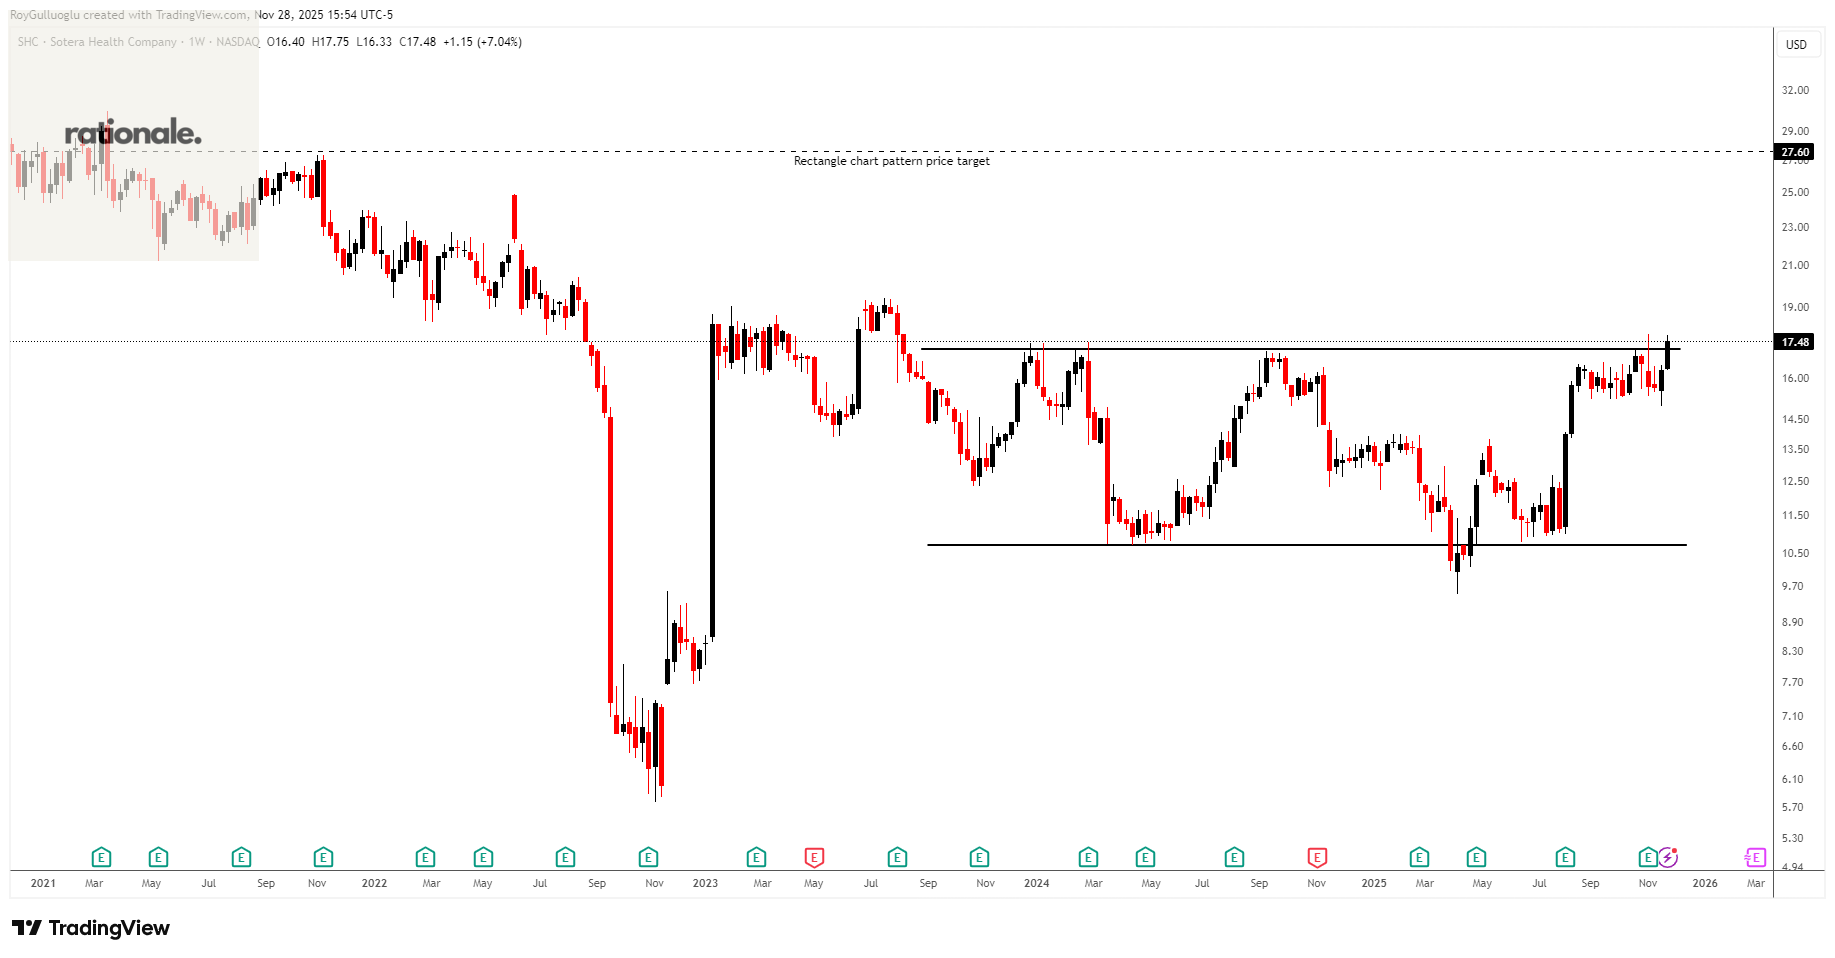
Sotera Health Company provides sterilization, lab testing, and advisory services for the healthcare industry in the United States, Canada, Europe, and internationally.
The above weekly chart formed an approximately 25-month-long rectangle chart pattern as a bullish continuation after an uptrend.
The horizontal boundary at 17.17 levels acts as a resistance within this pattern.
A daily close above 17.68 levels would validate the breakout from the 55-month-long rectangle chart pattern.
Based on this chart pattern, the potential price target is 27.6 levels.
Danaos Corporation-(DAC/NYSE)-Long Idea
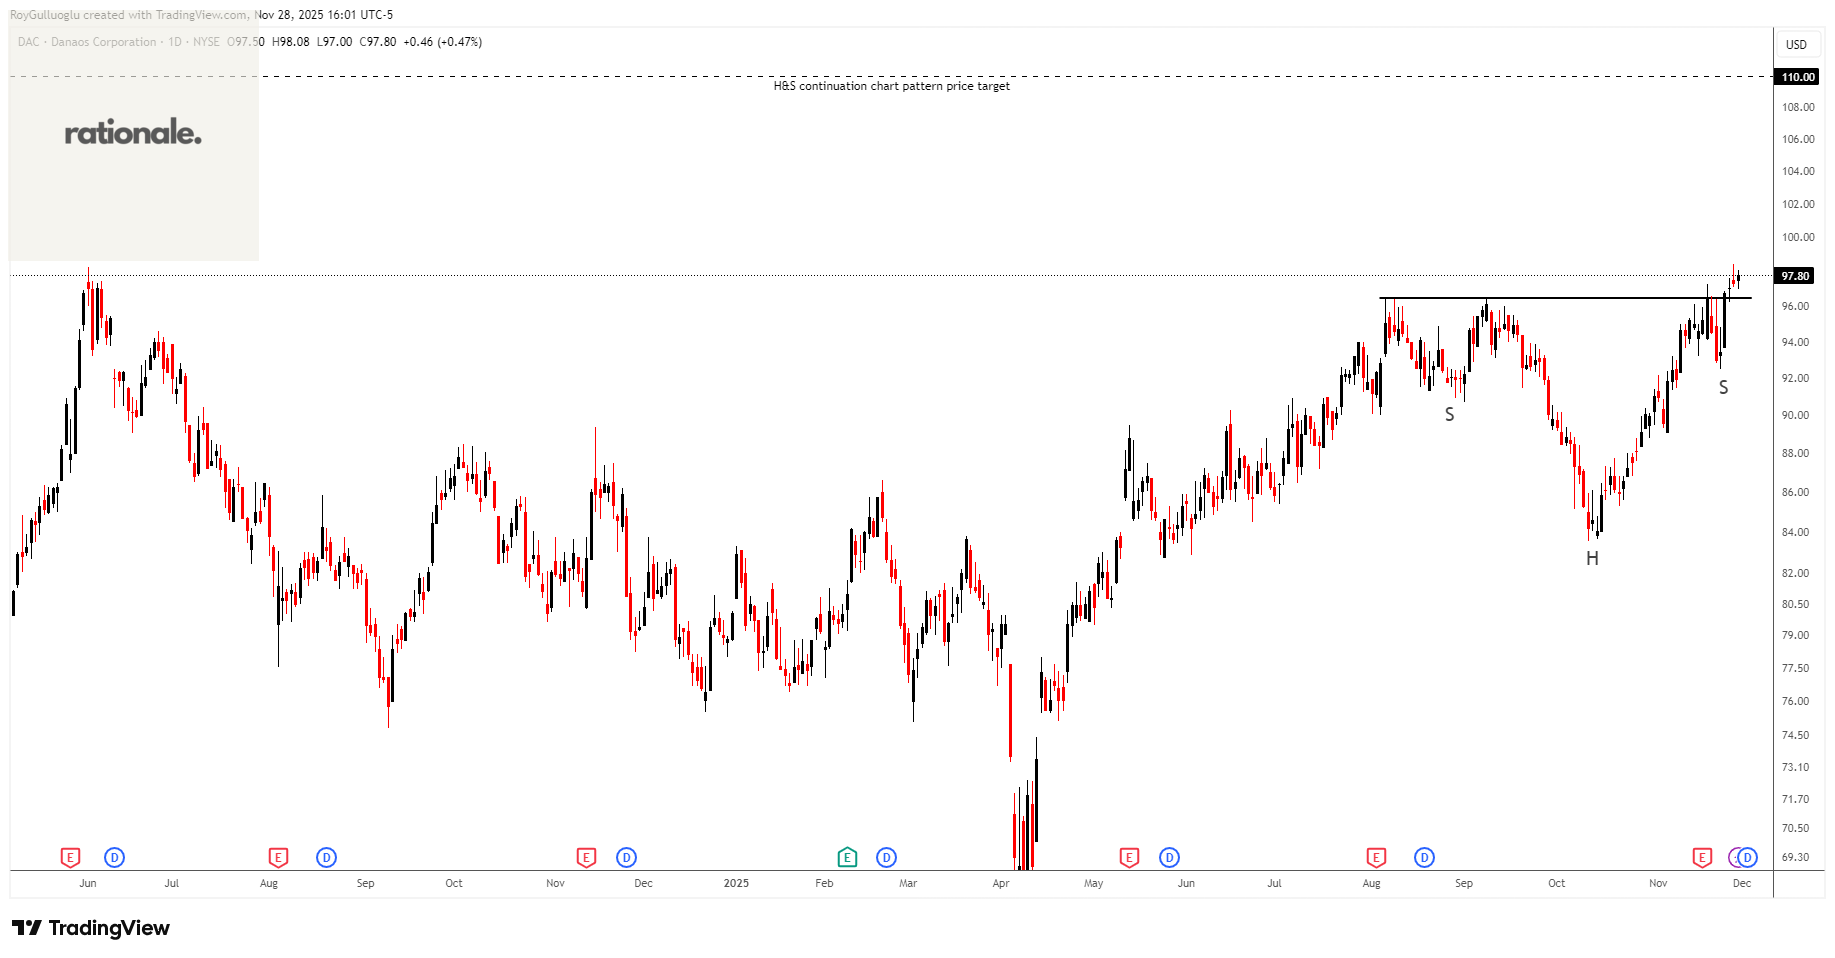
Danaos Corporation, through its subsidiaries, owns and operates containerships and drybulk vessels in Australia, Europe, and the United States.
The above daily chart formed an approximately 3-month-long H&S continuation chart pattern as a bullish continuation after an uptrend.
The horizontal boundary at 96.47 levels acts as a resistance within this pattern.
A daily close above 99.36 levels would validate the breakout from the 3-month-long H&S continuation chart pattern.
Based on this chart pattern, the potential price target is 110 levels.
Columbia Financial, Inc.-(CLBK/NASDAQ)-Long Idea
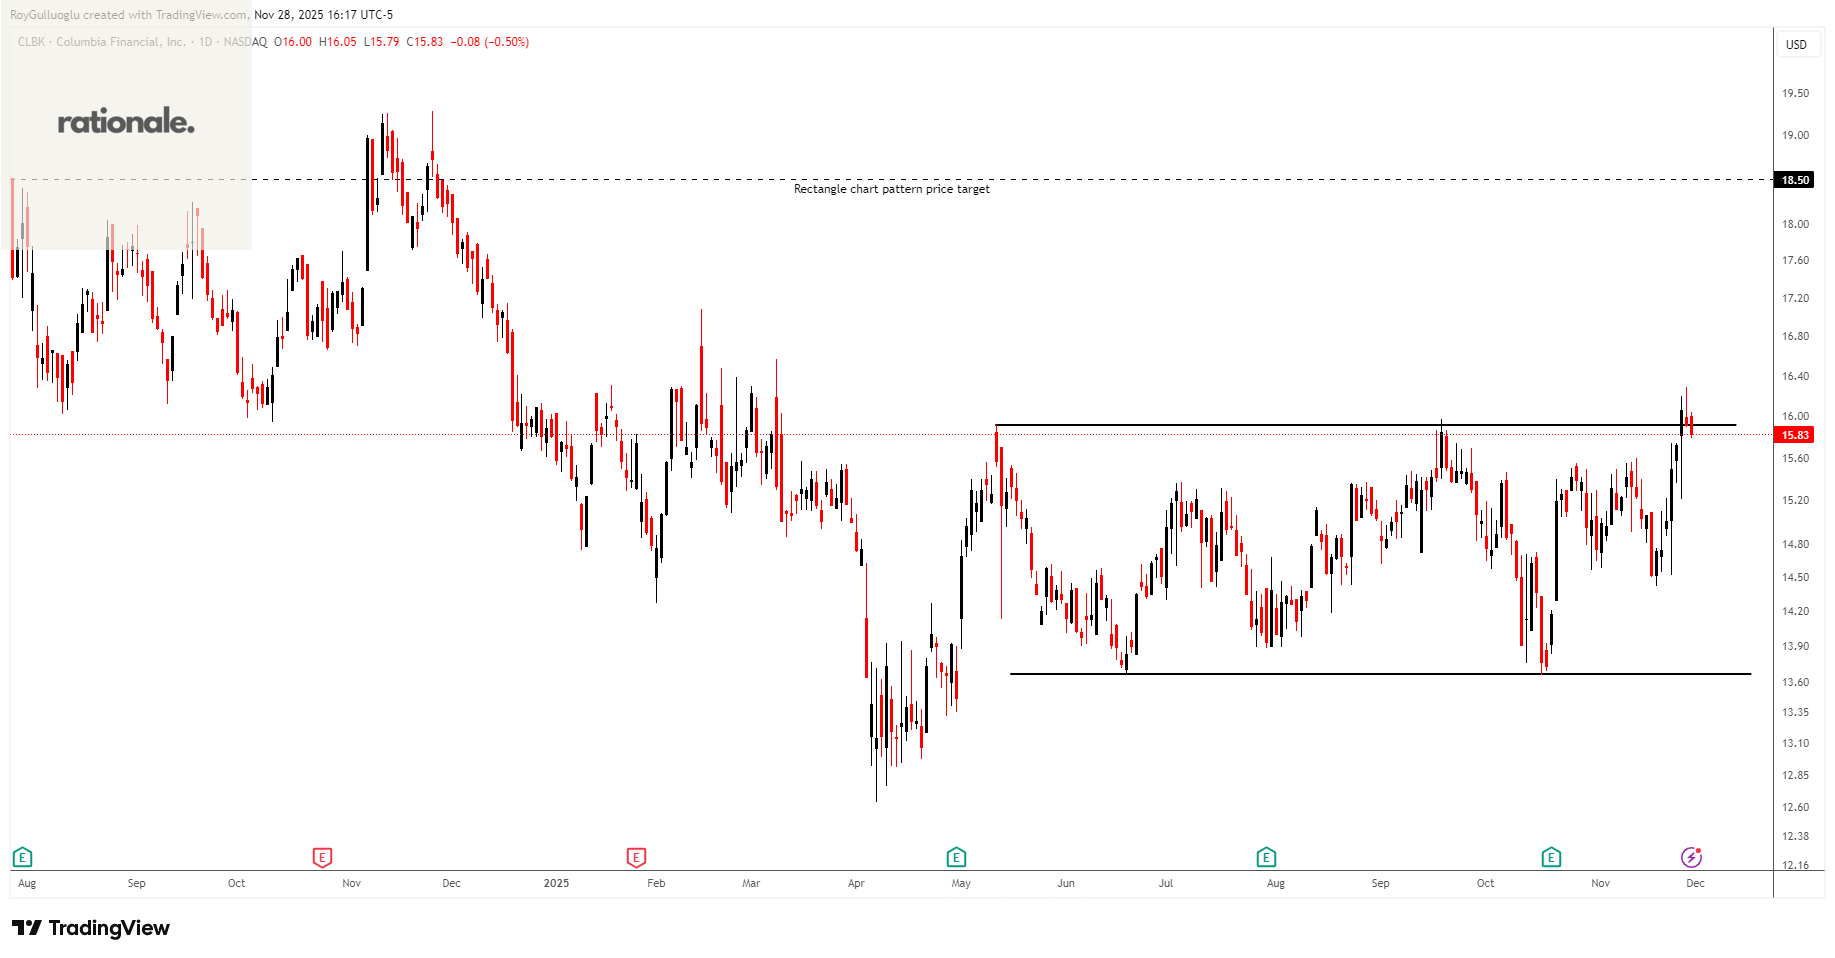
Columbia Financial, Inc. operates as a bank holding company for Columbia Bank that provides banking and other financial services to businesses and consumers in the United States.
The above daily chart formed an approximately 5-month-long rectangle chart pattern as a bullish continuation after an uptrend.
The horizontal boundary at 15.91 levels acts as a resistance within this pattern.
A daily close above 16.38 levels would validate the breakout from the 5-month-long rectangle chart pattern.
Based on this chart pattern, the potential price target is 18.5 levels.