

Trade Ideas Equities
TWIN(NASDAQ), FRO(NYSE), ERO(TSX), TRENT(NSE), SWSOLAR(NSE), LLOY(LSE), NWG(LSE), IMI(LSE)

Twin Disc, Incorporated-(TWIN/NASDAQ)-Long Idea
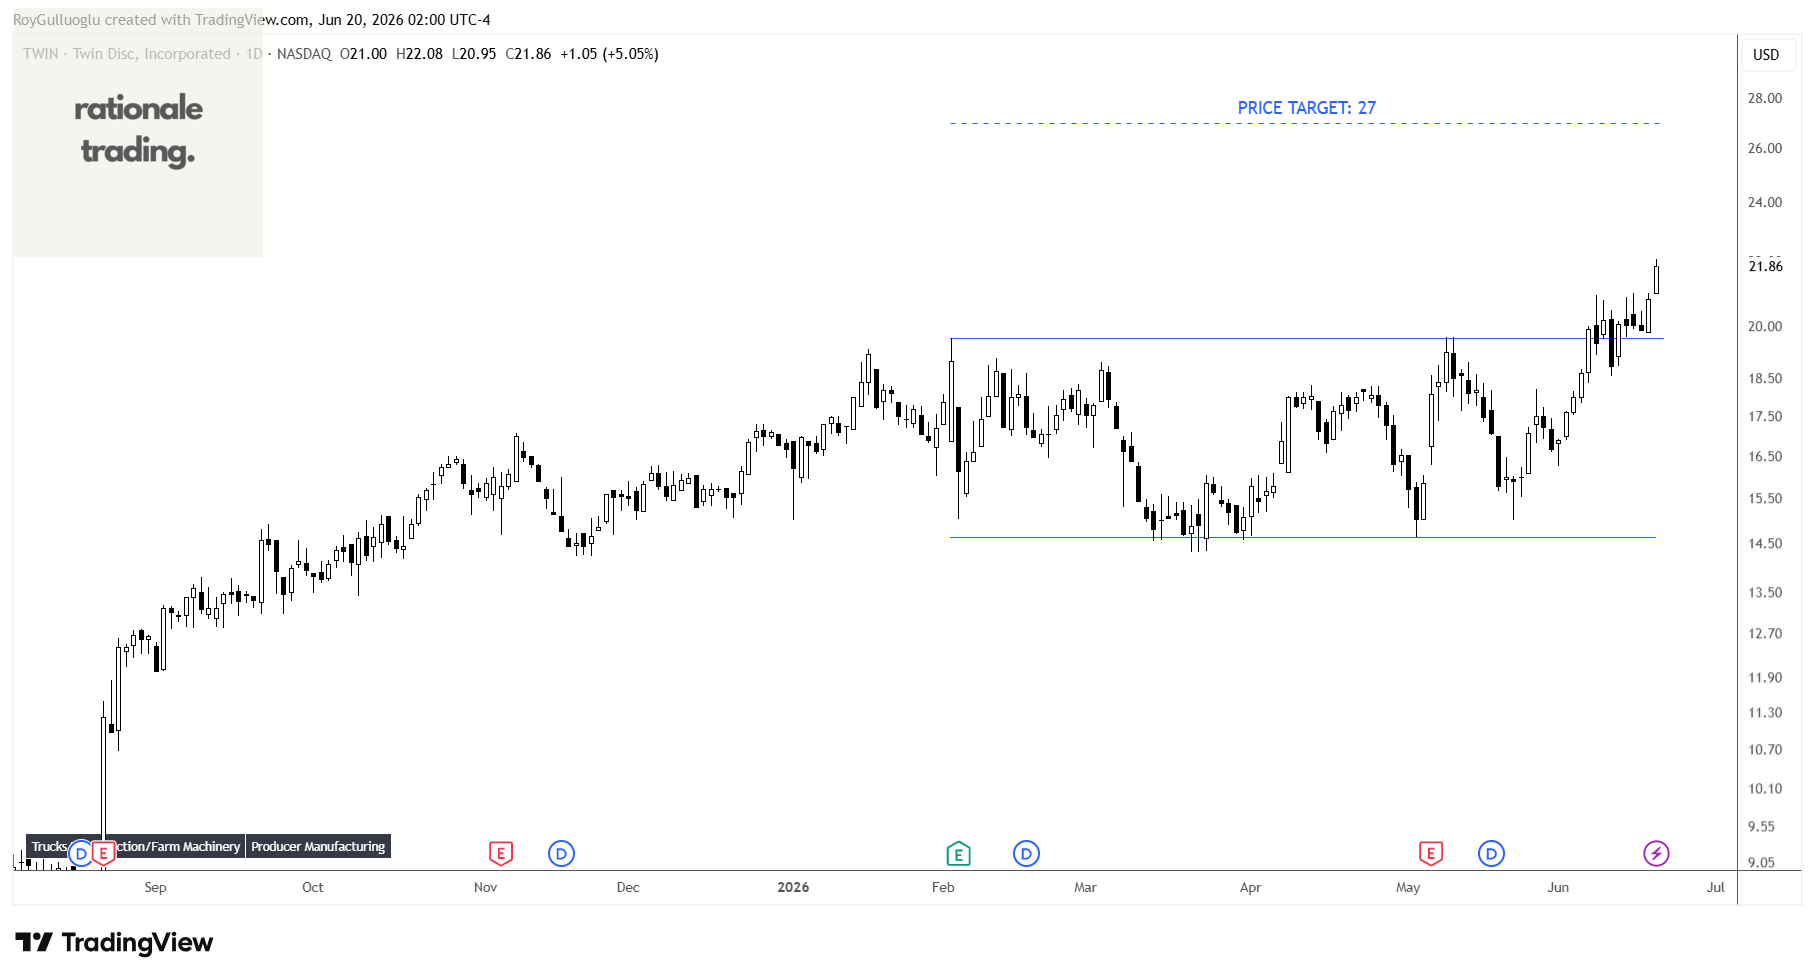
Twin Disc, Incorporated engages in the design, manufacture, and sale of marine and heavy duty off-highway power transmission equipment in the United States, the Netherlands, China, Australia, Finland, Italy, and internationally.
The above daily chart formed an approximately 3-month-long rectangle chart pattern as a bullish continuation after an uptrend.
The horizontal boundary at 19.63 levels acted as a resistance within this pattern.
A daily close above 20.22 levels validated the breakout from the 3-month-long rectangle chart pattern.
Based on this chart pattern, the potential price target is 27 levels.
Frontline plc-(FRO/NYSE)-Long Idea
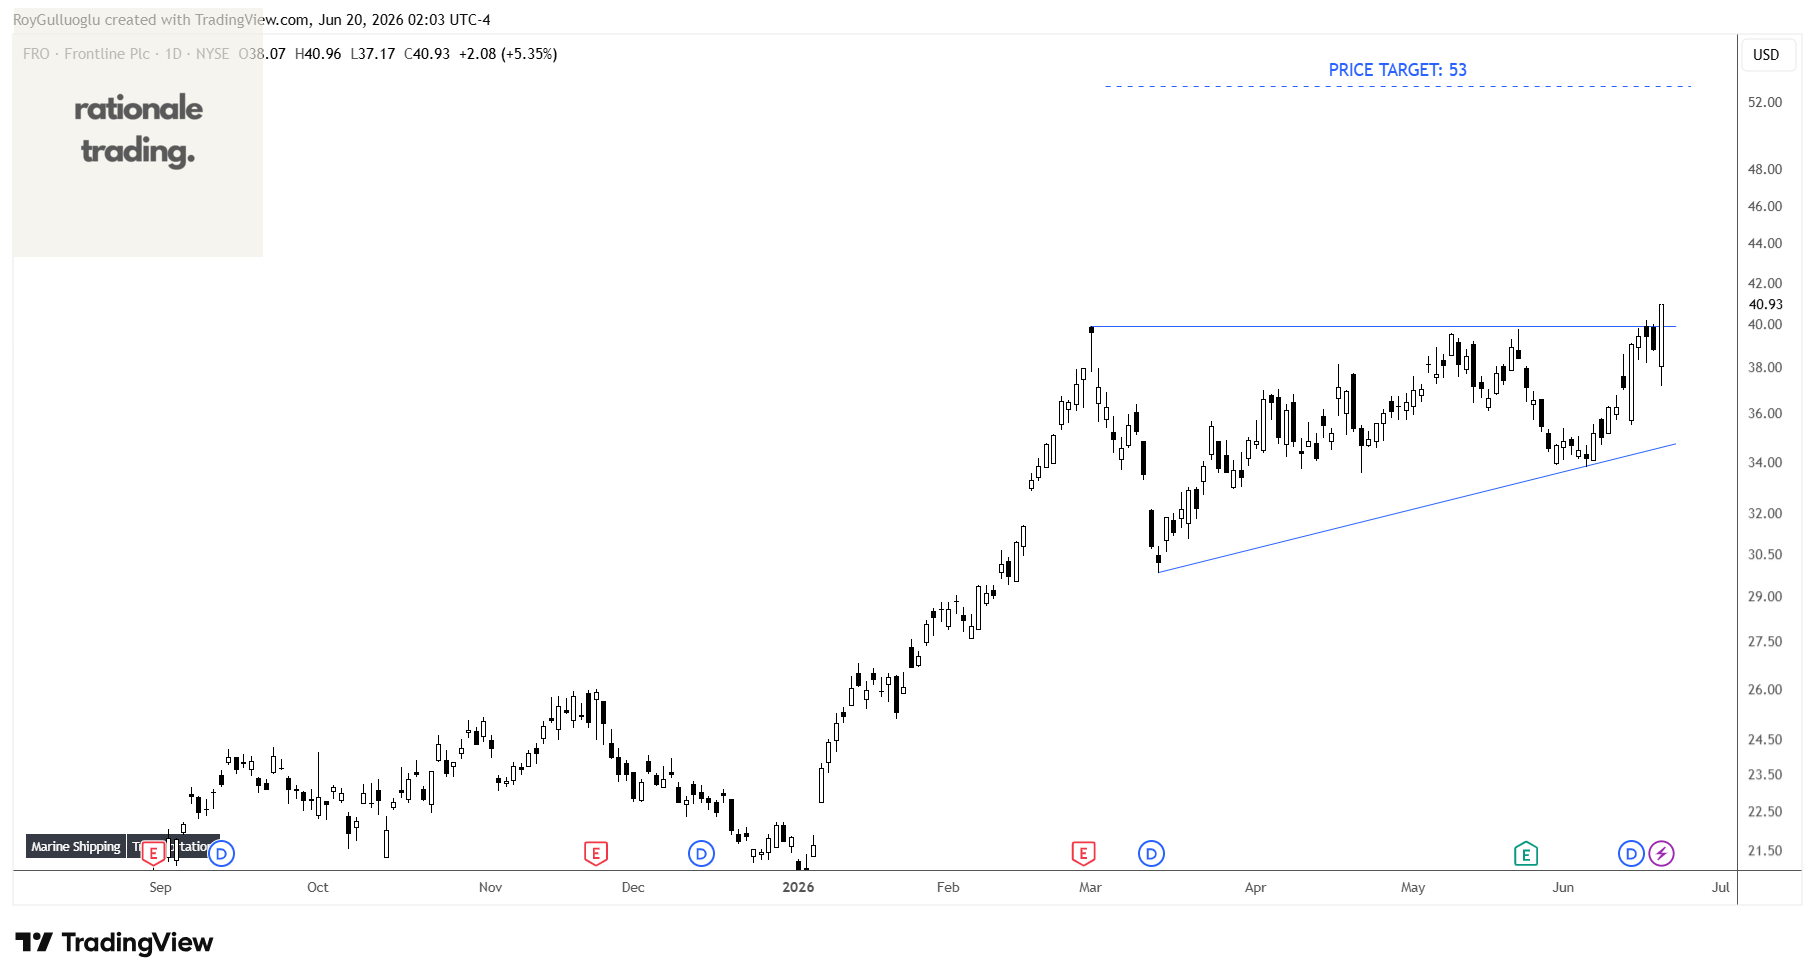
Frontline plc, a shipping company, engages in the ownership and operation of oil and product tankers worldwide.
The above daily chart formed an approximately 3-month-long ascending triangle chart pattern as a bullish continuation after an uptrend.
The horizontal boundary at 39.89 levels acts as a resistance within this pattern.
A daily close above 41 levels would validate the breakout from the 3-month-long ascending triangle chart pattern.
Based on this chart pattern, the potential price target is 53 levels.
Ero Copper Corp.-(ERO/TSX)-Long Idea
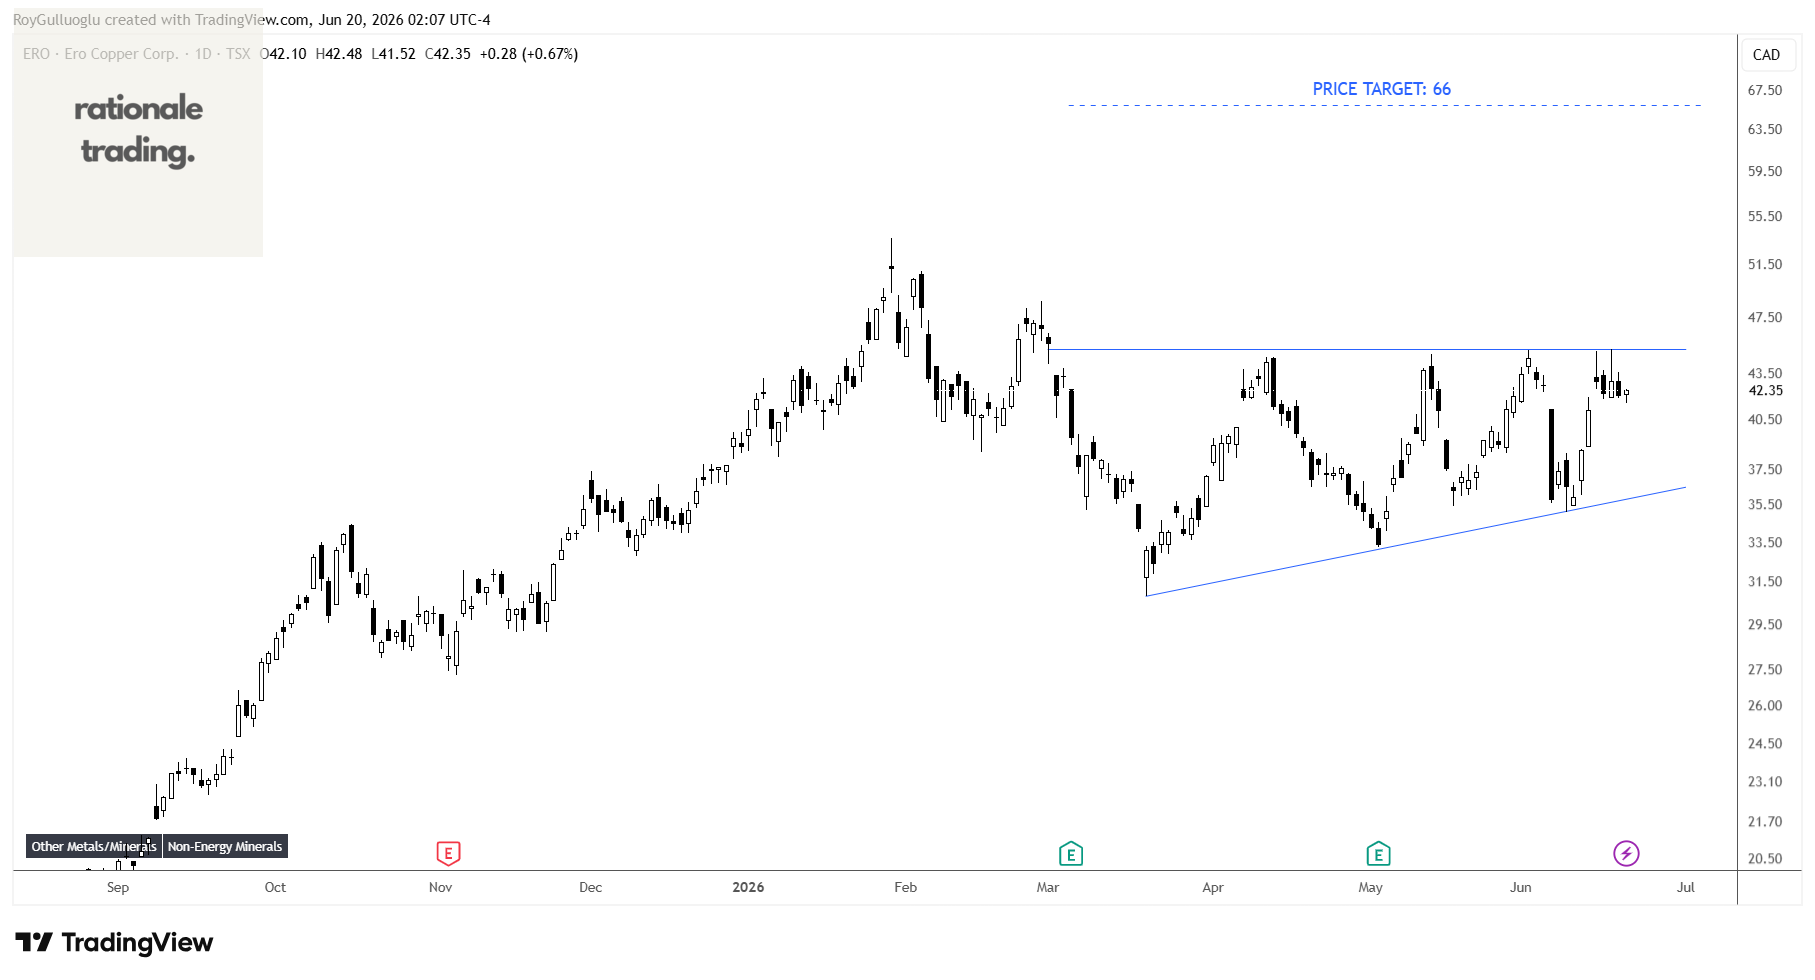
Ero Copper Corp. engages in the exploration, development, and production of mining projects in Brazil.
The above daily chart formed an approximately 3-month-long ascending triangle chart pattern as a bullish reversal after a downtrend.
Within this pattern, the horizontal boundary at 45.2 levels acts as a resistance.
A daily close above 46.55 levels would validate the breakout from the 3-month-long ascending triangle chart pattern.
Based on this chart pattern, the potential price target is 66 levels.
Trent Limited-(TRENT/NSE)-Long Idea
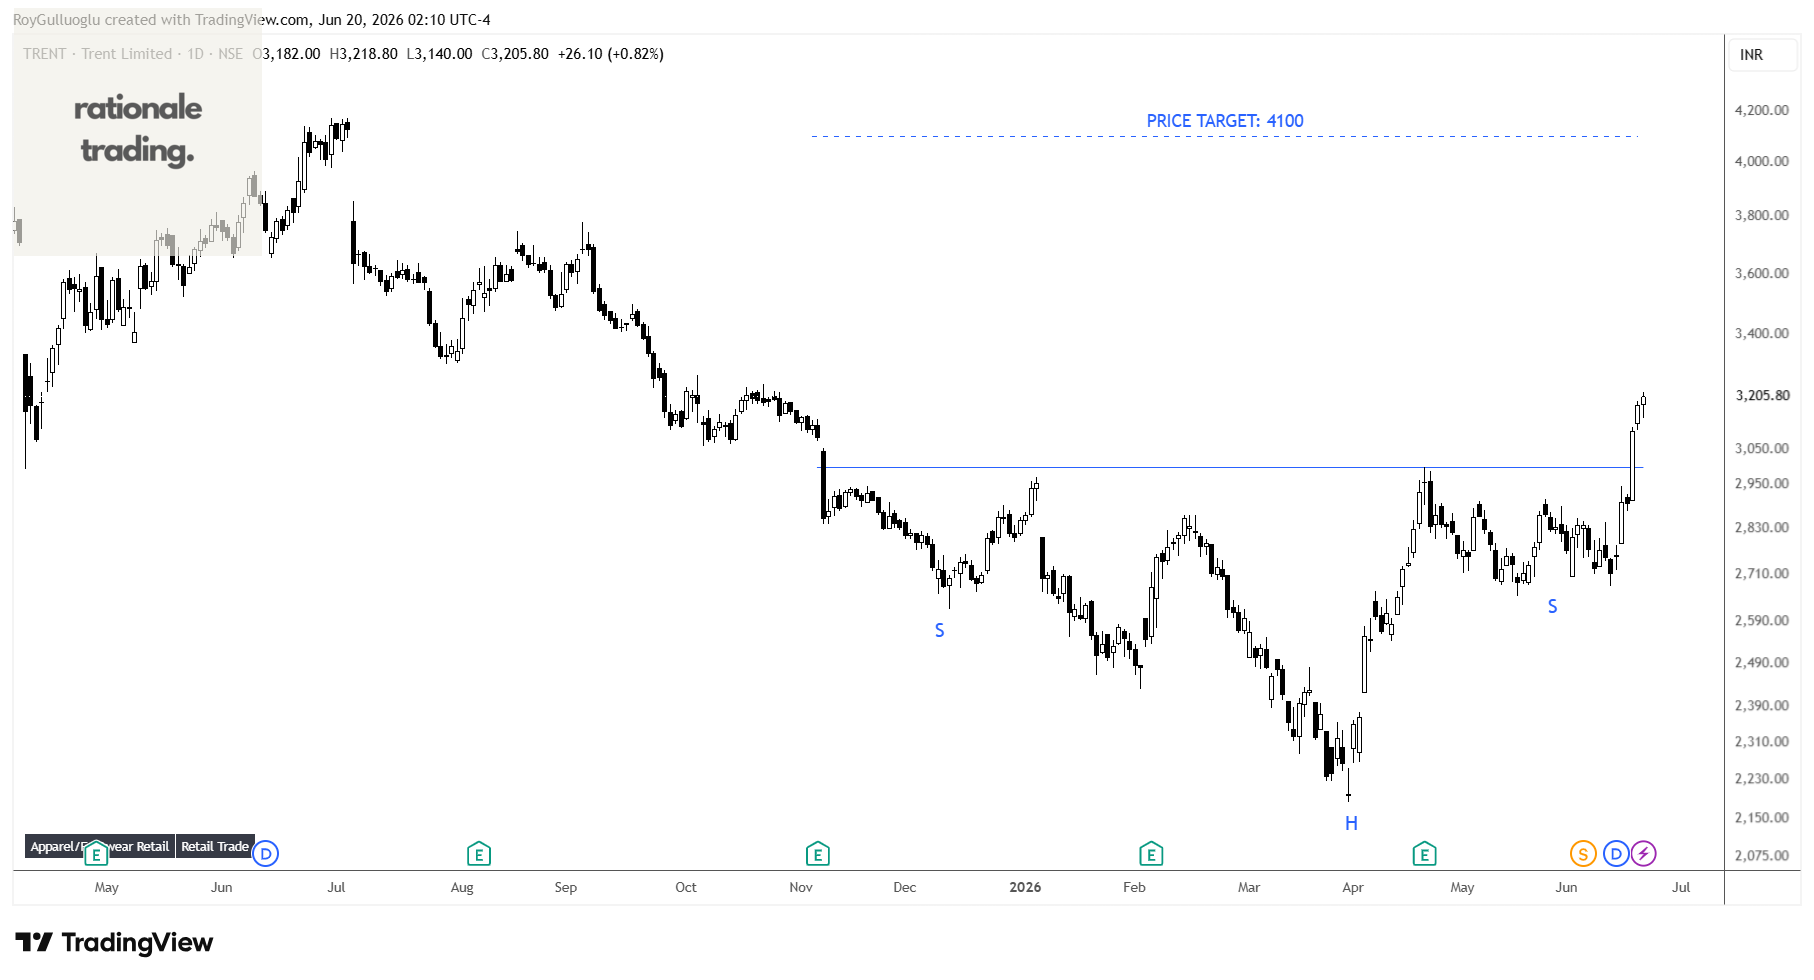
Trent Limited engages in the retailing and trading of apparels, footwear, accessories, food, grocery, and non-food products in India.
The above daily chart formed an approximately 5-month-long H&S bottom chart pattern as a bullish reversal after a downtrend.
Within this pattern, the horizontal boundary at 2998.65 levels acted as a resistance.
A daily close above 3100 levels validated the breakout from the 5-month-long H&S bottom chart pattern .
Based on this chart pattern, the potential price target is 4100 levels.
Sterling and Wilson Renewable Energy Limited-(SWSOLAR/NSE)-Long Idea
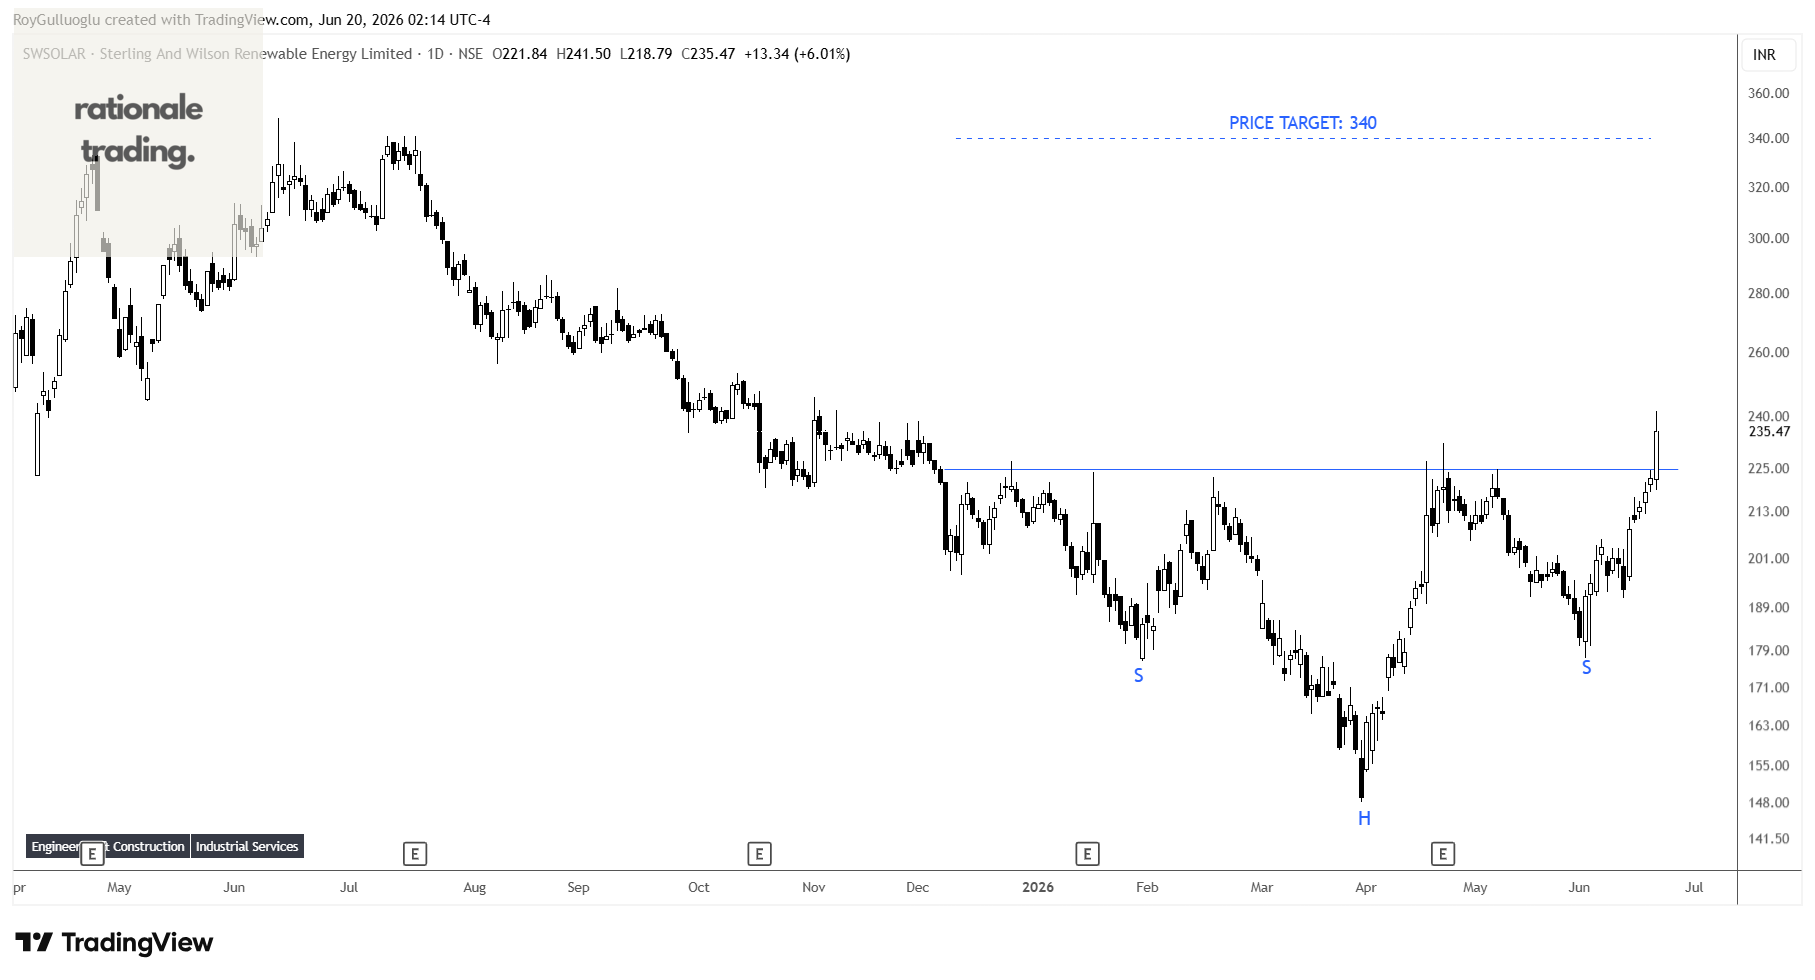
Sterling and Wilson Renewable Energy Limited provides renewable engineering, procurement, and construction (EPC) services in India, Europe, the Middle East, North Africa, rest of Africa, the United States, Latin America, and Australia
The above daily chart formed an approximately 4-month-long H&S bottom chart pattern as a bullish reversal after a downtrend.
The horizontal boundary at 224.7 levels acted as a resistance within this pattern.
A daily close above 231.44 levels validated the breakout from the 4-month-long H&S bottom chart pattern.
Based on this chart pattern, the potential price target is 340 levels.
Lloyds Banking Group plc-(LLOY/LSE)-Long Idea
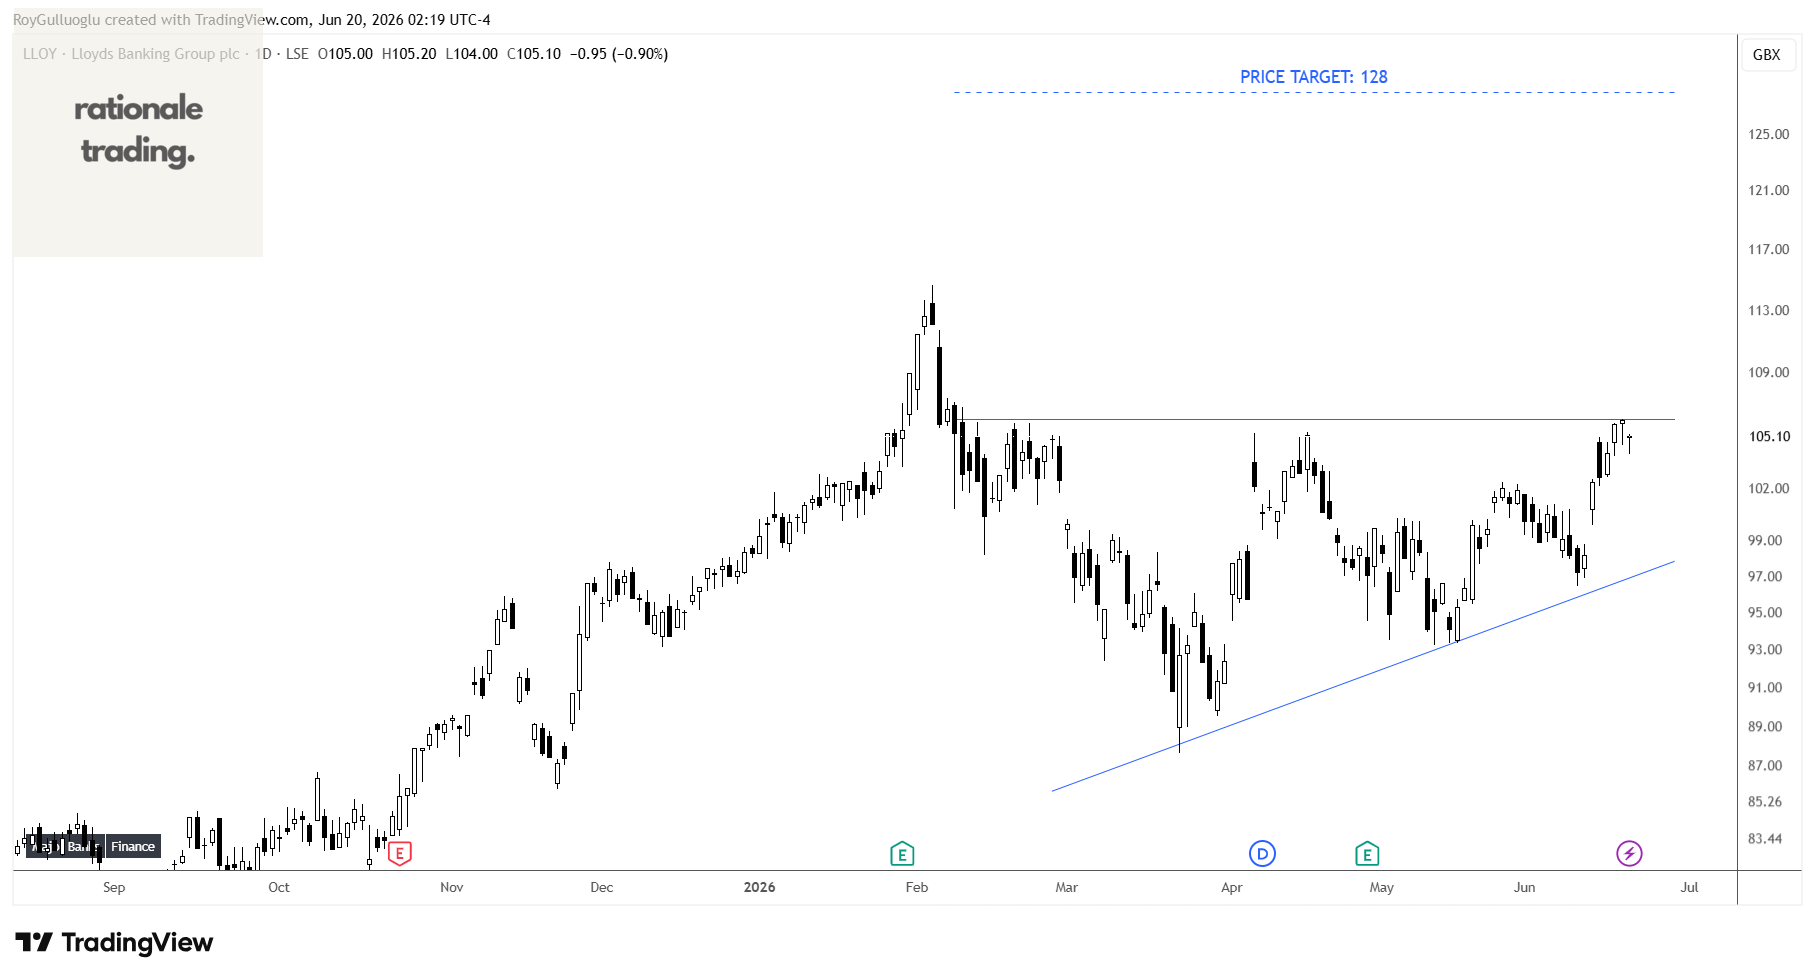
Lloyds Banking Group plc, together with its subsidiaries, provides a range of banking and financial products and services for retail and commercial customers in the United Kingdom.
The above daily chart formed an approximately 3-month-long ascending triangle chart pattern as a bullish reversal after a downtrend.
Within this pattern, the horizontal boundary at 106.1 levels acts as a resistance.
A daily close above 109.2 levels would validate the breakout from the 3-month-long ascending triangle chart pattern.
Based on this chart pattern, the potential price target is 128 levels.
NatWest Group plc-(NWG/LSE)-Long Idea
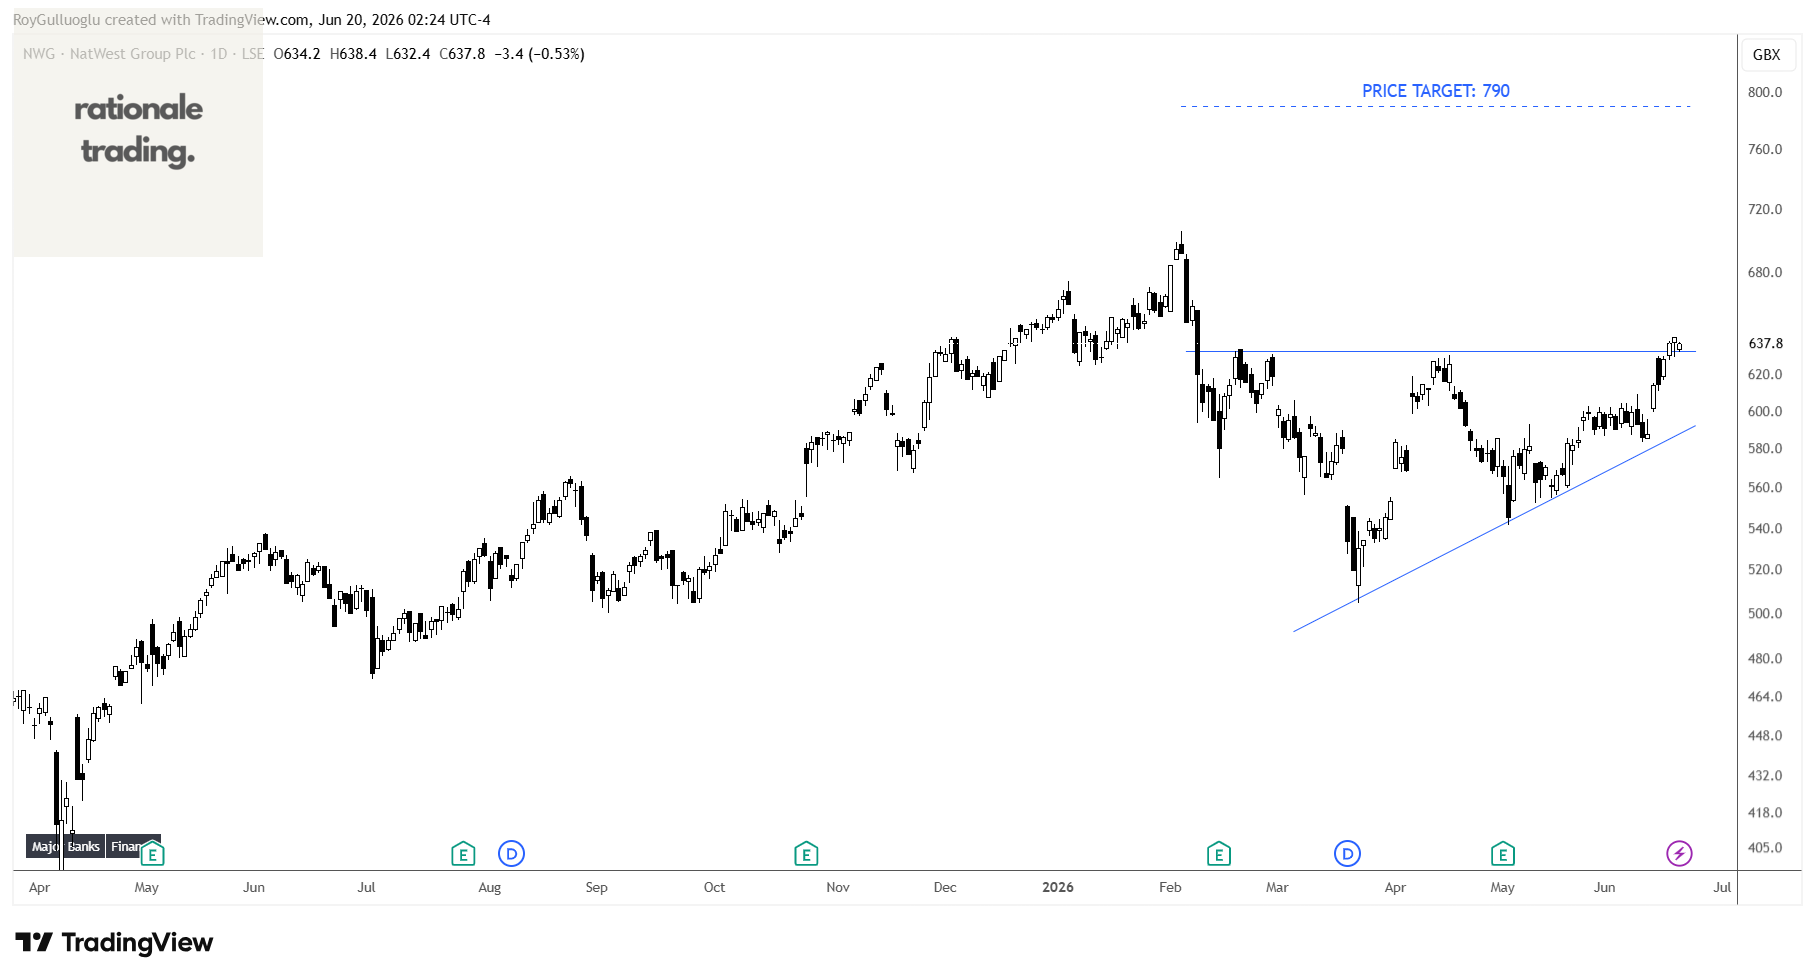
NatWest Group plc, together with its subsidiaries, provides banking and financial products and services in the United Kingdom and internationally.
The above daily chart formed an approximately 3-month-long ascending triangle chart pattern as a bullish reversal after a downtrend.
Within this pattern, the horizontal boundary at 633.2 levels acts as a resistance.
A daily close above 652.2 levels would validate the breakout from the 3-month-long ascending triangle chart pattern.
Based on this chart pattern, the potential price target is 790 levels.
IMI plc-(IMI/LSE)-Long Idea
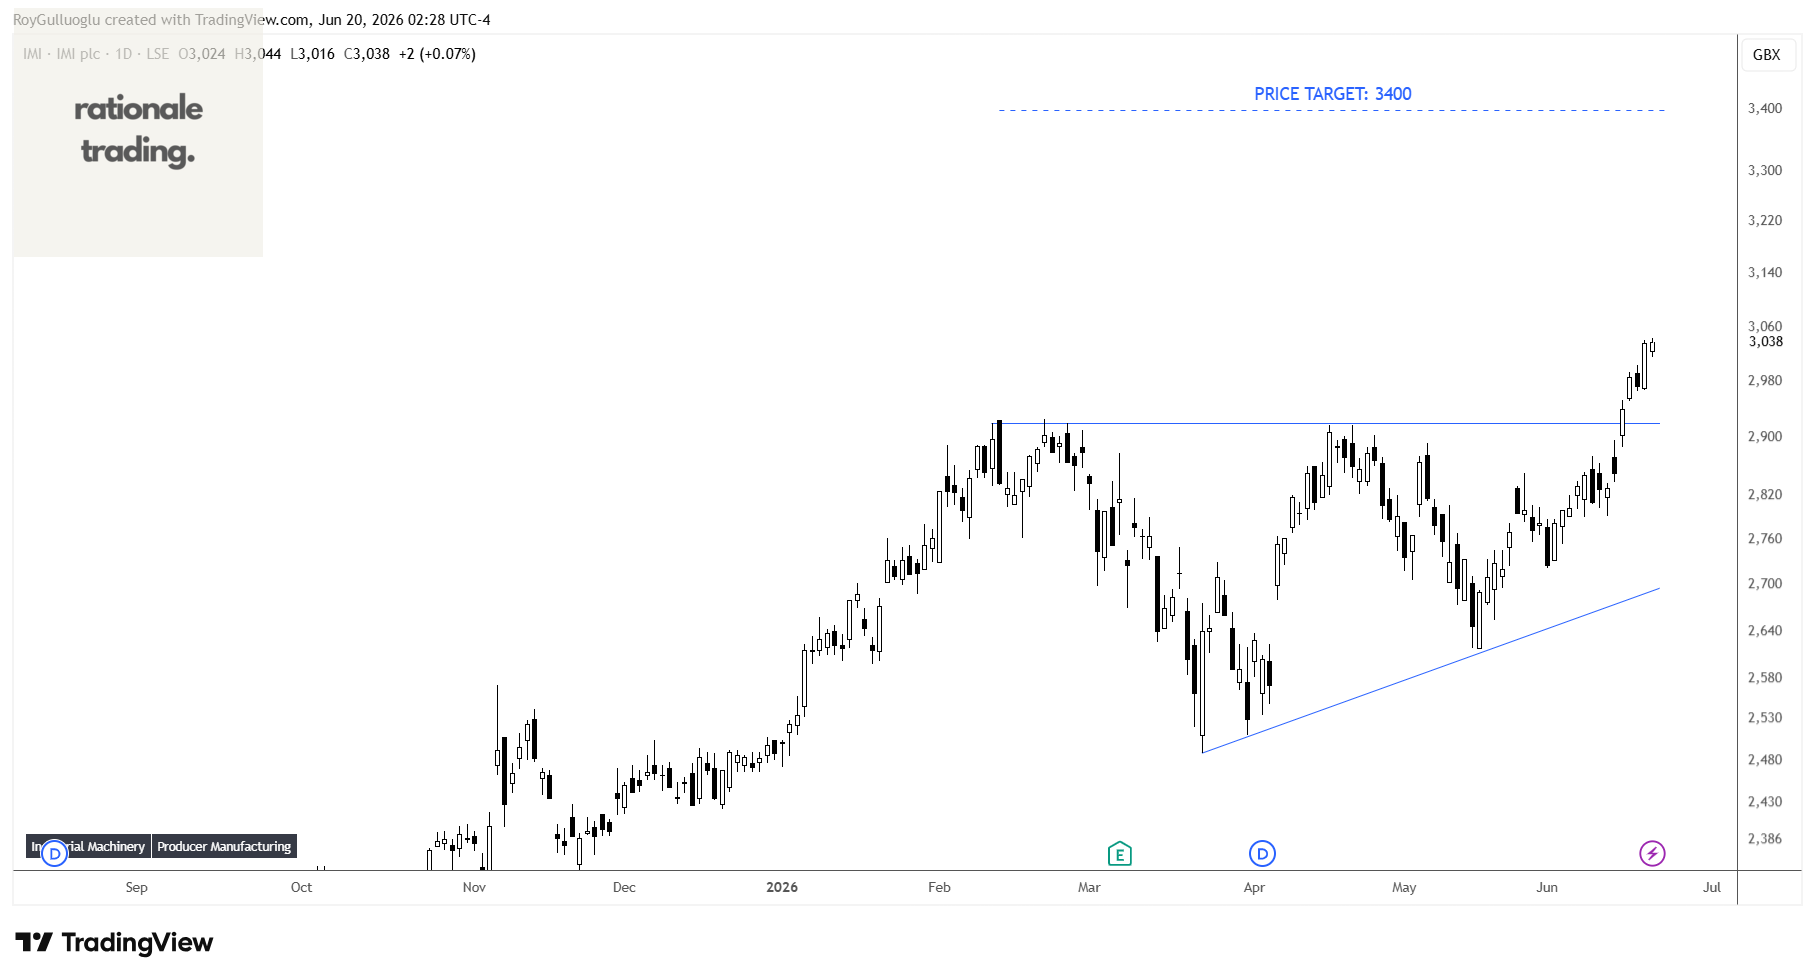
IMI plc designs and manufactures fluid and motion control solutions in the United Kingdom, Germany, rest of Europe, the United States, rest of the Americas, China, rest of the Asia Pacific, the Middle East, and Africa. It operates through Automation and Life Technology segments.
The above daily chart formed an approximately 3-month-long ascending triangle chart pattern as a bullish continuation after an uptrend.
Within this pattern, the horizontal boundary at 2920 levels acted as a resistance.
A daily close above 3007 levels validated the breakout from the 3-month-long ascending triangle chart pattern.
Based on this chart pattern, the potential price target is 3400 levels.