


New setups
TICKERS: KTOS(NASDAQ), GWRE(NYSE), TRMD(NASDAQ), GSL(NYSE), BOC(NYSE), SSNC(NASDAQ)
Kratos Defense & Security Solutions, Inc.-(KTOS/NASDAQ)-Long Idea
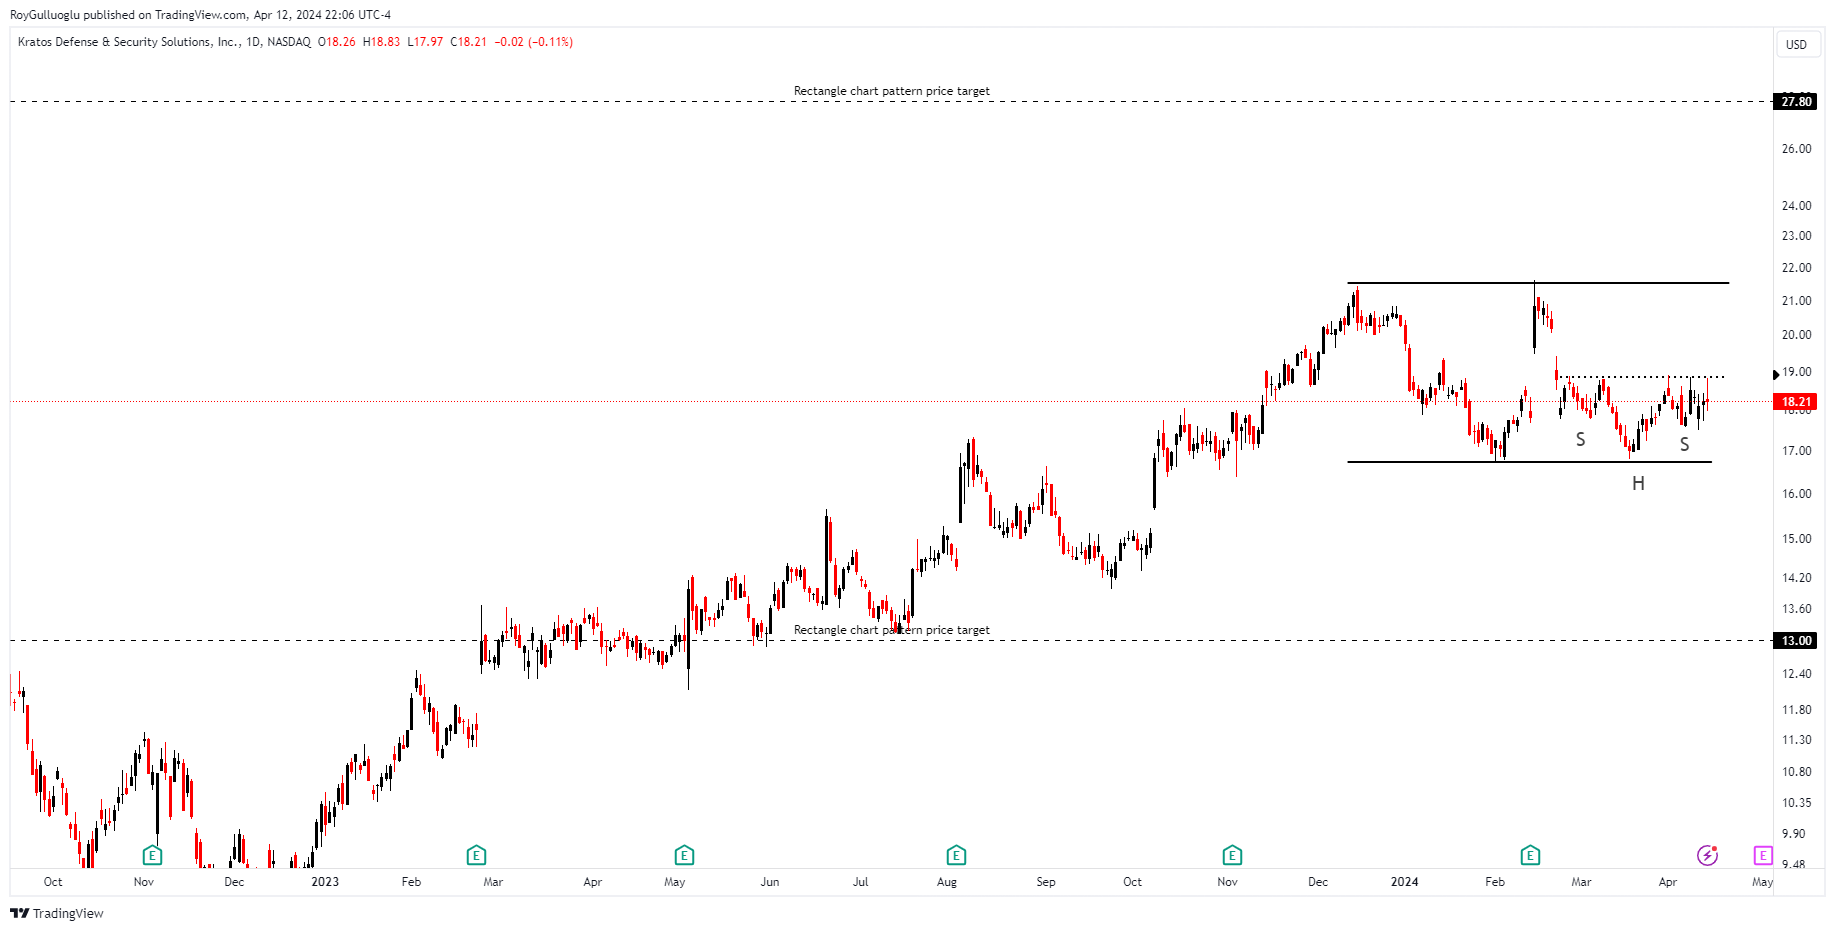
Kratos Defense & Security Solutions, Inc. operates as a technology company that addresses the defense, national security, and commercial markets. It operates through two segments, Kratos Government Solutions and Unmanned Systems.
The above daily chart might potentially form an appx 3-month-long rectangle chart pattern if the price manages to break the 1-month-long H&S bottom chart pattern. Normally I do not prefer to consider less than 2 month-long chart patterns but here it might lead to the formation of a legit chart pattern.
While the horizontal boundary at 21.52 levels acts as a resistance within this pattern, 16.72 levels act as a support.
A daily close above 22.16 levels would validate the breakout from the 3-month-long rectangle chart pattern. Also, a potential breakdown below 16.22 would activate a rectangle top chart pattern as a bearish reversal after an uptrend.
Based on this chart pattern, the potential price targets are 27.8 and 13 levels respectively.
Considering the current risk-off environment in the financial markets, defensive sector equities like KTOS work as a hedging strategy if you believe the overall uptrend is still on.
KTOS, classified under the "industrials" sector, falls under the “Mid Cap - Value” stock category.
Guidewire Software, Inc.-(GWRE/NYSE)-Short Idea
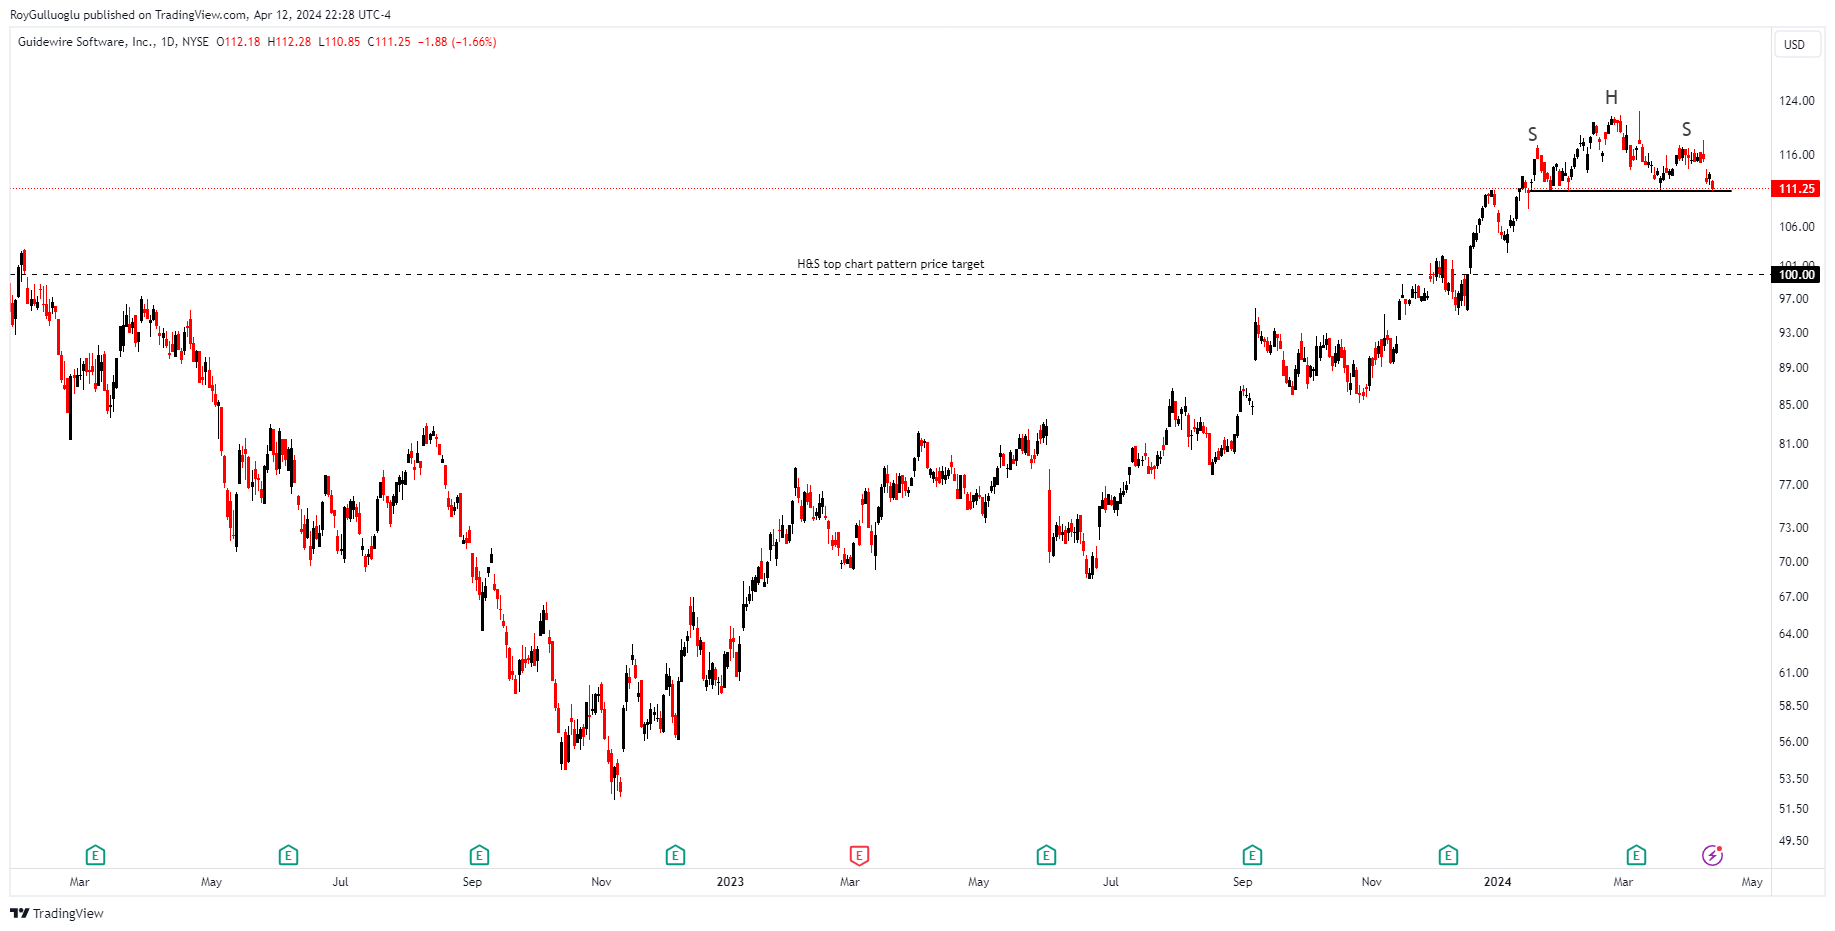
Guidewire Software, Inc. provides a platform for property and casualty (P&C) insurers worldwide. The company offers Guidewire InsuranceSuite Cloud, such as PolicyCenter Cloud, BillingCenter Cloud, and ClaimCenter Cloud applications.
The above daily chart formed an approximately 2-month-long H&S top chart pattern as a bearish reversal after an uptrend.
The horizontal boundary at 110.8 levels acts as a support within this pattern.
A daily close below 107.5 levels would validate the breakdown from the 2-month-long H&S top chart pattern.
Based on this chart pattern, the potential price target is 100 levels.
GWRE, classified under the "technology" sector, falls under the “Mid Cap - Growth” stock category.
TORM plc-(TRMD/NASDAQ)-Long Idea
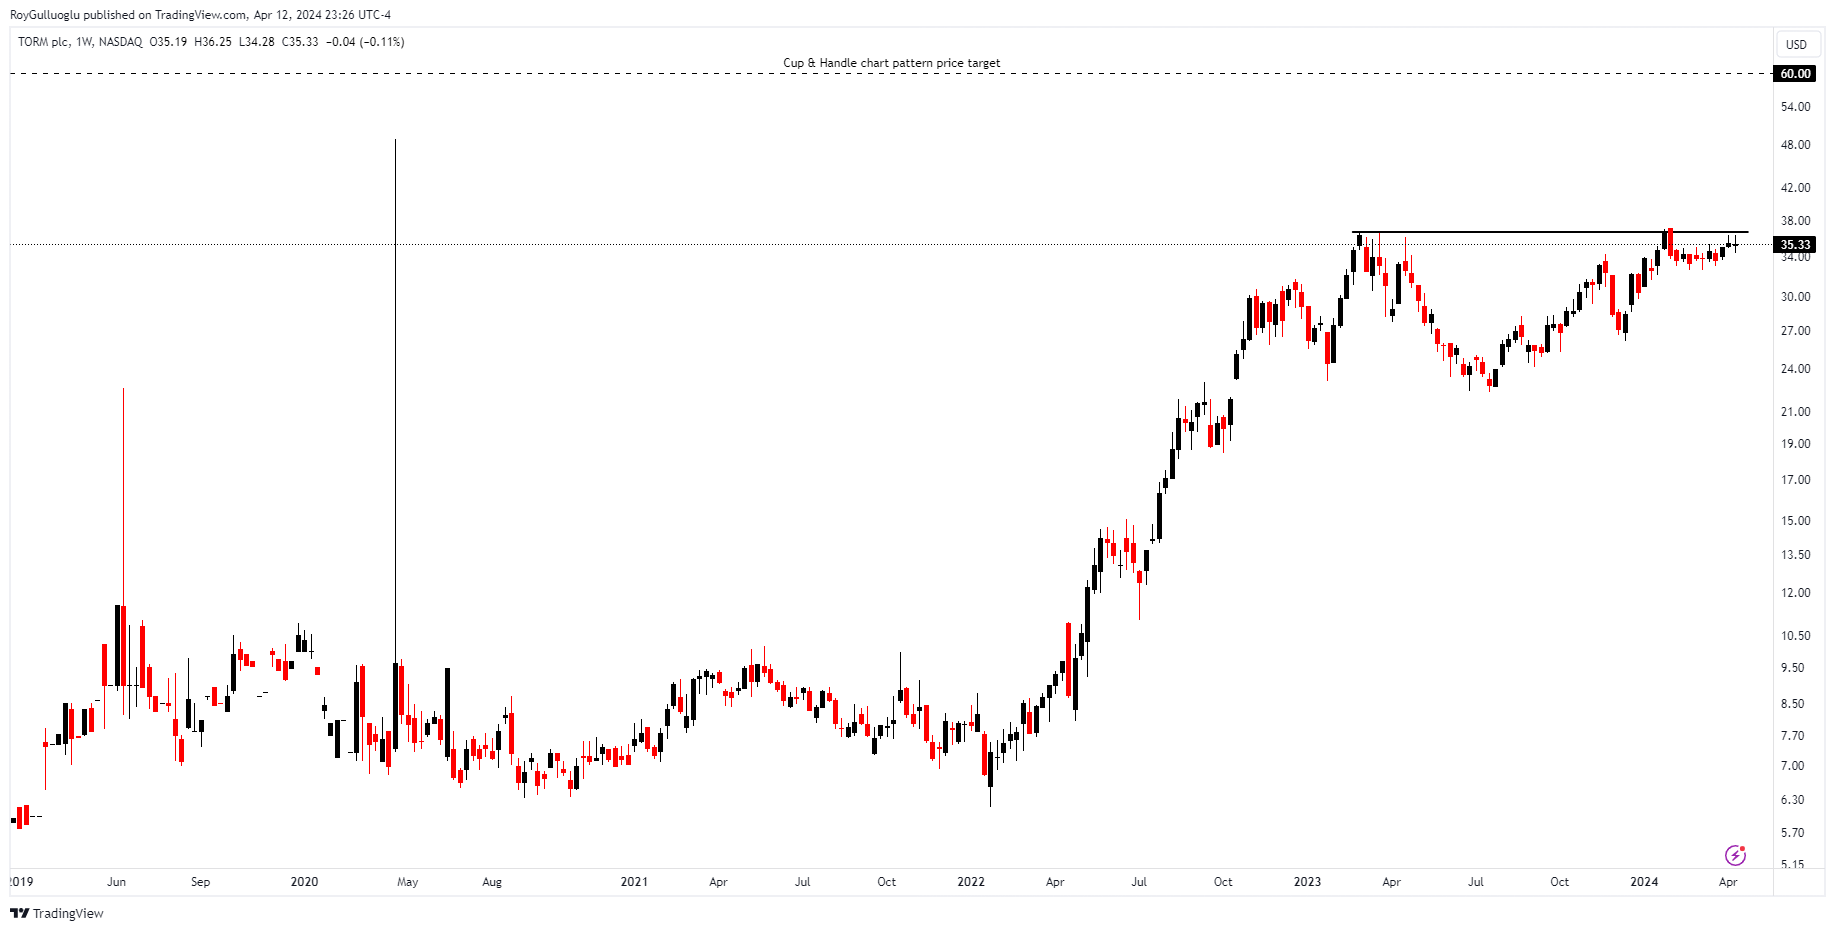
TORM plc, a shipping enterprise, possesses and manages a collection of product tankers located in the United Kingdom. Its operations are divided into two segments: Tanker and Marine Exhaust.
The above weekly chart formed an approximately 14-month-long Cup & Handle pattern as a bullish continuation after an uptrend.
The horizontal boundary at 36.58 levels acts as a resistance within this pattern.
A daily close above 37.67 levels would validate the breakout from the 14-month-long Cup & Handle pattern.
Based on this chart pattern, the potential price target is 60 levels.
TRMD, classified under the "energy" sector, falls under the “Mid Cap - Income” stock category.
Global Ship Lease, Inc.-(GSL/NYSE)-Long Idea
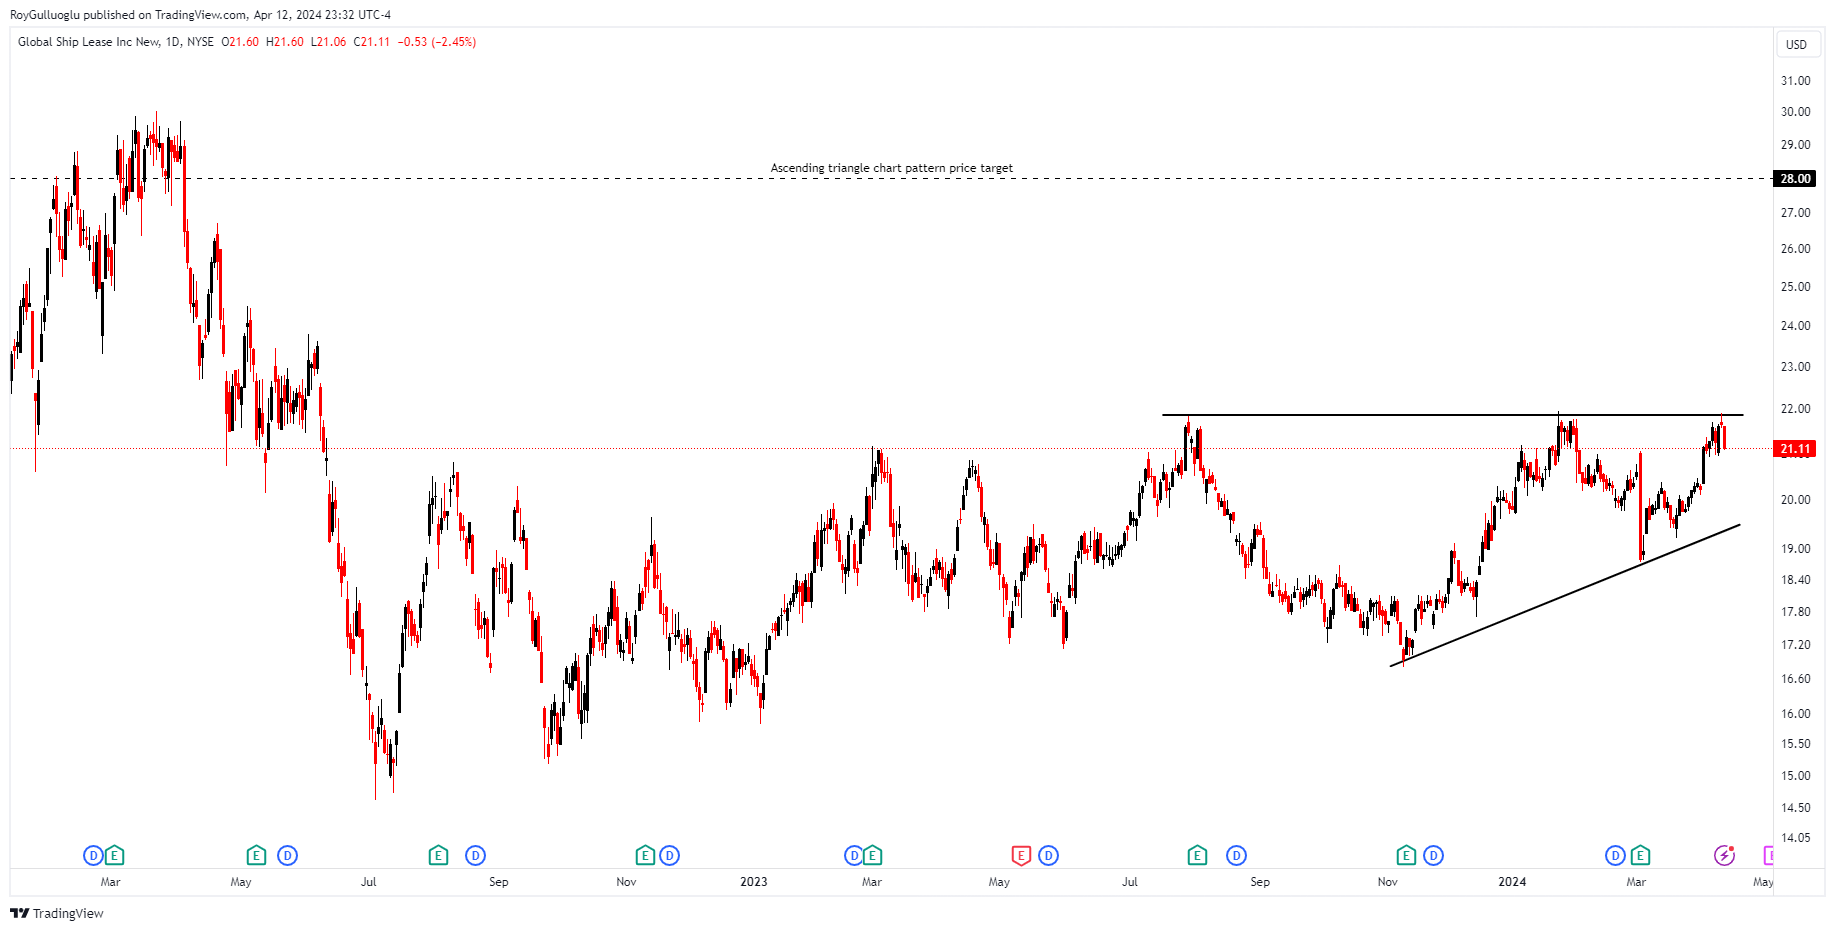
Global Ship Lease, Inc., along with its subsidiary entities, is involved in the ownership and leasing of containerships to container shipping firms worldwide through fixed-rate charter agreements.
The above daily chart formed an approximately 6-month-long ascending triangle chart pattern as a bullish continuation after an uptrend.
The horizontal boundary at 21.85 levels acts as a resistance within this pattern.
A daily close above 22.5 levels would validate the breakout from the 6-month-long ascending triangle chart pattern.
Based on this chart pattern, the potential price target is 28 levels.
GSL, classified under the "industrial" sector, falls under the “Small Cap - Value” stock category.
Boston Omaha Corporation-(BOC/NYSE)-Long Idea
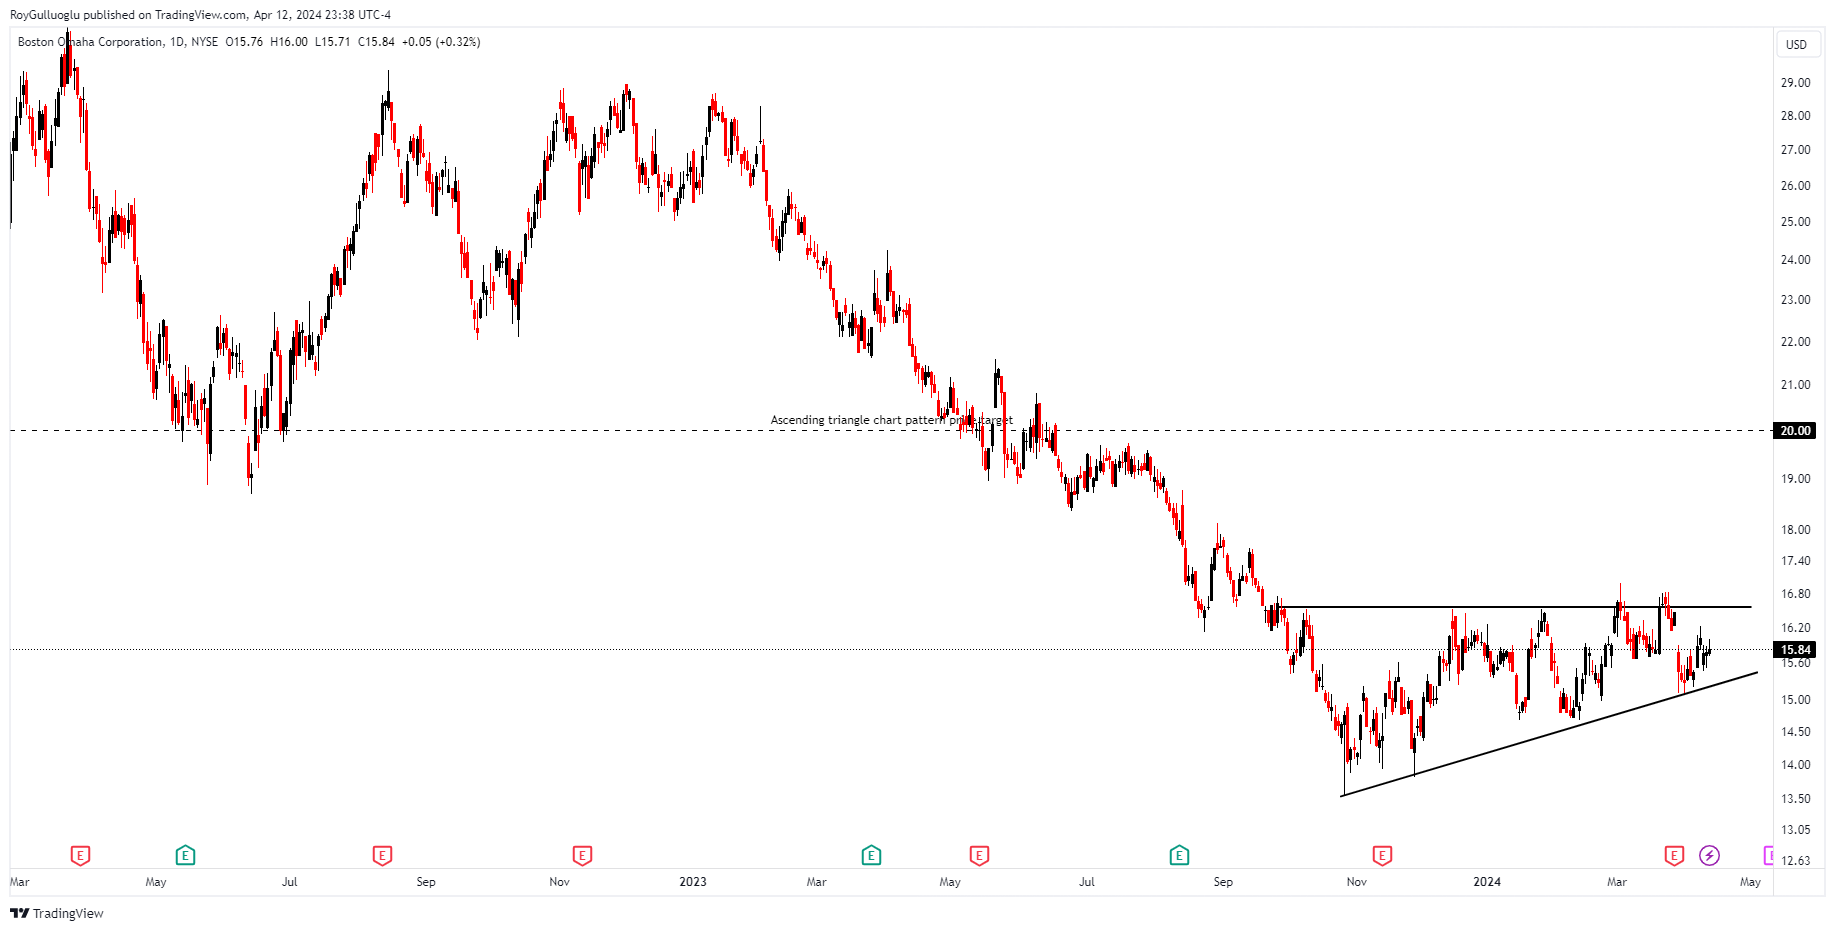
Boston Omaha Corporation, along with its subsidiary companies, operates in the outdoor billboard advertising sector in the southeastern United States. Additionally, the company is active in surety insurance and related brokerage, broadband, and asset management operations.
The above daily chart formed an approximately 4-month-long ascending triangle chart pattern as a bullish reversal after a downtrend.
The horizontal boundary at 16.56 levels acts as a resistance within this pattern.
A daily close above 17.05 levels would validate the breakout from the 4-month-long ascending triangle chart pattern.
Based on this chart pattern, the potential price target is 20 levels.
BOC, classified under the "communication services" sector, falls under the “Small Cap - Growth” stock category.
SS&C Technologies Holdings, Inc.-(SSNC/NASDAQ)-Long Idea
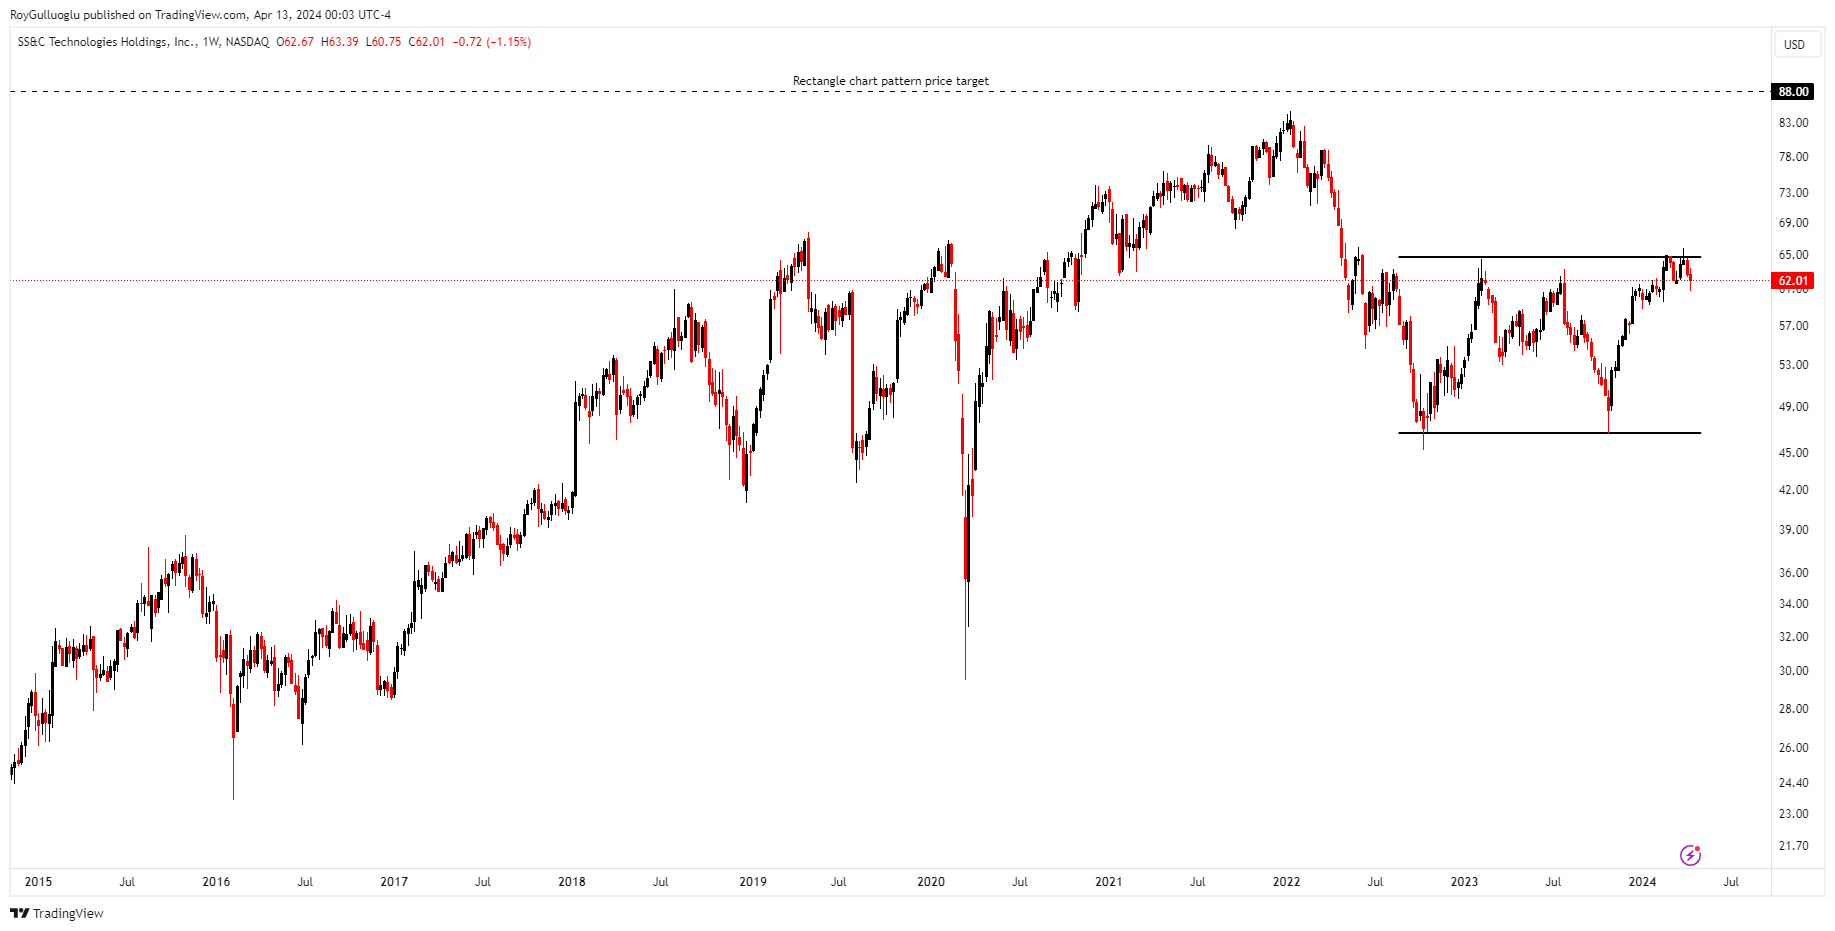
SS&C Technologies Holdings, Inc., along with its subsidiary entities, delivers software products and software-enabled services to the financial services and healthcare sectors.
The above weekly chart formed an approximately 20-month-long rectangle chart pattern as a bullish reversal after a downtrend.
The horizontal boundary at 64.67 levels acts as a resistance within this pattern.
A daily close above 66.6 levels would validate the breakout from the 20-month-long rectangle chart pattern.
Based on this chart pattern, the potential price target is 88 levels.
GSL, classified under the "technology" sector, falls under the “Large Cap - Growth” stock category.