


Applied Digital Corporation-(APLD/NASDAQ)-Long Idea
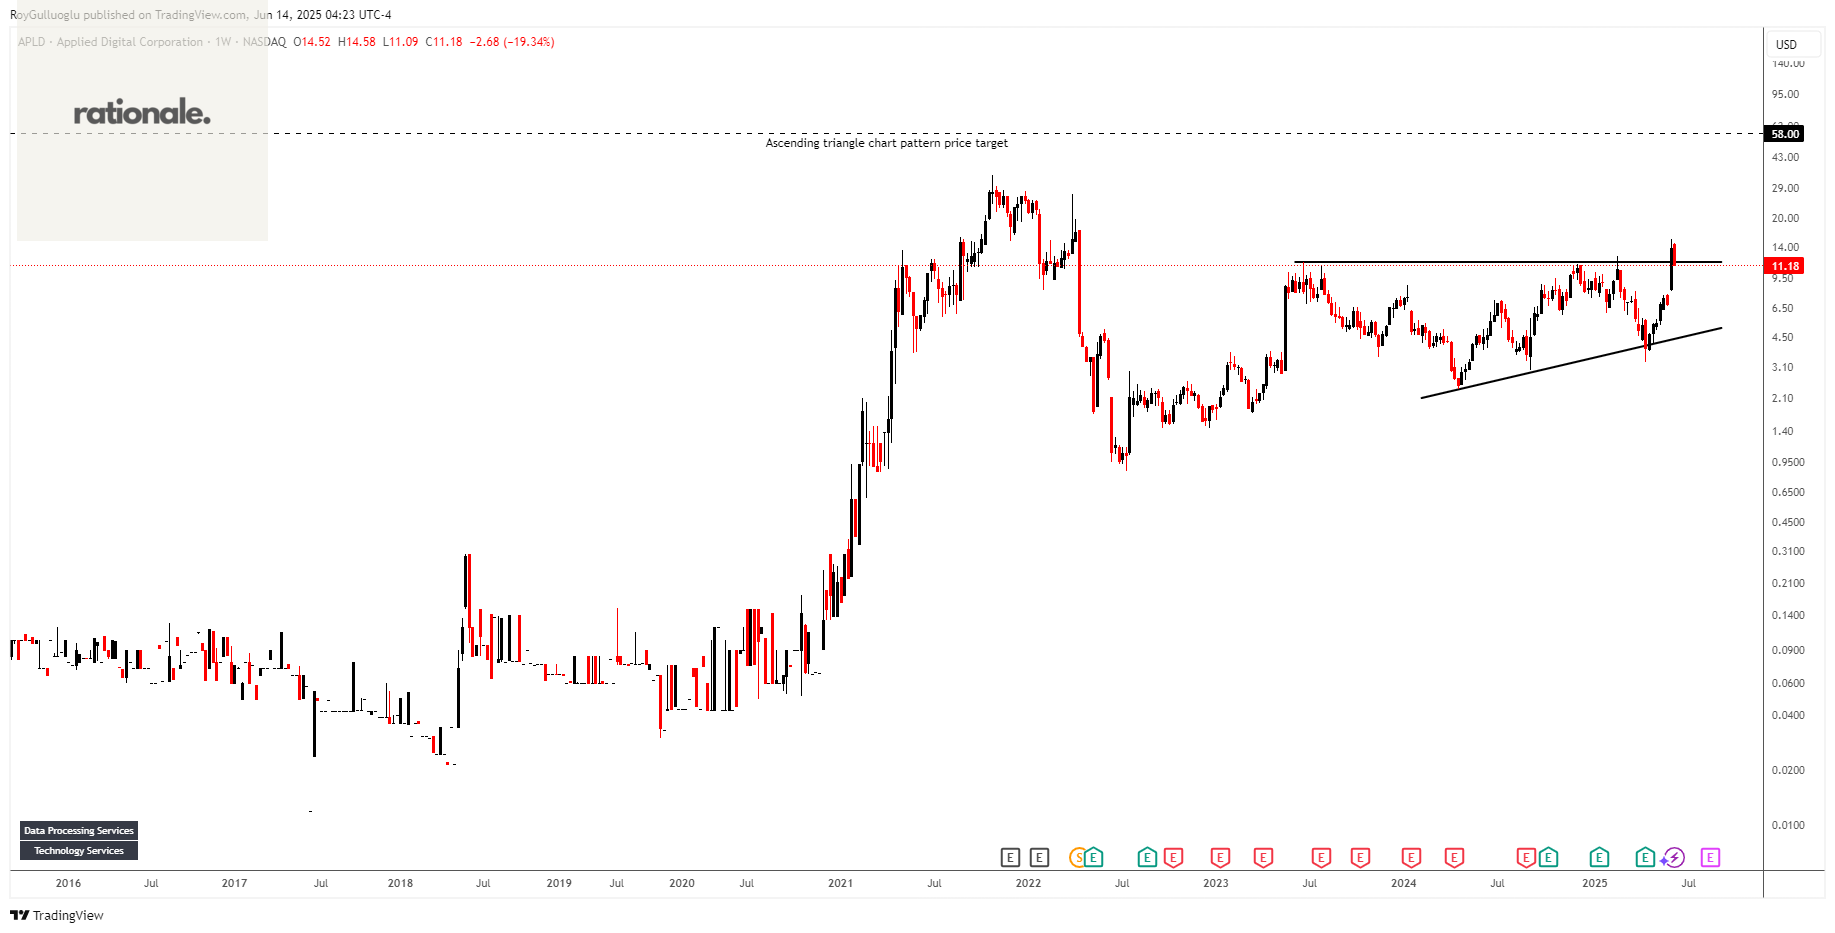
Applied Digital Corporation designs, develops, and operates digital infrastructure solutions and cloud services for high-performance computing (HPC) and artificial intelligence industries in North America.
The above weekly chart formed an approximately 25-month-long ascending triangle chart pattern as a bullish continuation after an uptrend.
The horizontal boundary at 11.5 levels acts as a resistance within this pattern.
A daily close above 11.8 levels would validate the breakout from the 25-month-long ascending triangle chart pattern.
Based on this chart pattern, the potential price target is 58 levels.
APLD, classified under the "technology" sector, falls under the “Mid Cap - Growth” stock category.
Visteon Corporation-(VC/NASDAQ)-Long Idea
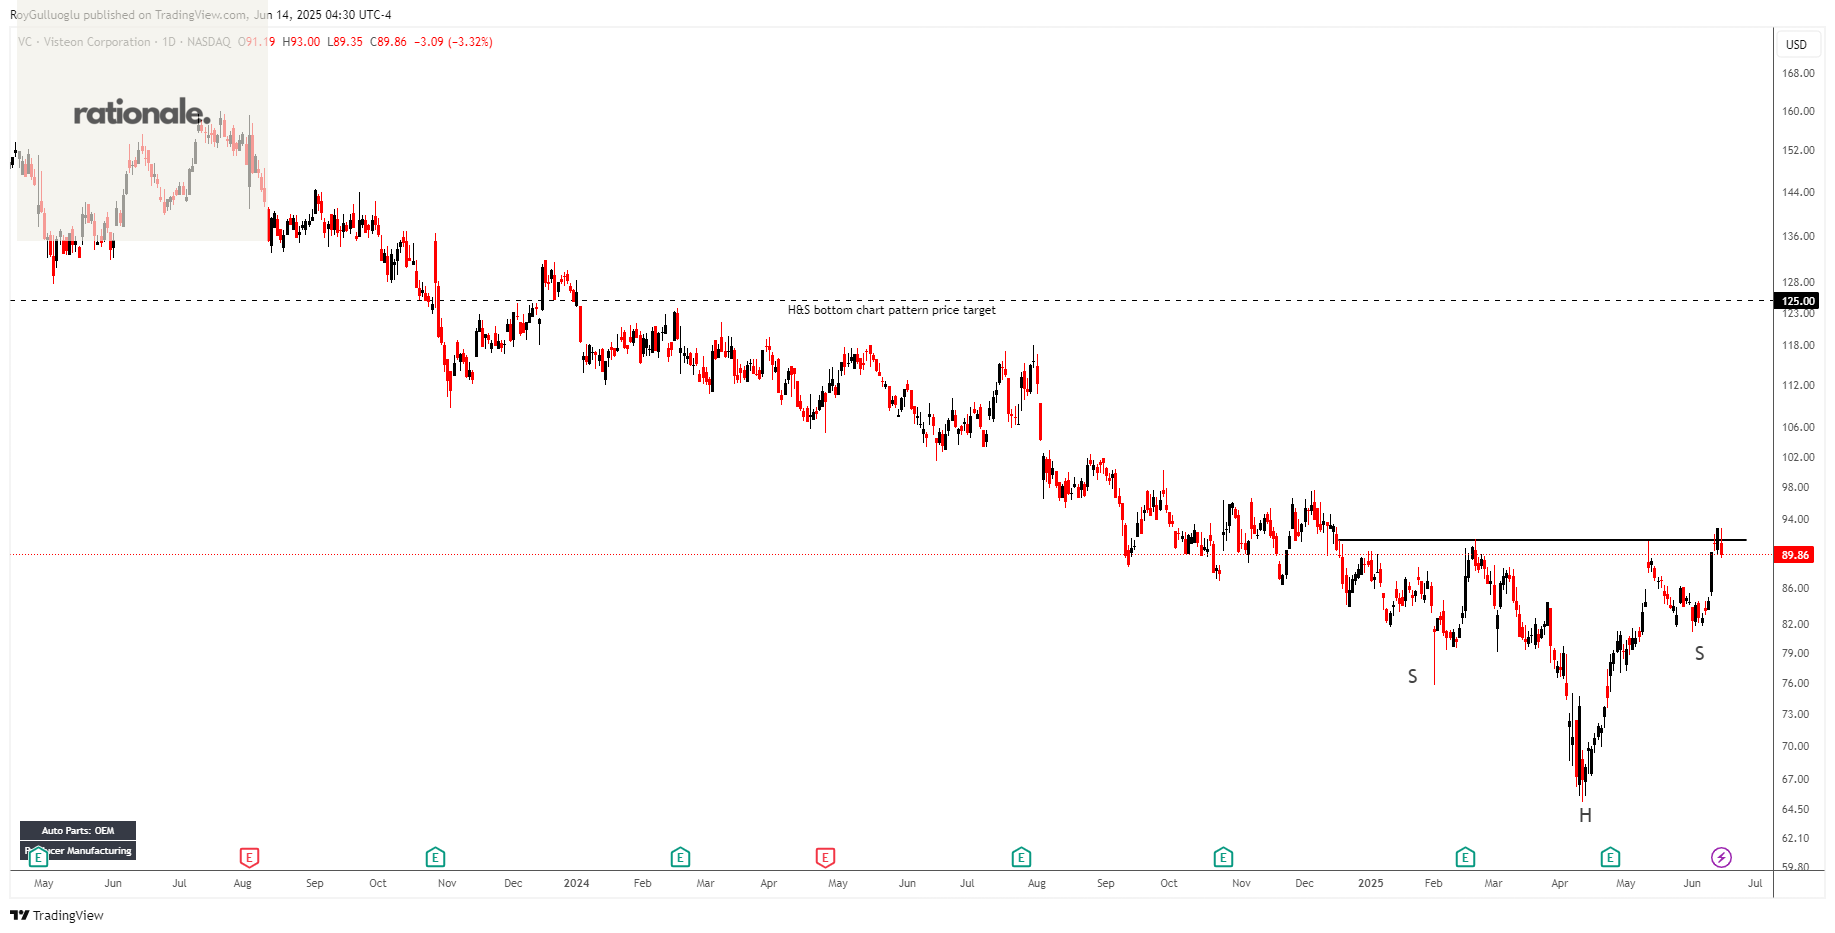
Visteon Corporation, an automotive technology company, designs, manufactures, and sells automotive electronics and connected car solutions for vehicle manufacturers.
The above daily chart formed an approximately 4-month-long H&S bottom chart pattern as a bullish reversal after a downtrend.
The horizontal boundary at 91.55 levels acts as a resistance within this pattern.
A daily close above 94.29 levels would validate the breakout from the 4-month-long H&S bottom chart pattern.
Based on this chart pattern, the potential price target is 125 levels.
VC, classified under the "consumer cyclical" sector, falls under the “Mid Cap - Growth” stock category.
Federated Hermes, Inc.-(FHI/NYSE)-Long Idea
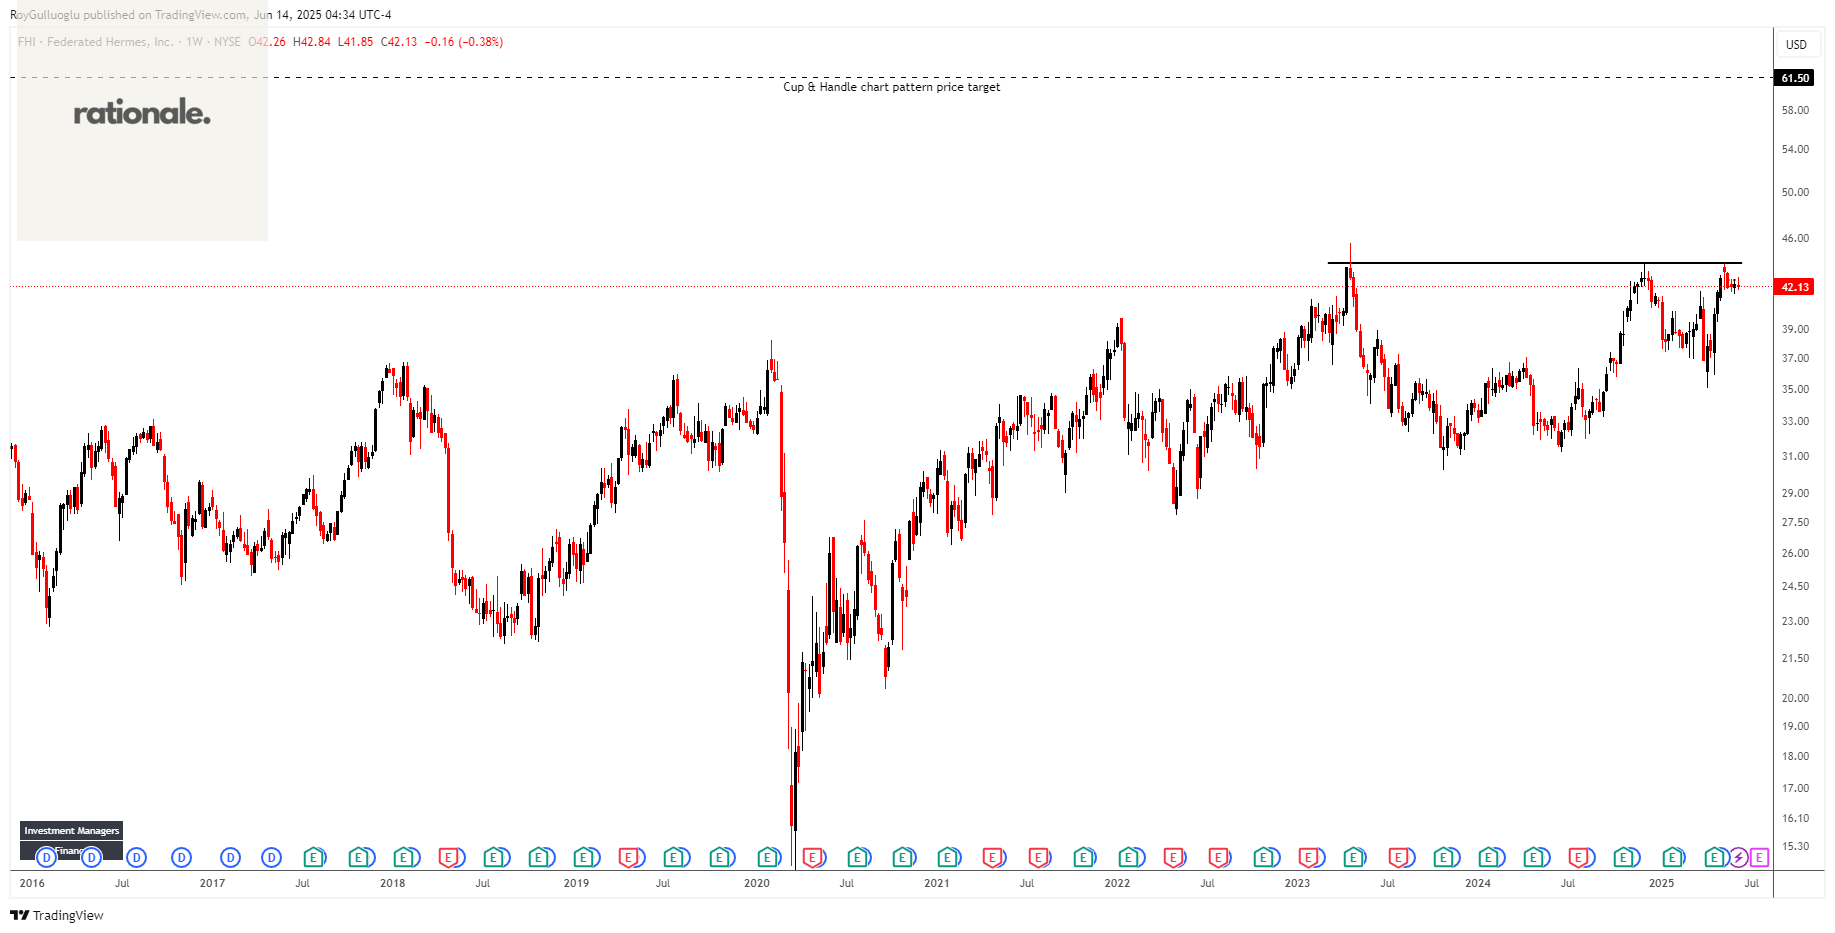
Federated Hermes, Inc. is a publicly owned investment manager.
The above weekly chart formed an approximately 25-month-long ascending triangle chart pattern as a bullish continuation after an uptrend.
The horizontal boundary at 43.92 levels acts as a resistance within this pattern.
A daily close above 45.2 levels would validate the breakout from the 25-month-long ascending triangle chart pattern.
Based on this chart pattern, the potential price target is 61.5 levels.
FHI, classified under the "financial services" sector, falls under the “Mid Cap-Income” stock category.
NuVista Energy Ltd.-(NVA/TSX)-Long Idea
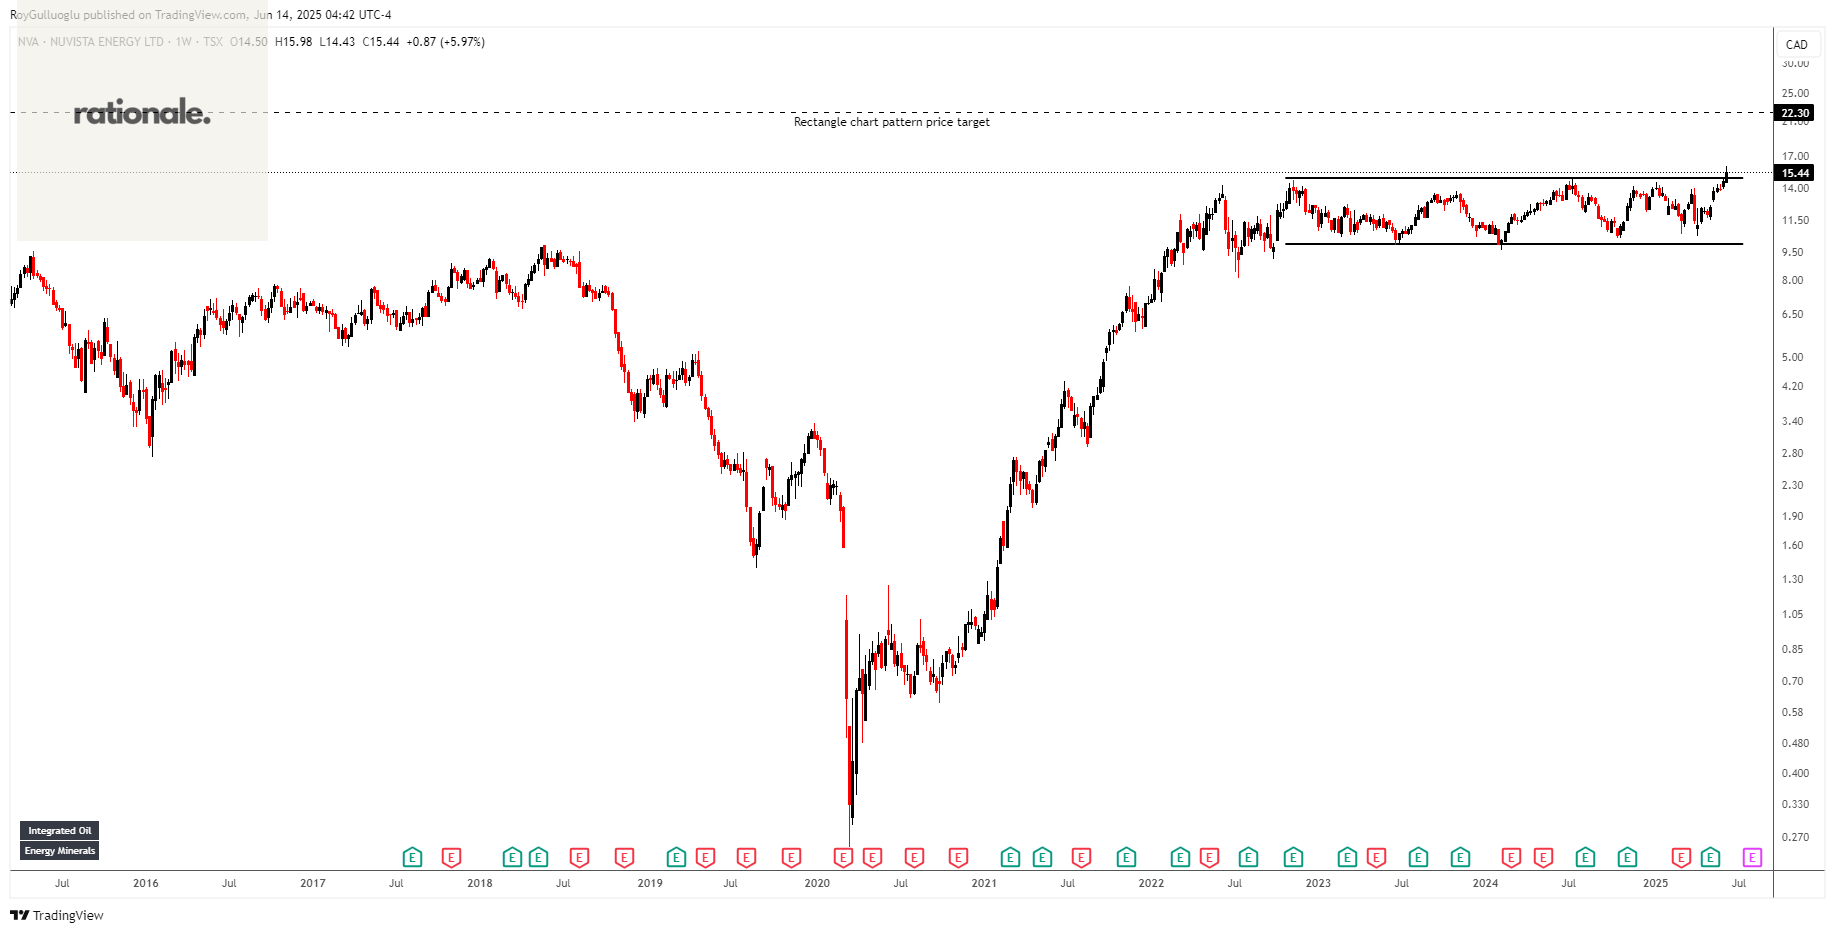
NuVista Energy Ltd., together with its subsidiaries, engages in the exploration, development, and production of oil and natural gas reserves in the Western Canadian Sedimentary Basin.
The above daily chart formed an approximately 30-month-long rectangle chart pattern as a bullish continuation after an uptrend.
The horizontal boundary at 14.85 levels acts as a resistance within this pattern.
A daily close above 15.3 levels would validate the breakout from the 30-month-long rectangle chart pattern.
Based on this chart pattern, the potential price target is 22.3 levels.
NVA, classified under the "energy" sector, falls under the “Mid Cap-Income” stock category.