


D-Wave Quantum Inc.-(QBTS/NYSE)-Long Idea
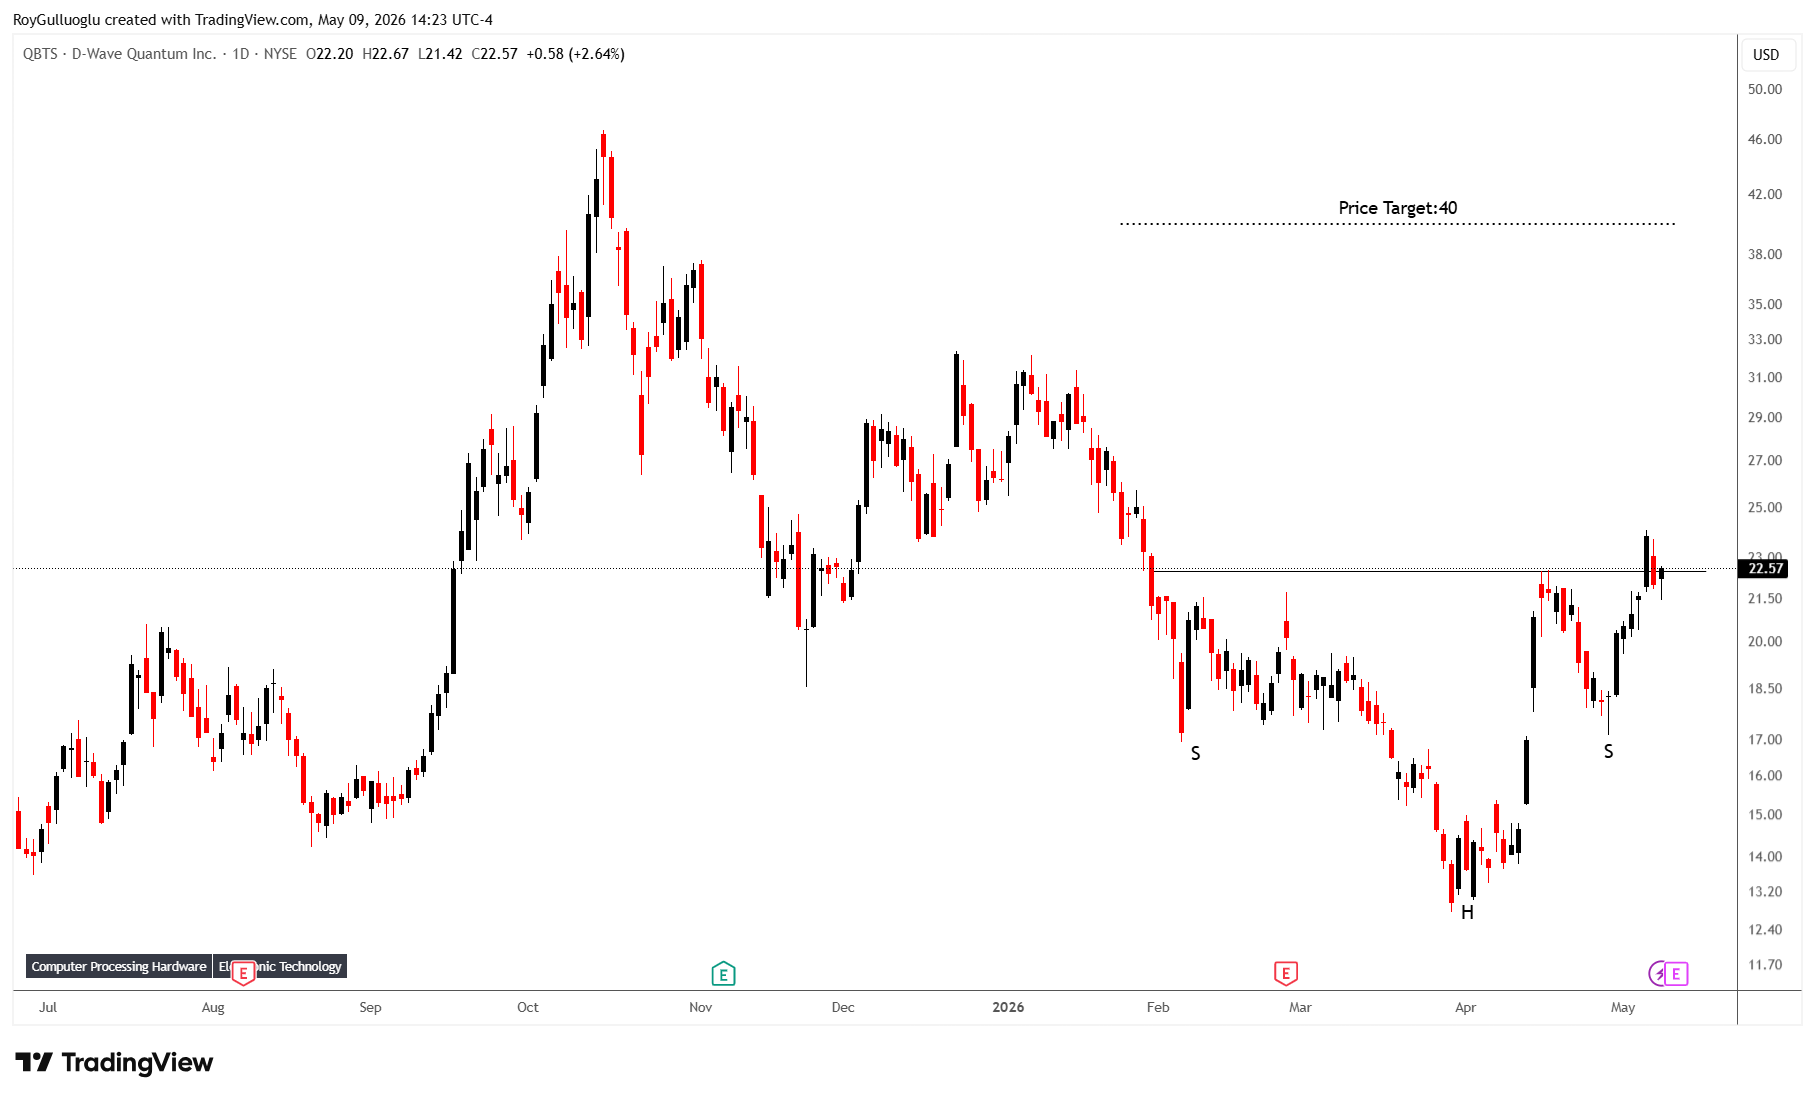
D-Wave Quantum Inc. engages in the development and delivery of quantum computing systems, software, and services worldwide
The above daily chart formed an approximately 2-month-long H&S bottom chart pattern as a bullish reversal after a downtrend.
The horizontal boundary at 22.47 levels acts as a resistance within this pattern.
A daily close above 23.15 levels validated the breakout from the H&S bottom chart pattern.
Based on this chart pattern, the potential price target is 40 levels.
IQVIA Holdings Inc.-(IQV/NYSE)-Long Idea
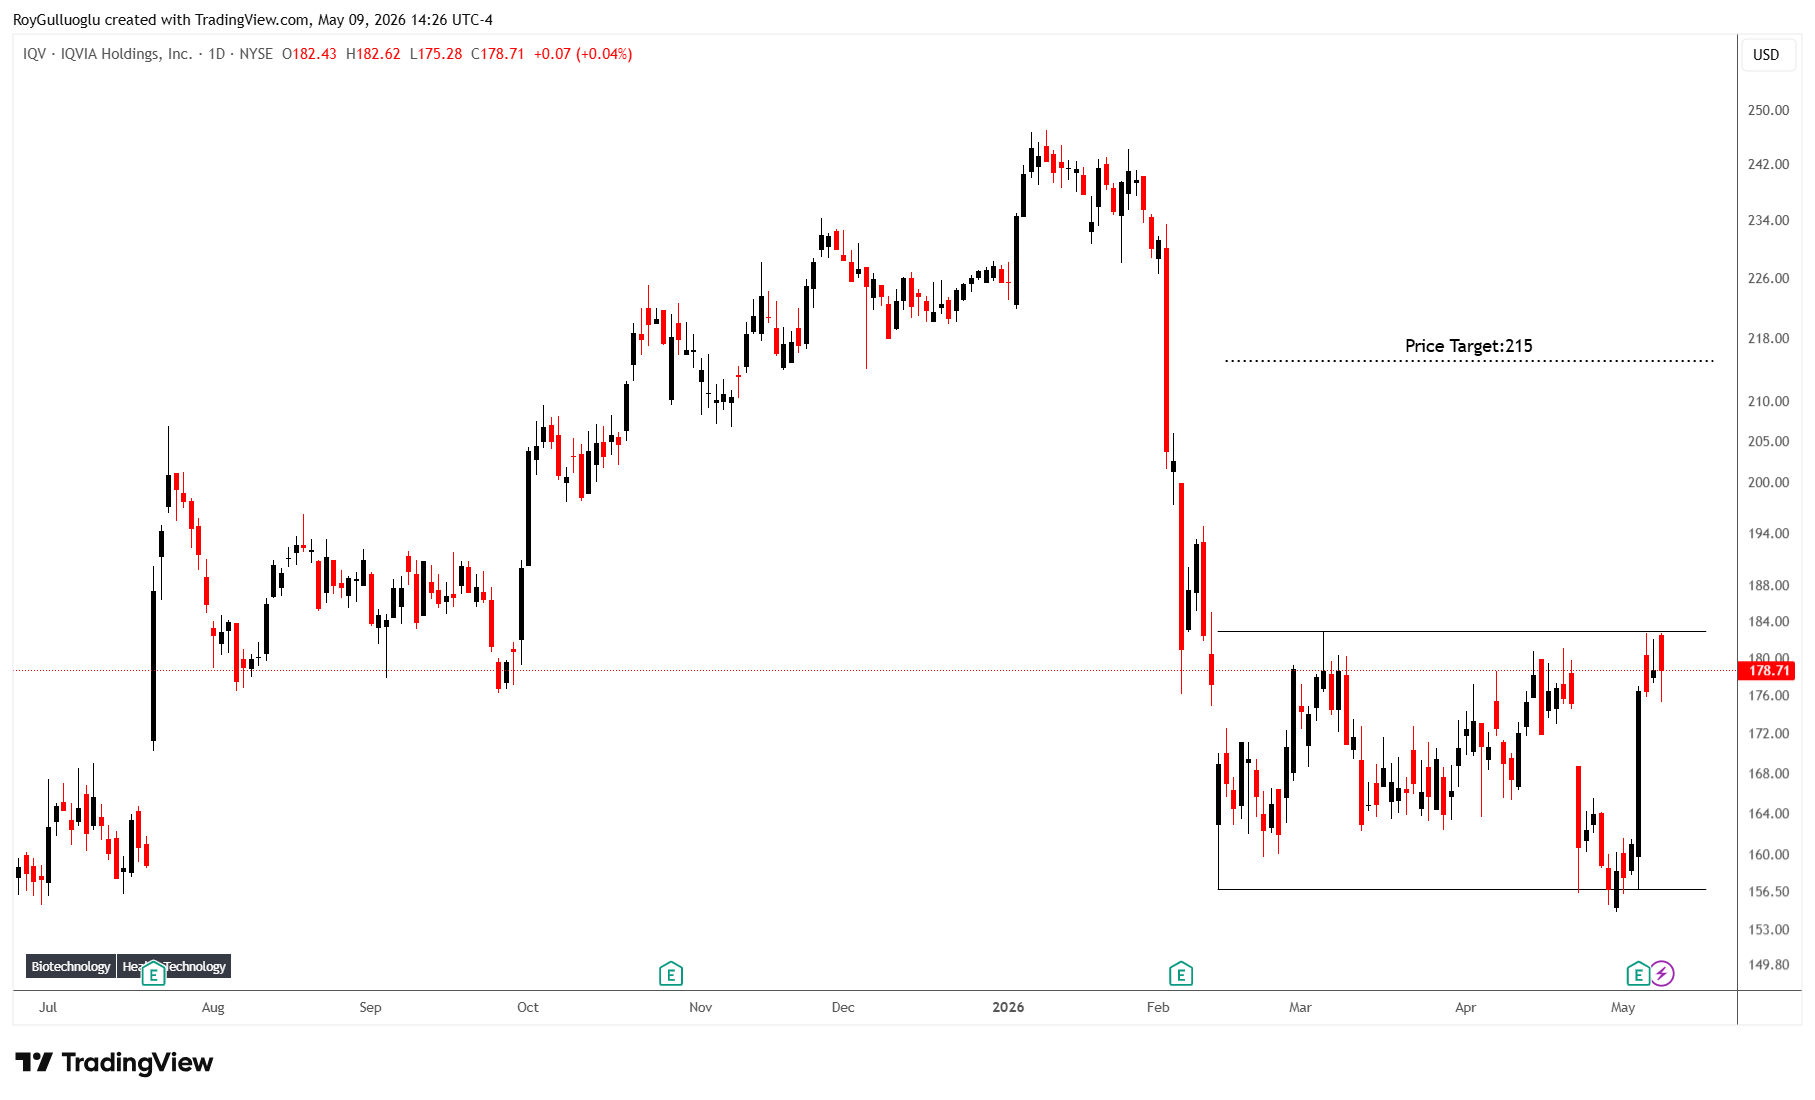
IQVIA Holdings Inc. provides clinical research services, commercial insights, and healthcare intelligence to the life sciences and healthcare industries in the Americas, Europe, Africa, and the Asia-Pacific.
The above daily chart formed an approximately 2-month-long rectangle chart pattern as a bullish reversal after a downtrend.
The horizontal boundary at 182.93 levels acts as a resistance within this pattern.
A daily close above 188.4 levels would validate the breakout from the 2-month-long rectangle chart pattern.
Based on this chart pattern, the potential price target is 215 levels.
Vestas Wind Systems A/S-(VWS/OMXCOP)-Long Idea
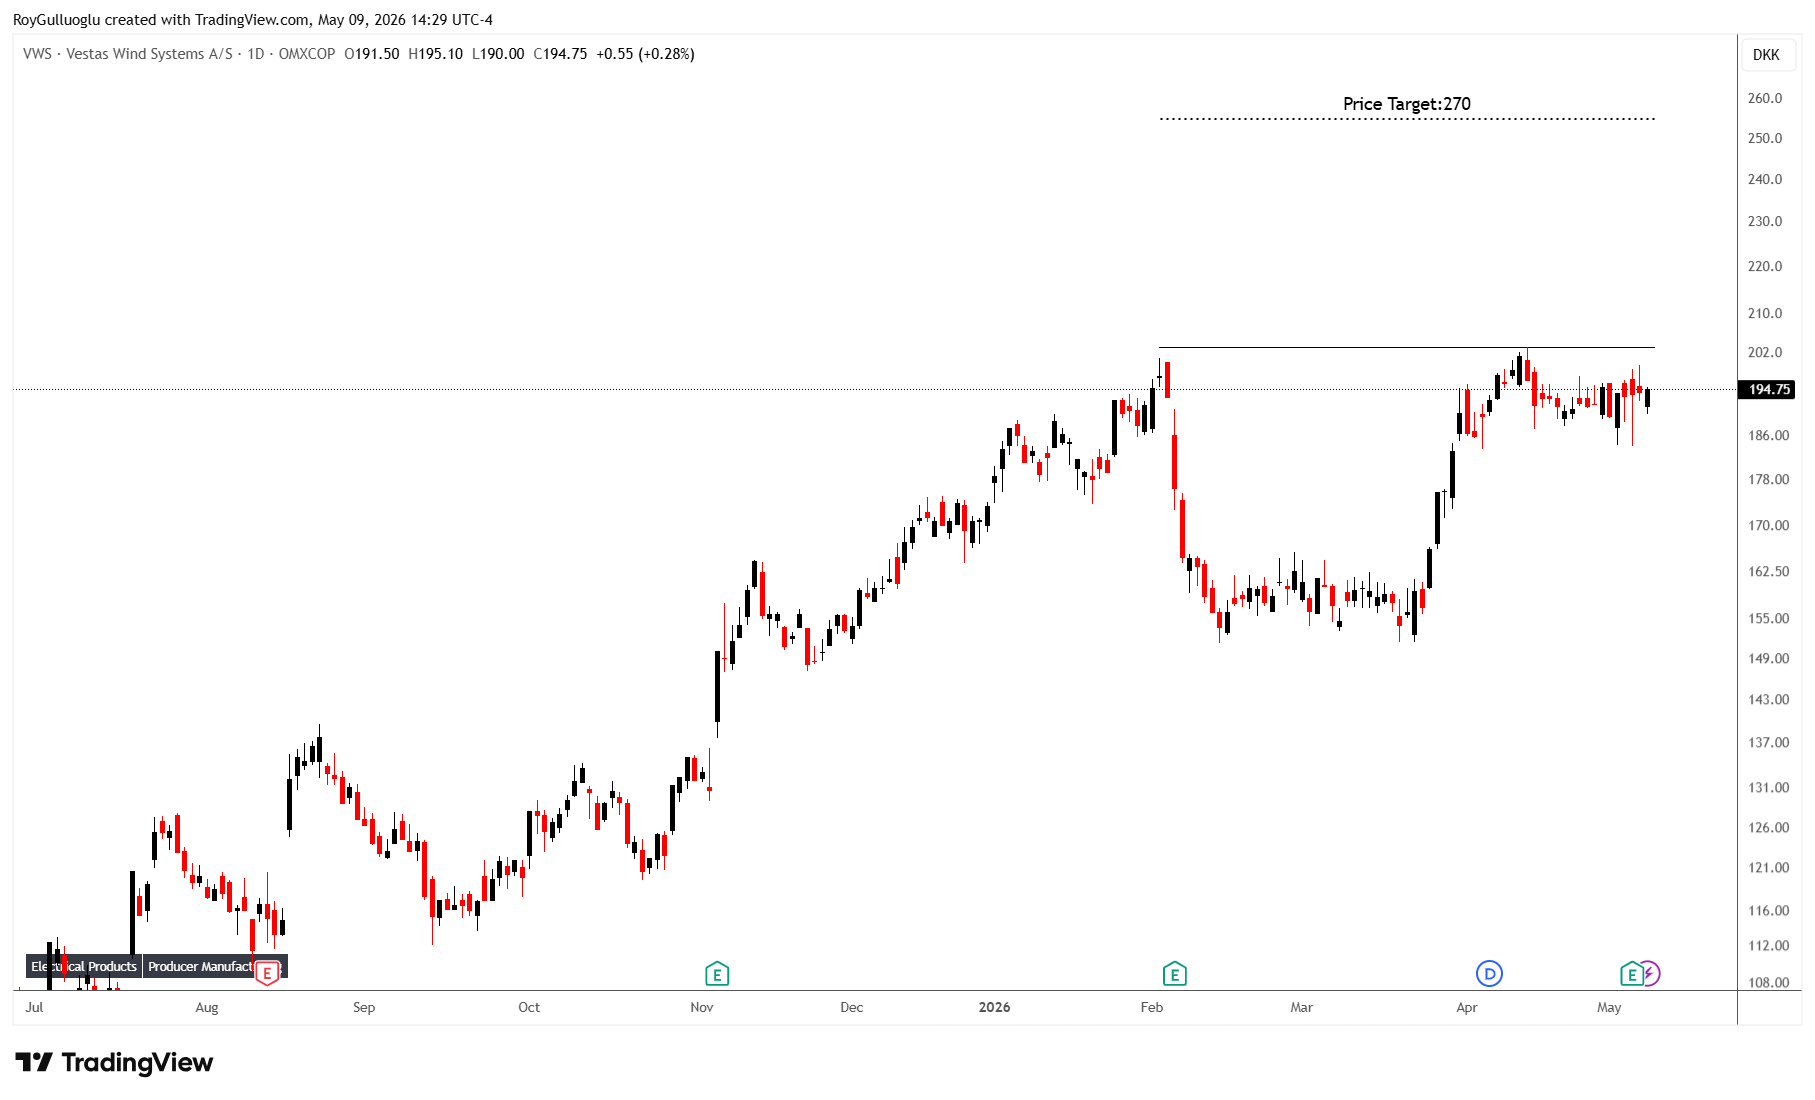
Vestas Wind Systems A/S engages in the design, manufacture, installation, and services of wind turbines the United States, Denmark, and internationally.
The above daily chart formed an approximately 2-month-long cup & handle chart pattern as a bullish continuation after an uptrend.
The horizontal boundary at 203 levels acts as a resistance within this pattern.
A daily close above 209 levels would validate the breakout from the 2-month-long cup & handle chart pattern.
Based on this chart pattern, the potential price target is 270 levels.
Micronics Japan Co., Ltd.-(6871/TSE)-Long Idea
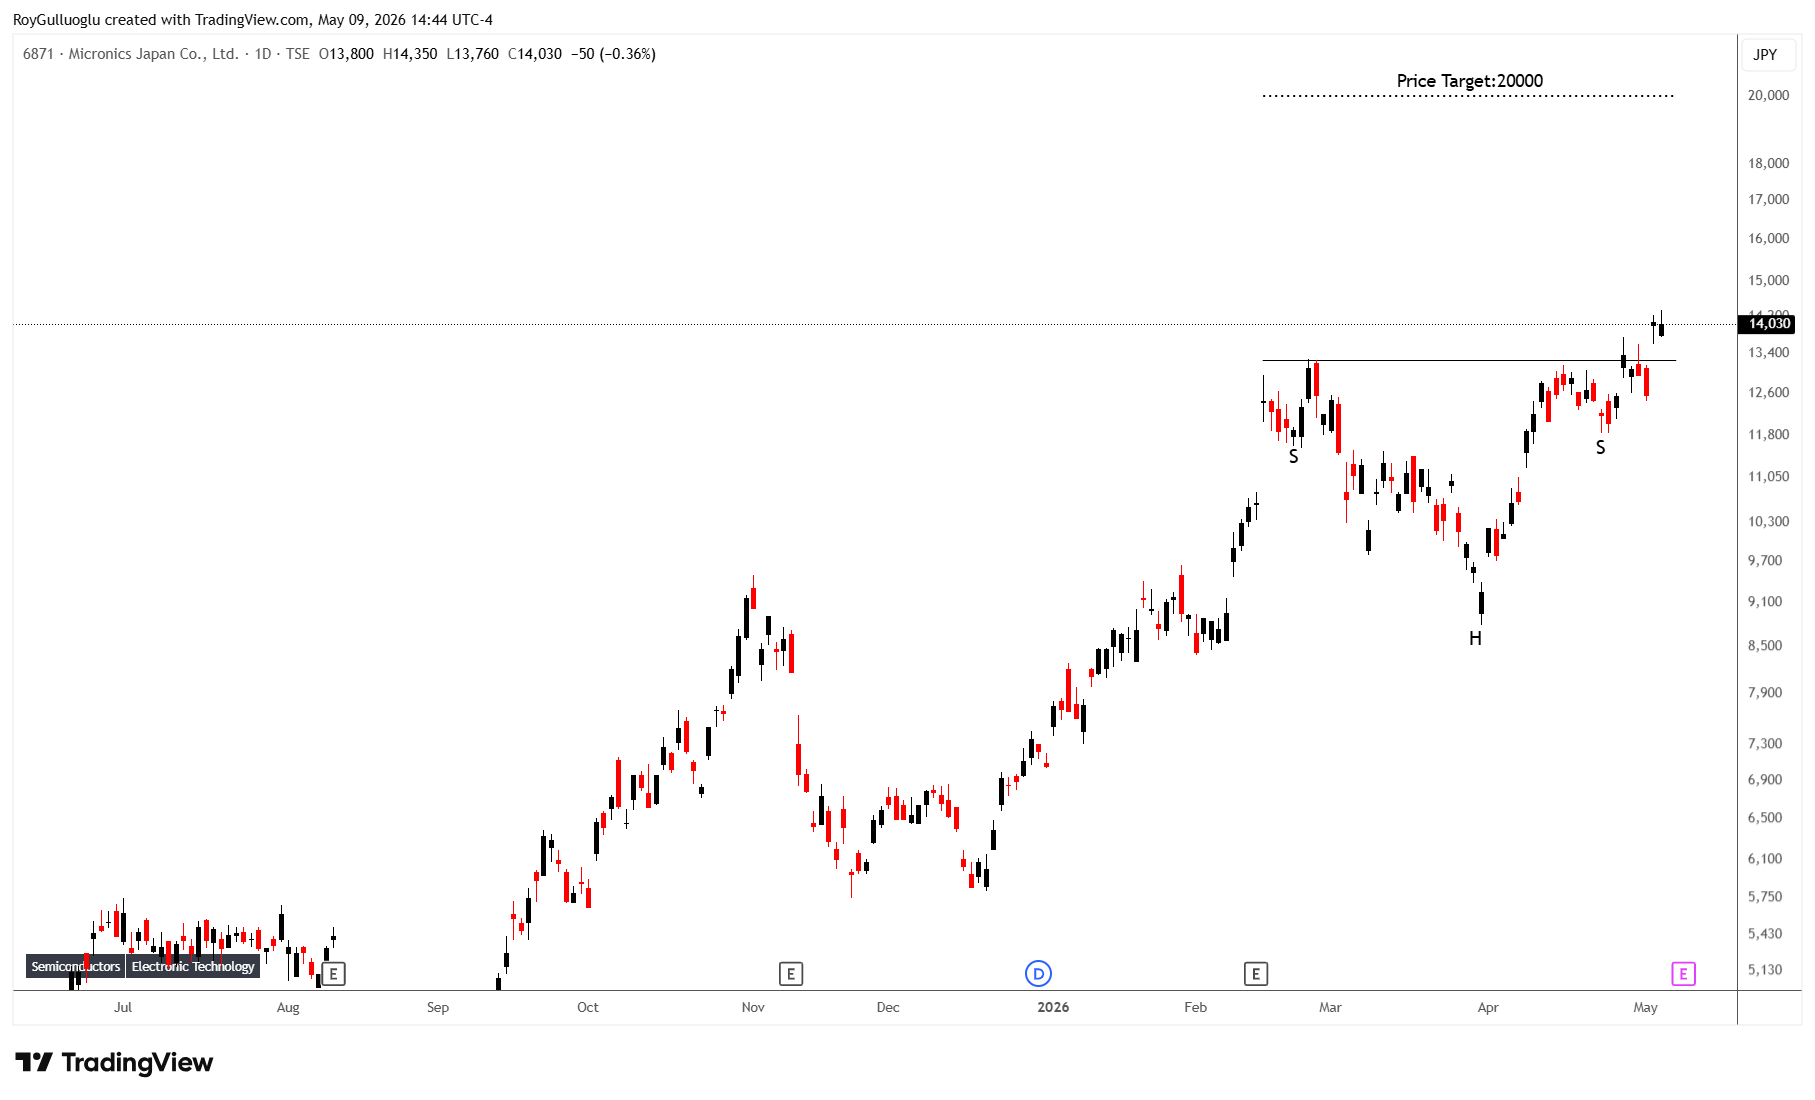
Micronics Japan Co., Ltd. develops, manufactures, and sells body measuring equipment, semiconductor, and liquid crystal display inspection equipment worldwide.
The above daily chart formed an approximately 2-month-long H&S continuation chart pattern as a bullish continuation after an uptrend.
The horizontal boundary at 13270 levels acts as a resistance within this pattern.
A daily close above 13668 levels would validate the breakout from the 2-month-long H&S continuation chart pattern.
Based on this chart pattern, the potential price target is 20000 levels.