


Hello Rationale members! Before getting into the weekly equities report, I wanted to write a brief market note amid the latest developments in the financial markets. Yesterday, we received non-pleasant nonfarm payroll numbers. The headline number is 142K which is below the 12-month average of 202K. Economists had projected 165K new jobs. There are some insights that I would like to draw attention to;
Downward revisions to the previous months are concerning. The previous month’s headline number is revised to 89K from 114K. Also, the two-month payroll net revision is -86K with a prior number of -29K.
Change in private payrolls came in below expectations as well. Also according to the employment section in the ISM service data, “Hiring freeze in place; not backfilling positions as people are (laid off), retire, or leave our organization.” The labor market is supported by government side jobs more than the private sector. That is also another debate over financial tightening. The fiscal side is not tight enough and that is the reason the economy seems well but it is not sustainable. The private payroll data also supports this idea.
The main question is if the FED is going to cut rates by 25 bp or 50 bp in the September meeting. After the data, the chance of 50 bp has increased. However, without proper communication or without preparing the market, a potential 50bp cut might be perceived as FED`s panic. That would make the market believe that FED also believes in hard landing so they are rushing. I believe with proper communication they can avoid such a situation. In that scenario, I believe that there would be a buy-the-dip opportunity and the current selling wave would be limited with a market correction.
Overall, it is time to sit back and patiently watch for a potential `buy-the-dip` opportunity in the stock market. Although the data suggests a disruption in economic activity, the situation is not catastrophic and is part of the broader normalization process. As long as the Fed acts in a timely manner, avoiding the delays seen in the previous rate hike in March 2022, the market could stabilize and present attractive entry points.
New setups
TICKERS: MPLX(NYSE), ROIV(NASDAQ), DDL(NYSE), U-HAL(NYSE), NOMD(NYSE), FCFS(NASDAQ)
MPLX LP-(MPLX/NYSE)-Long Idea
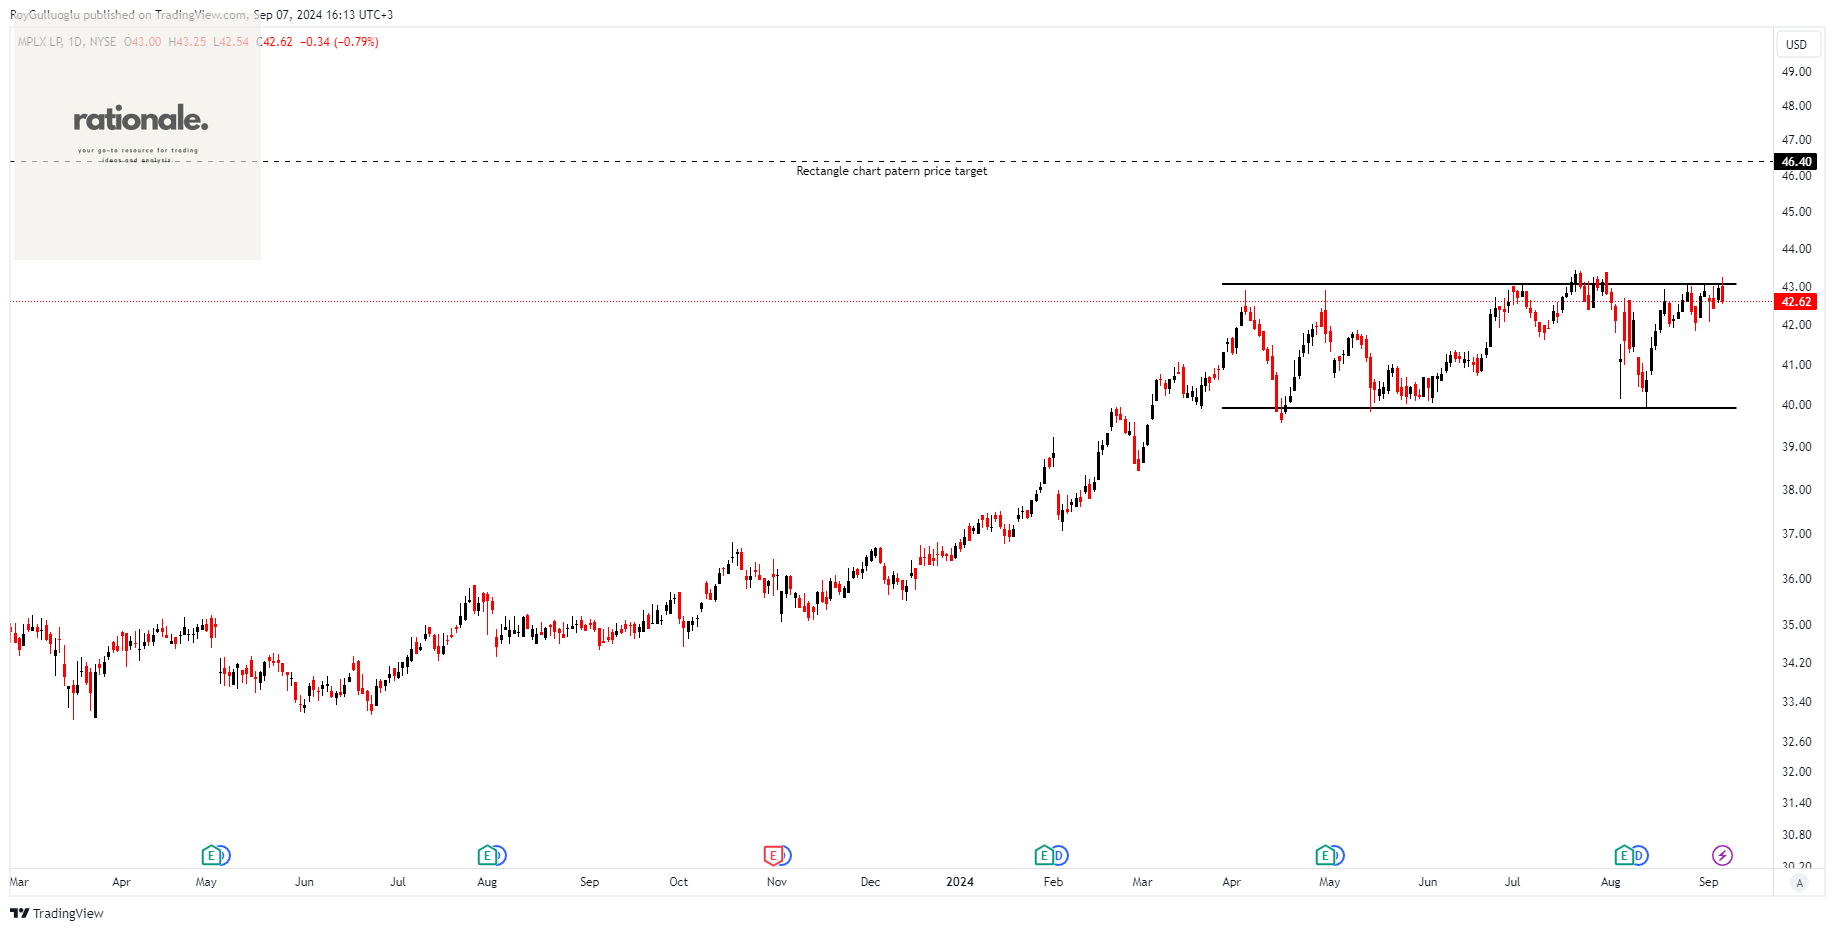
MPLX LP is a company that owns and manages midstream energy infrastructure and logistics assets, primarily within the United States. It operates through two main segments: Logistics and Storage, as well as Gathering and Processing.
The above daily chart formed an approximately 3-month-long rectangle chart pattern as a bullish continuation after an uptrend.
The horizontal boundary at 43 levels acts as a resistance within this pattern.
A daily close above 44.3 levels would validate the breakout from the 3-month-long rectangle chart pattern.
Based on this chart pattern, the potential price target is 46.4 levels.
MPLX, classified under the "energy" sector, falls under the “Large Cap - Income” stock category.
Roivant Sciences Ltd.-(ROIV/NASDAQ)-Long Idea
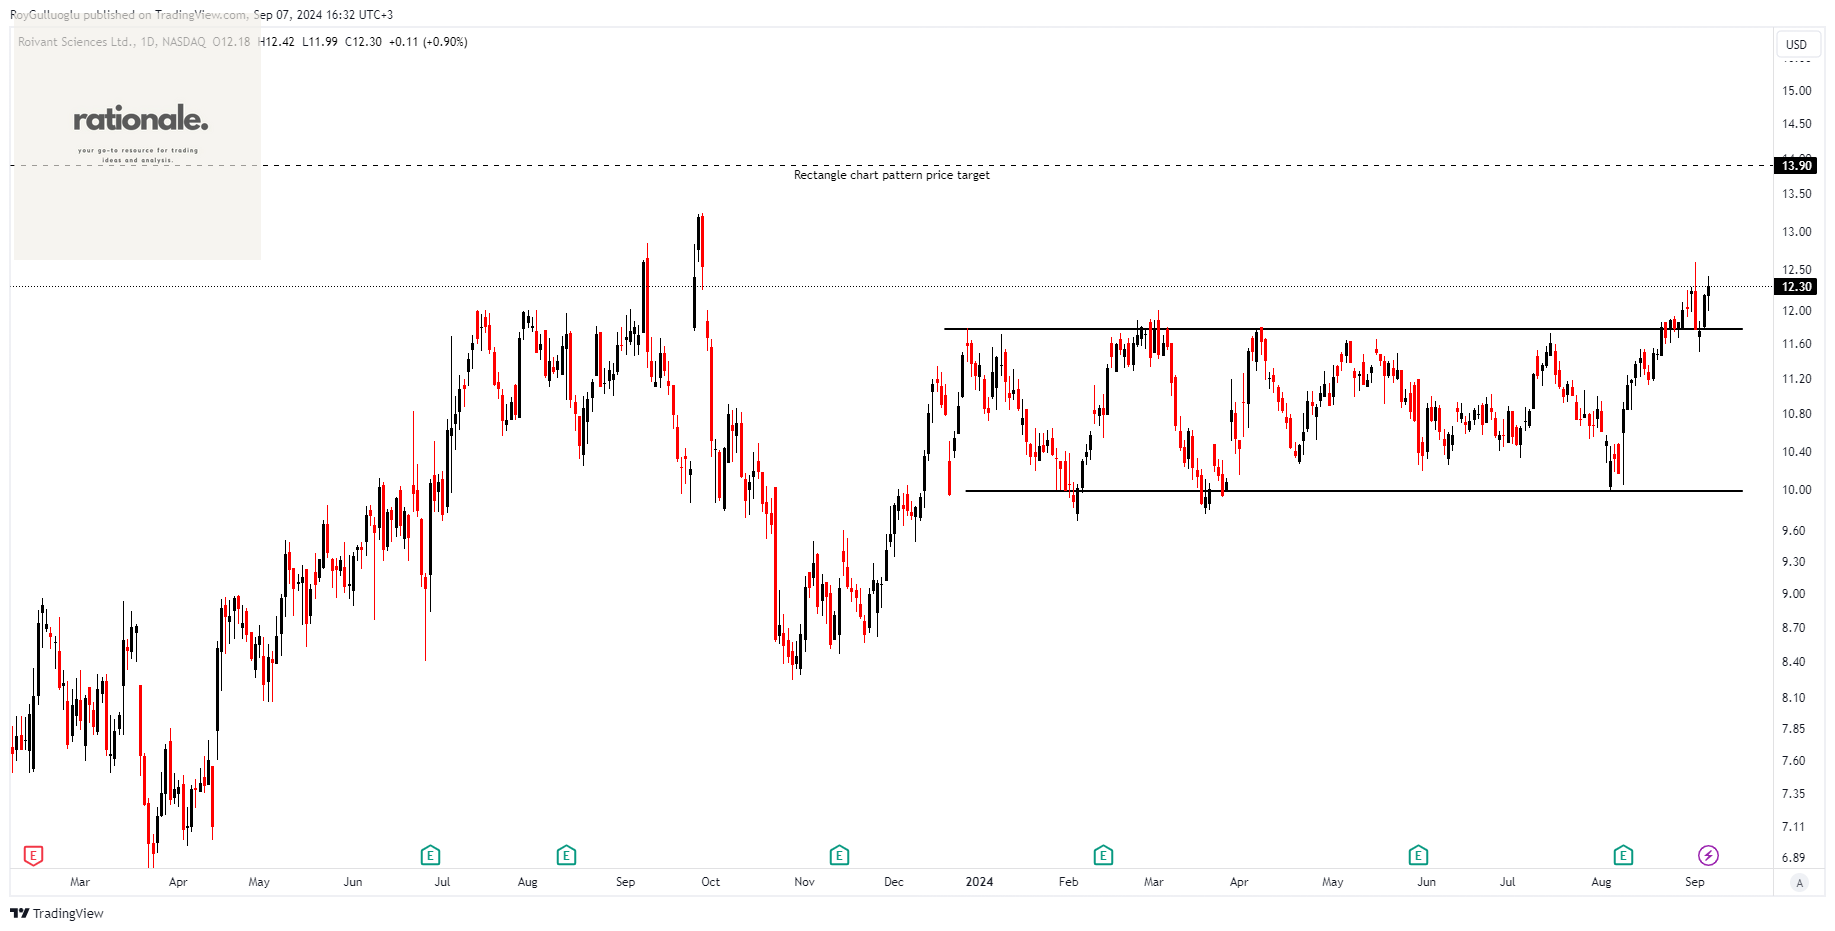
Roivant Sciences Ltd., a commercial-stage biopharmaceutical company, engages in the development and commercialization of medicines for inflammation and immunology areas.
The above daily chart formed an approximately 6-month-long rectangle chart pattern as a bullish continuation after an uptrend.
The horizontal boundary at 11.77 levels acted as a resistance within this pattern.
A daily close above 12.12 levels validated the breakout from the 6-month-long rectangle chart pattern.
Based on this chart pattern, the potential price target is 13.9levels.
ROIV, classified under the "healthcare" sector, falls under the “Mid Cap - Value” stock category.
Dingdong (Cayman) Limited-(DDL/NYSE)-Long Idea
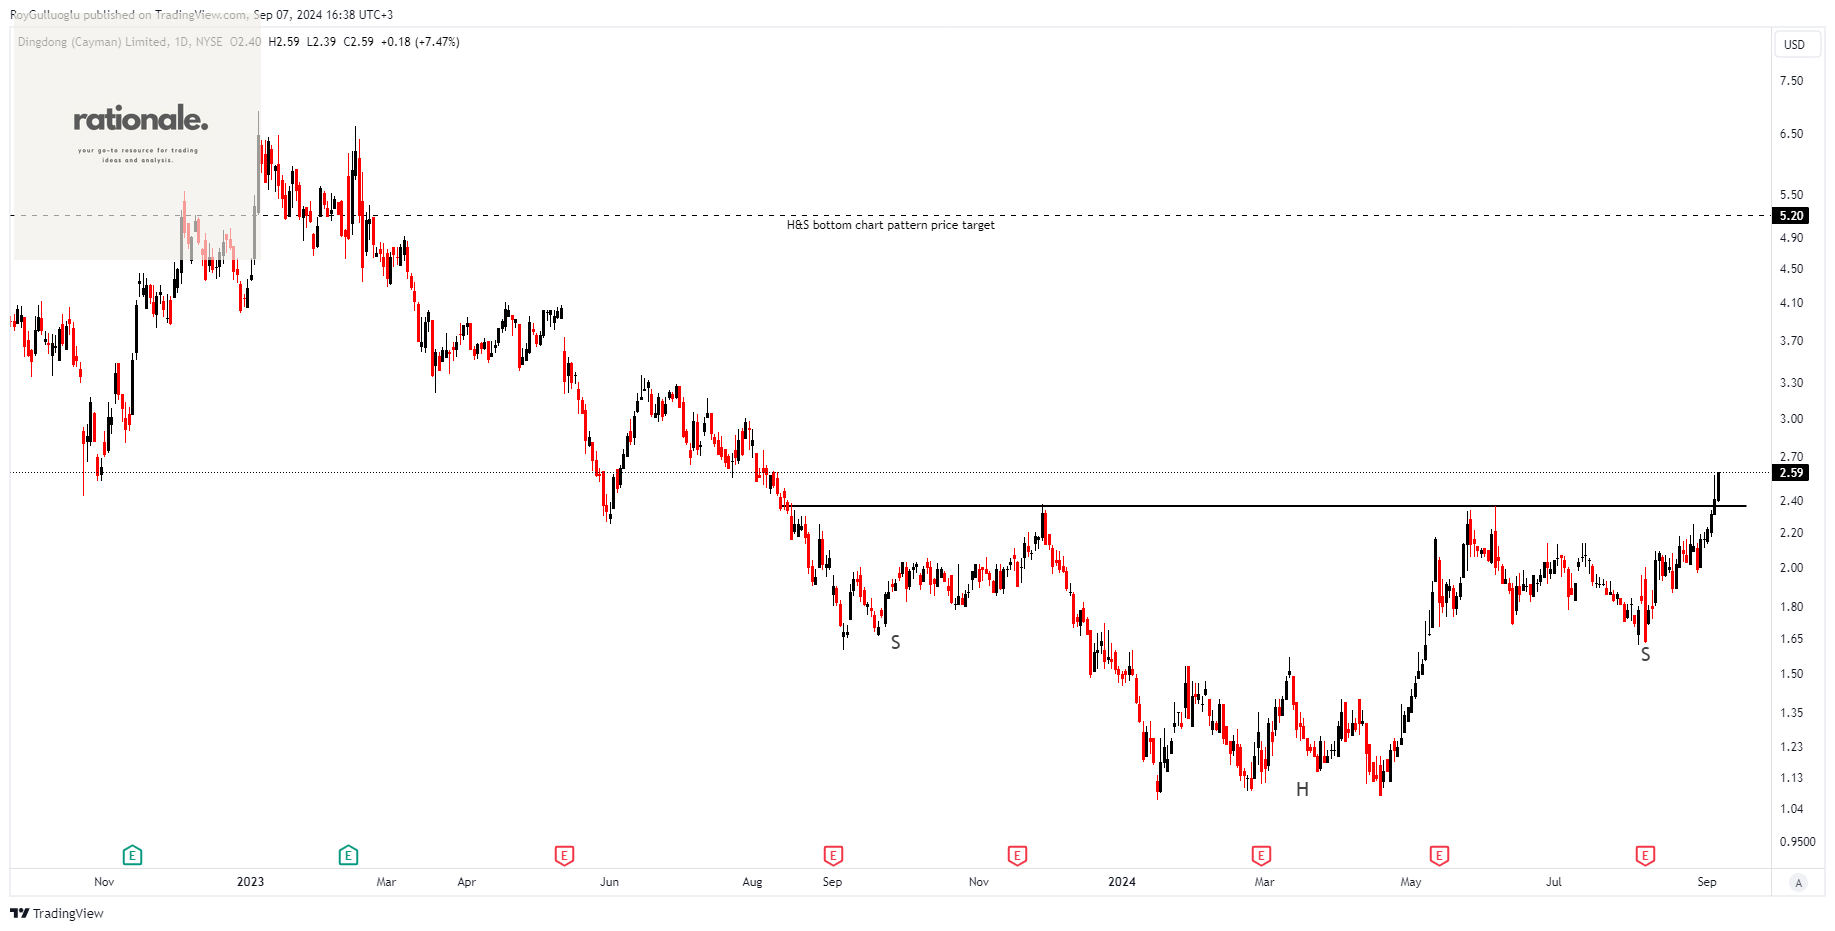
Dingdong (Cayman) Limited is an e-commerce company based in China. It provides a variety of fresh groceries, such as vegetables, meat, eggs, fruits, and seafood. The company also offers prepared foods and other food products, including baked goods, dairy items, seasonings, beverages, instant foods, oils, and snacks.
The above daily chart formed an approximately 8-month-long H&S bottom chart pattern as a bullish continuation after an uptrend.
The horizontal boundary at 2.36 levels acted as a resistance within this pattern.
A daily close above 2.43 levels validated the breakout from the 8-month-long H&S bottom chart pattern.
Based on this chart pattern, the potential price target is 5.2 levels.
DDL, classified under the "consumer defensive" sector, falls under the “Small Cap - Value” stock category.
U-Haul Holding Company-(UHAL/NYSE)-Long Idea
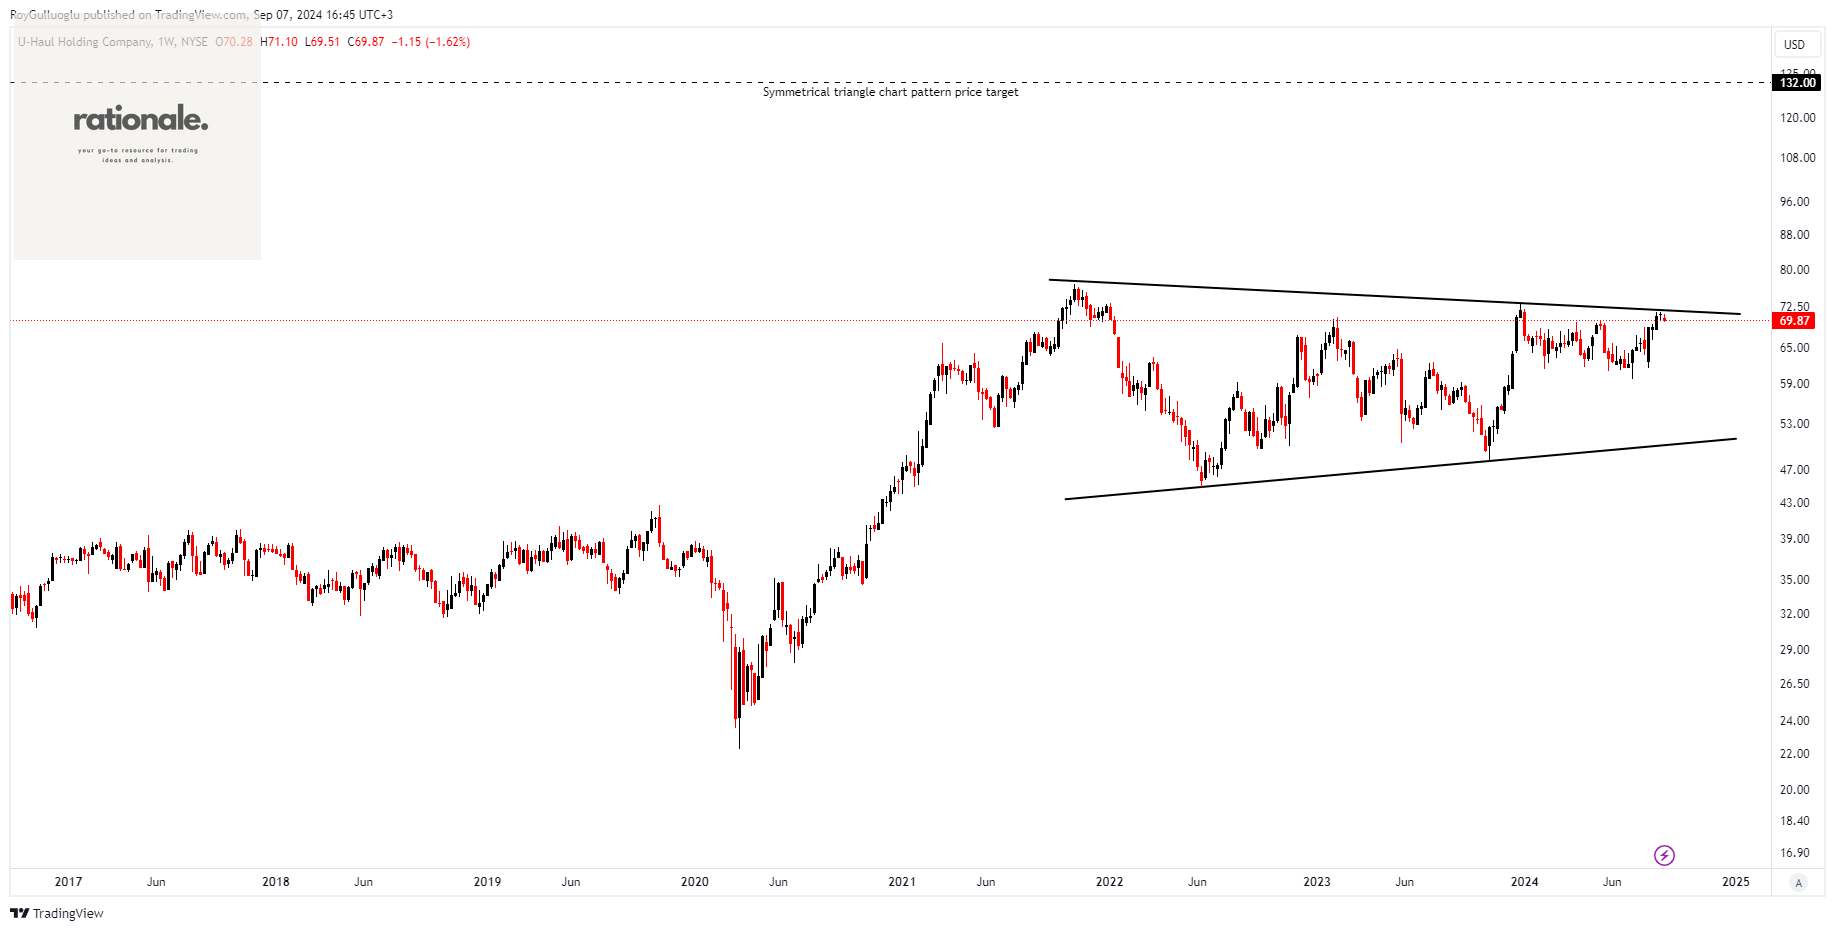
U-Haul Holding Company operates as a do-it-yourself moving and storage provider for household and commercial goods in the United States and Canada.
The above weekly chart formed an approximately 23-month-long symmetrical triangle chart pattern as a bullish continuation after an uptrend.
A daily close above 73.95 levels would validate the breakout from the 23-month-long symmetrical triangle chart pattern.
Based on this chart pattern, the potential price target is 132 levels.
UHAL, classified under the "industrials" sector, falls under the “Large Cap - Value” stock category.
Nomad Foods Limited-(NOMD/NYSE)-Long Idea
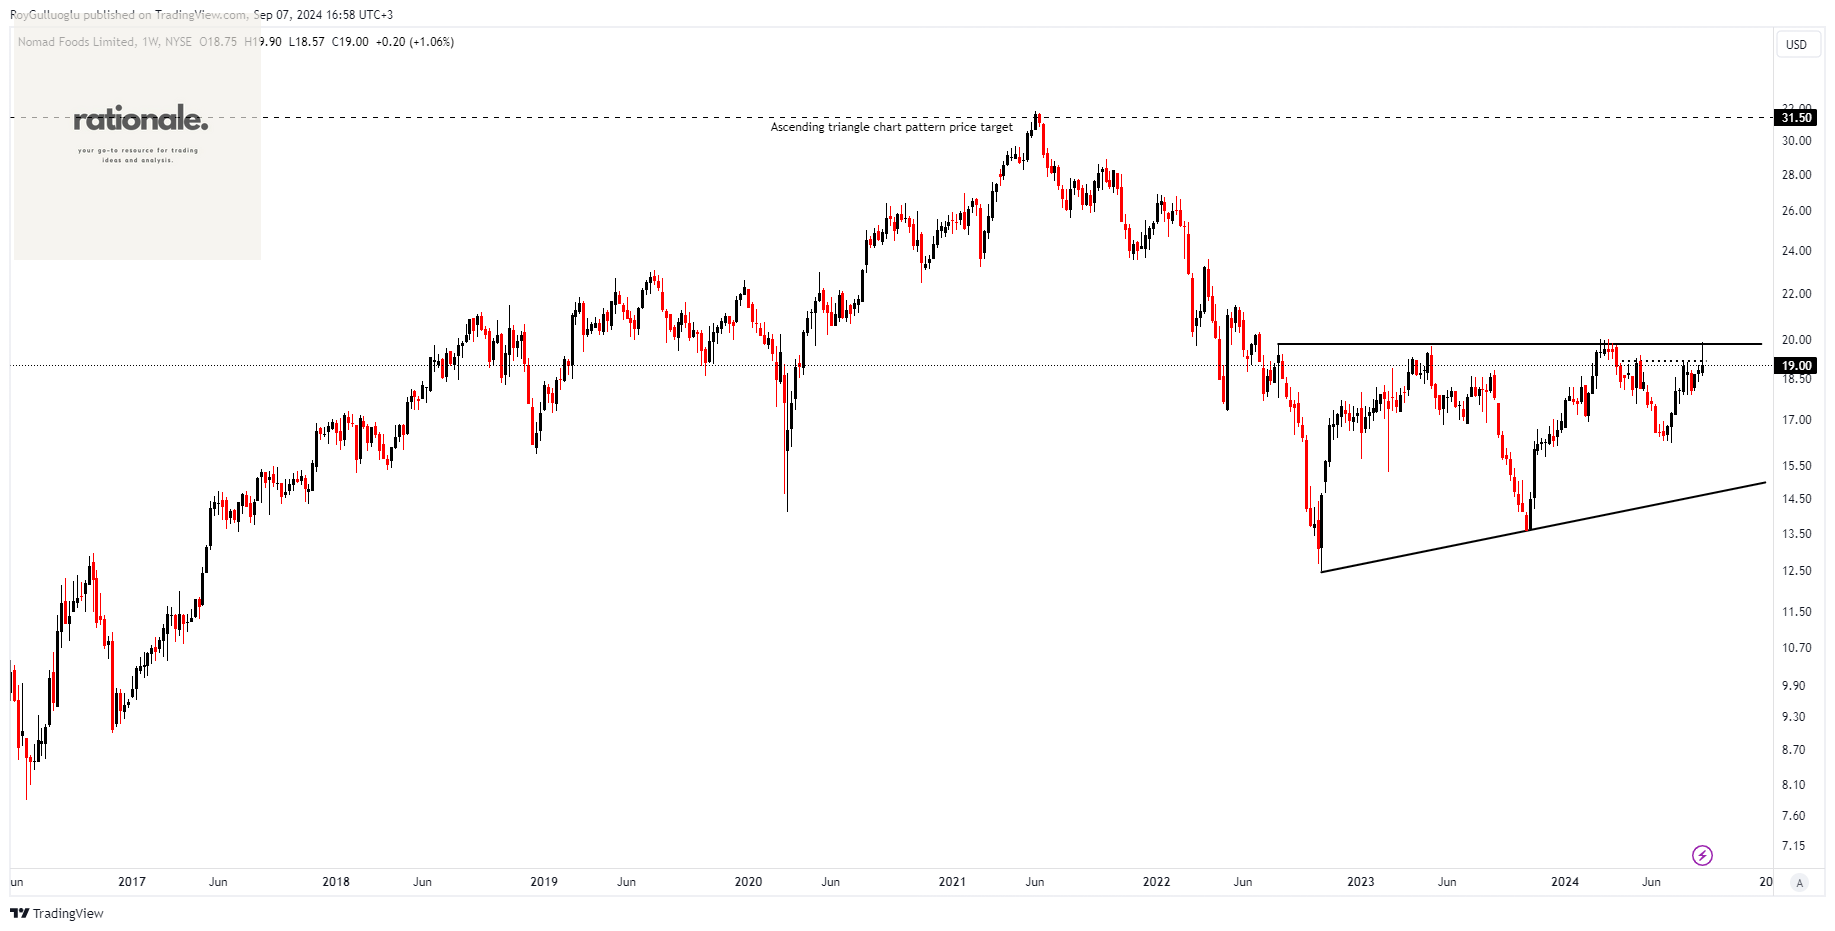
Nomad Foods Limited, along with its subsidiaries, produces, markets, and distributes a variety of frozen food products in the United Kingdom and across international markets.
The above daily chart formed an approximately 24-month-long ascending triangle chart pattern as a bullish reversal after a downtrend.
The horizontal boundary at 19.8 levels acts as a resistance within this pattern.
A daily close above 20.4 levels would validate the breakout from the 24-month-long ascending triangle chart pattern.
Based on this chart pattern, the potential price target is 31.5 levels.
NOMD, classified under the "consumer defensive" sector, falls under the “Mid Cap - Value” stock category.
First Cash Holdings, Inc.-(FCFS/NASDAQ)-Long Idea
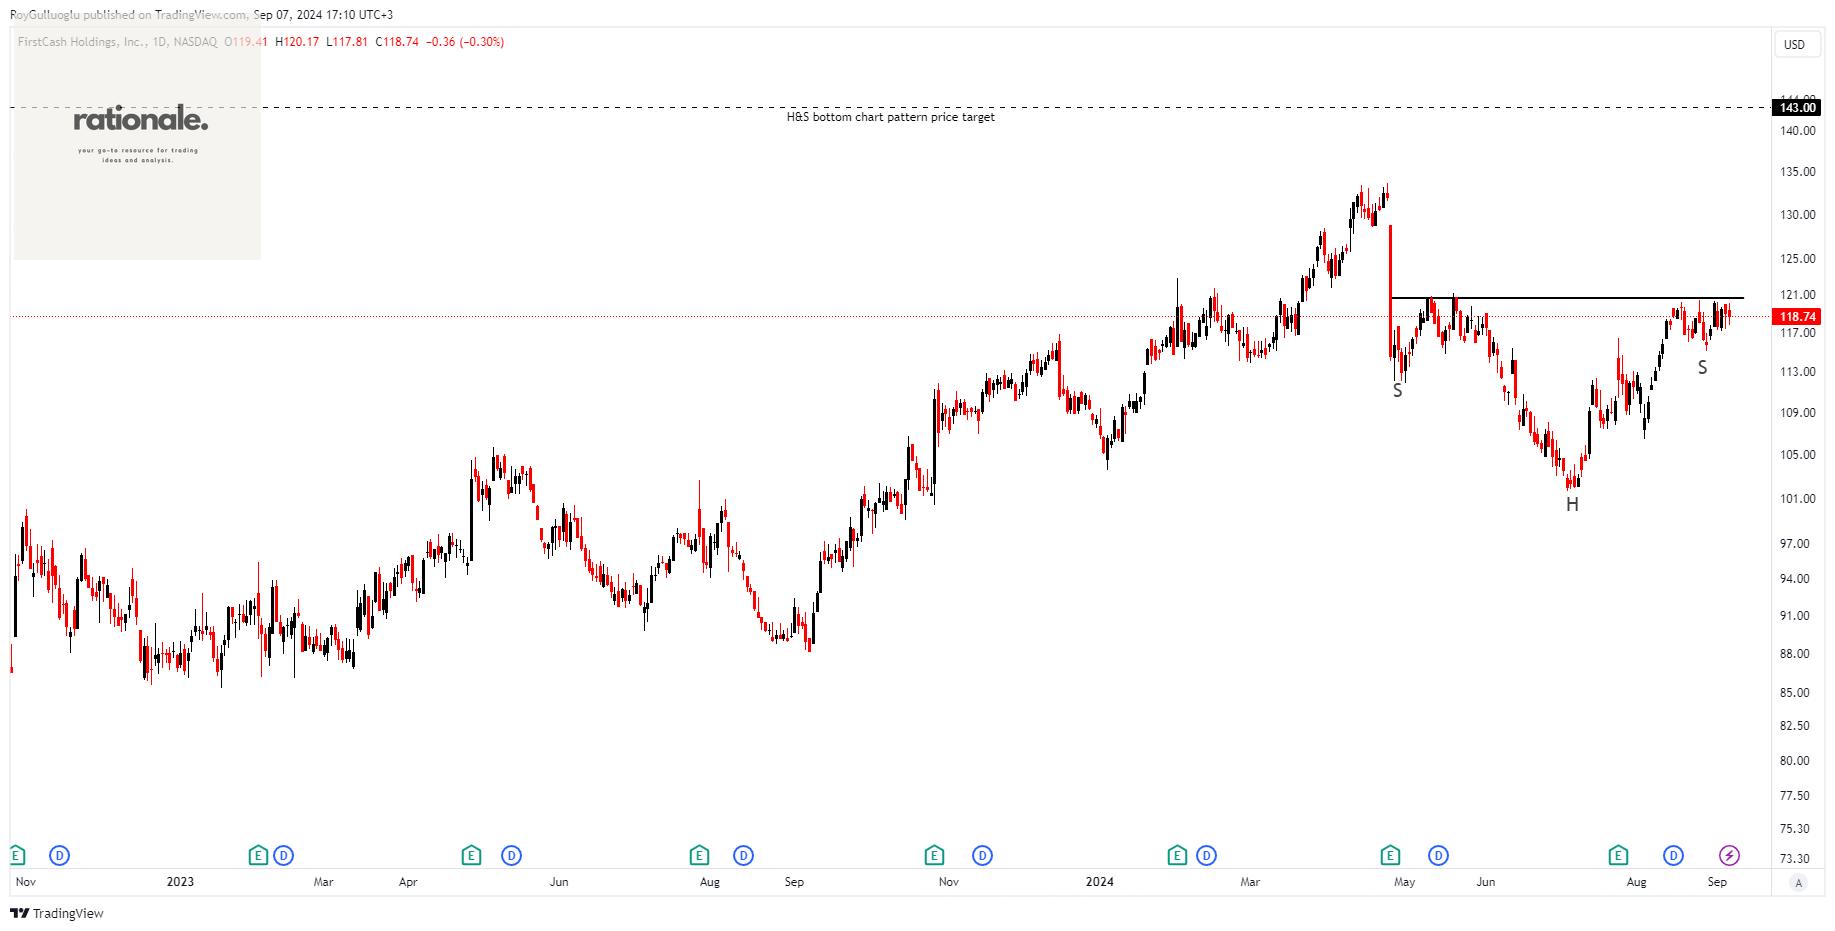
First Cash Holdings, Inc., along with its subsidiaries, operates retail pawn stores across the United States, Mexico, and the rest of Latin America.
The above daily chart formed an approximately 3-month-long H&S bottom chart pattern as a bullish reversal after a downtrend.
The horizontal boundary at 120.6 levels acts as a resistance within this pattern.
A daily close above 124.21 levels would validate the breakout from the 3-month-long H&S bottom chart pattern.
Based on this chart pattern, the potential price target is 143 levels.
FCFS, classified under the "financial services" sector, falls under the “Mid Cap - Income” stock category.