


New setups
TICKERS: FI(NYSE), TRUP(NASDAQ), MMS(NYSE), SYK(NYSE), PWR(NYSE), DAVE(NASDAQ)
Fiserv Inc.-(FI/NYSE)-Long Idea
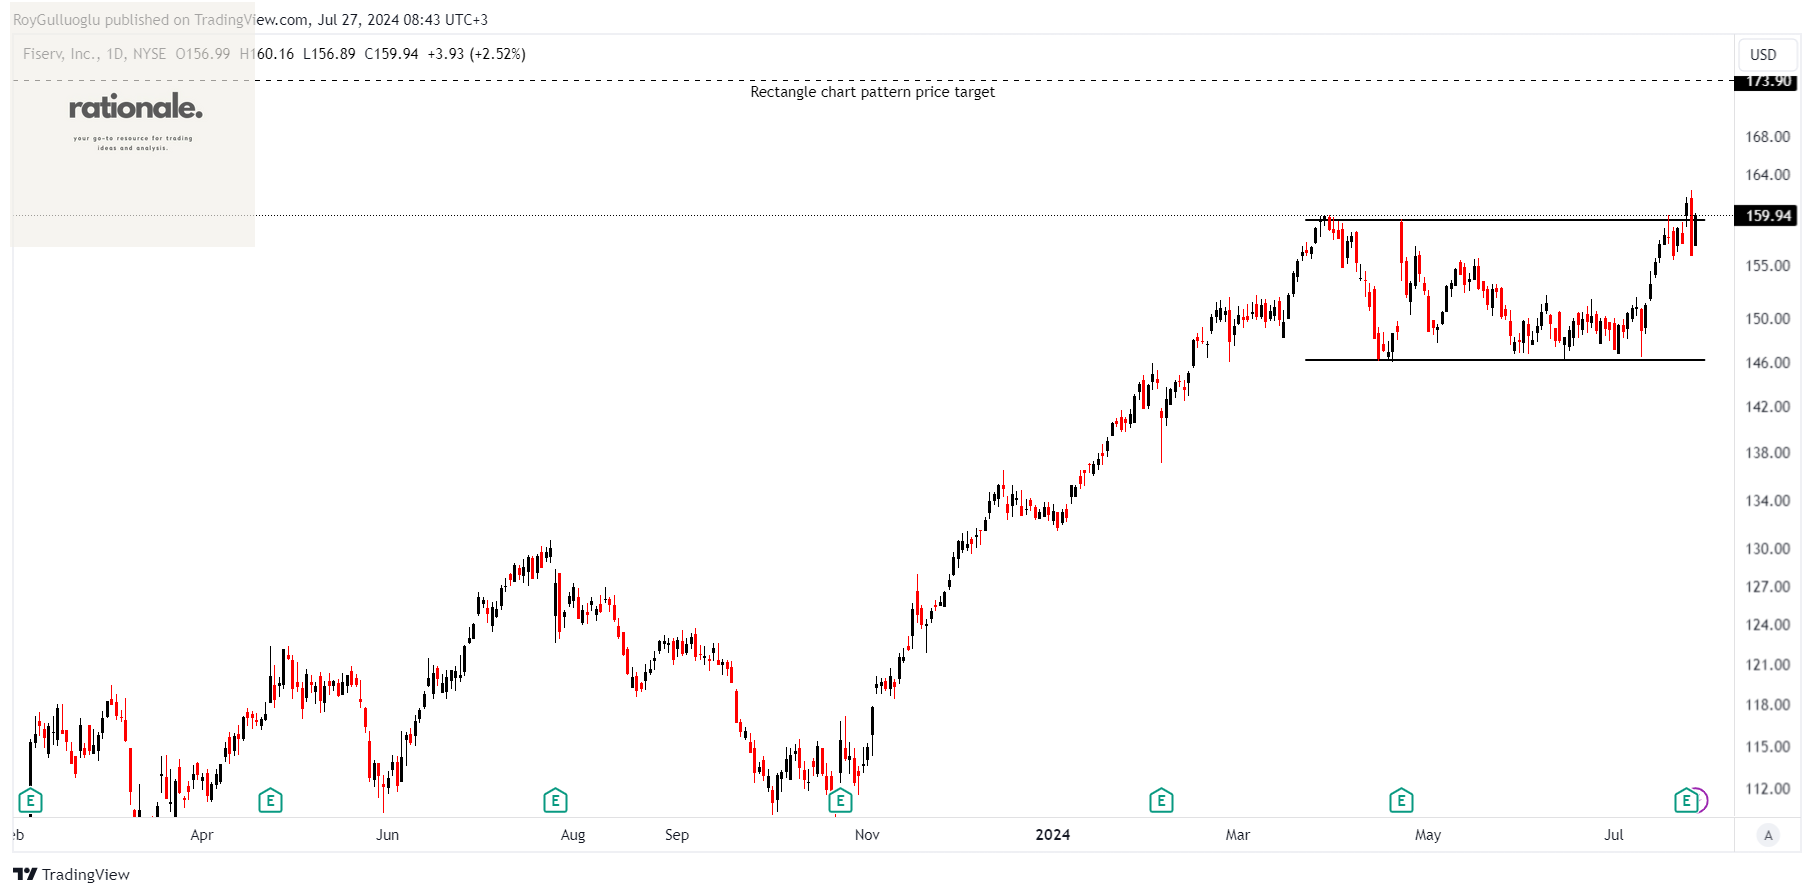
Fiserv, Inc. and its subsidiaries offer payments and financial technology services across the United States, Europe, the Middle East and Africa, Latin America, the Asia-Pacific, and other international markets.
The above daily chart formed an approximately 3-month-long rectangle chart pattern as a bullish continuation after an uptrend.
The horizontal boundary at 159.47 levels acts as a resistance within this pattern.
A daily close above 164.25 levels would validate the breakout from the 3-month-long rectangle chart pattern.
Based on this chart pattern, the potential price target is 173.9 levels.
Trupanion, Inc.-(TRUP/NASDAQ)-Long Idea
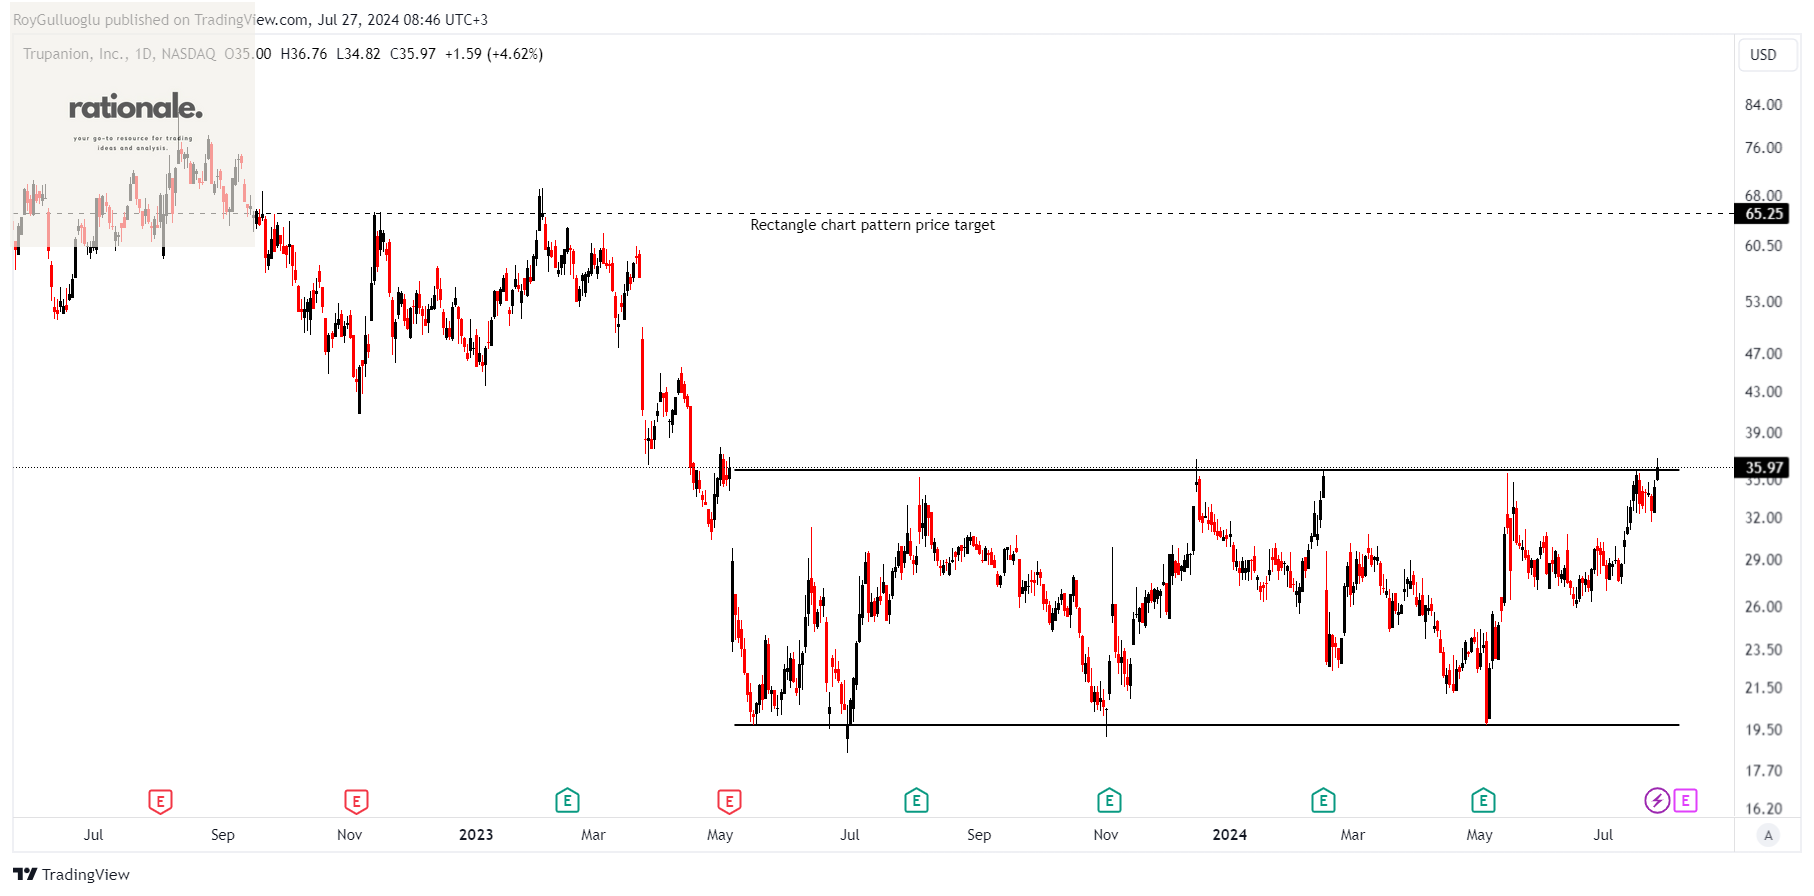
Trupanion, Inc. and its subsidiaries offer monthly subscription-based medical insurance for cats and dogs in the United States, Canada, Continental Europe, and Australia.
The above daily chart formed an approximately 10-month-long rectangle chart pattern as a bullish reversal after a downtrend.
The horizontal boundary at 35.78 levels acts as a resistance within this pattern.
A daily close above 36.85 levels would validate the breakout from the 3-month-long rectangle chart pattern.
Based on this chart pattern, the potential price target is 65.25 levels.
Maximus, Inc.-(MMS/NYSE)-Long Idea
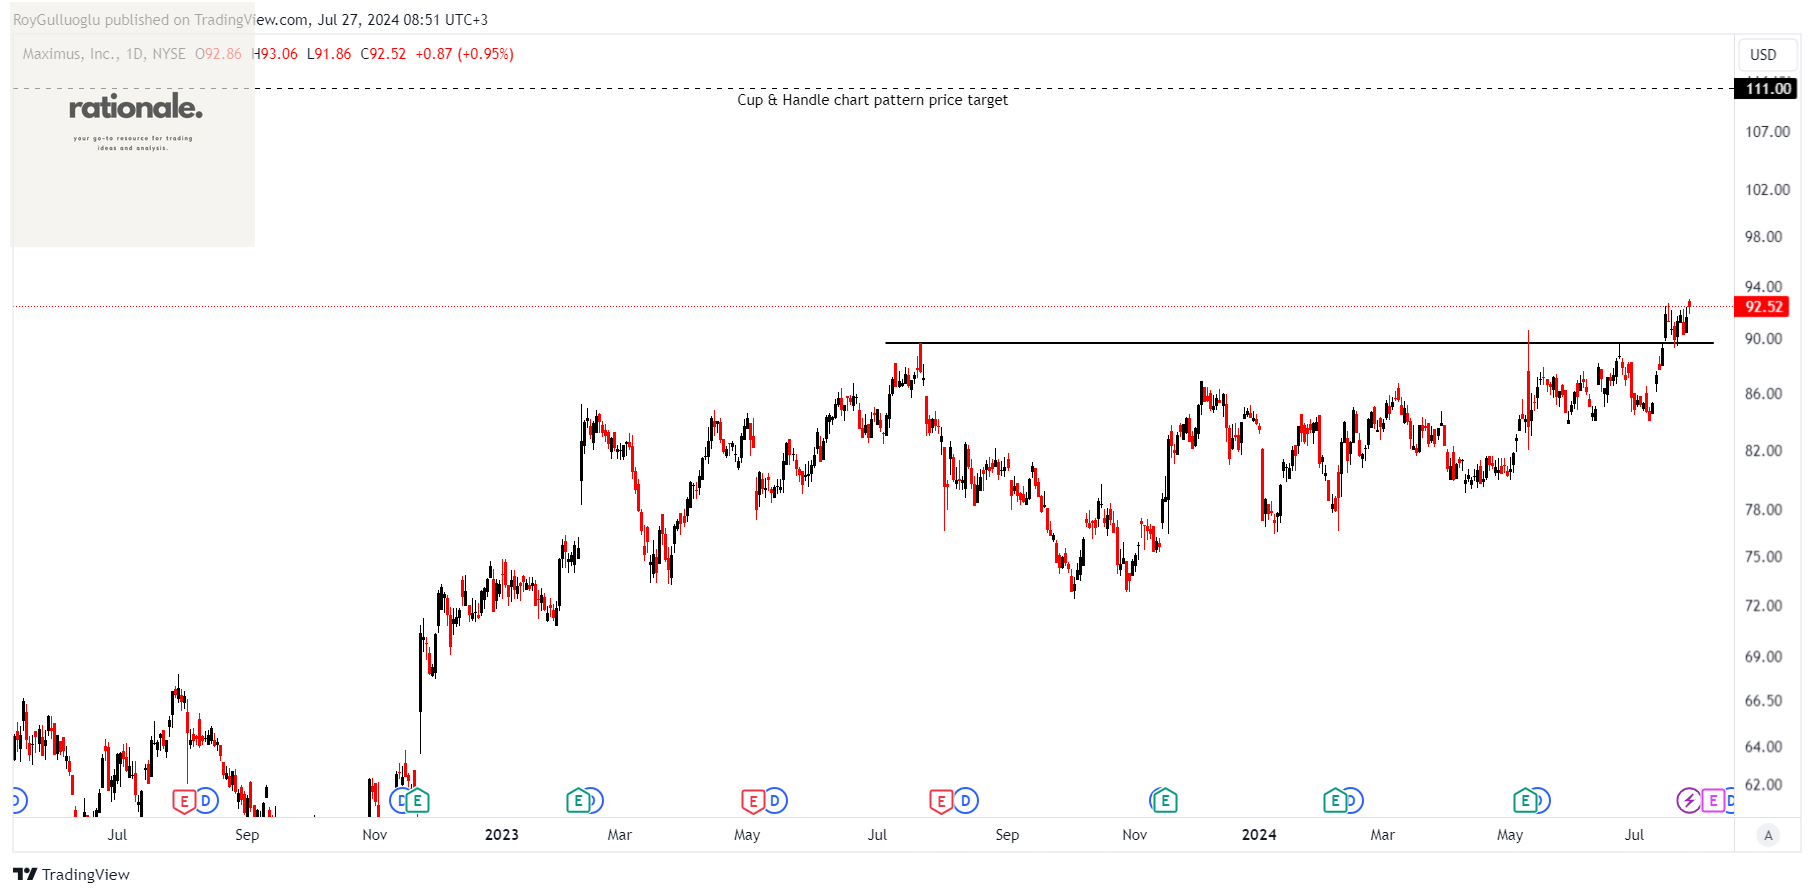
Maximus, Inc. provides government services both in the United States and internationally. The company operates through three segments: U.S. Federal Services, U.S. Services, and Outside the U.S.
The above daily chart formed an approximately 8-month-long cup & handle chart pattern as a bullish continuation after an uptrend.
The horizontal boundary at 89.65 levels acts as a support within this pattern.
A daily close above 92.34 levels would validate the breakdown from the 8-month-long cup & handle chart pattern.
Based on this chart pattern, the potential price target is 111 levels.
Stryker Corporation-(SYK/NYSE)-Short Idea
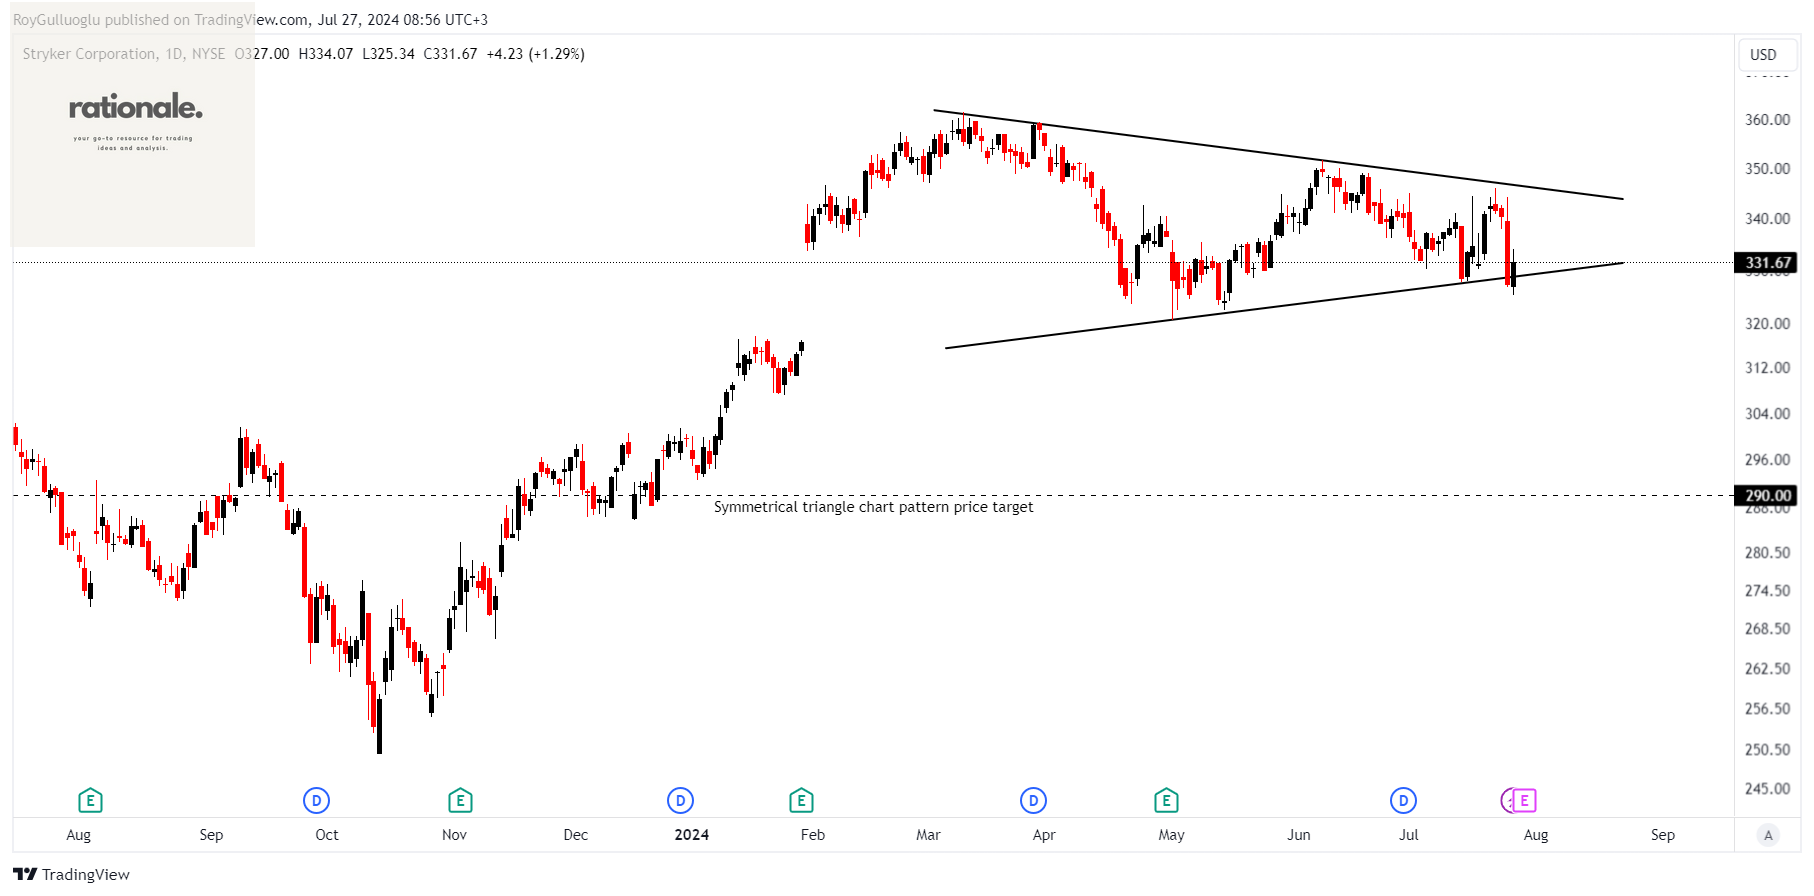
Stryker Corporation is a medical technology company operating through two segments: MedSurg and Neurotechnology, and Orthopaedics and Spine.
The above daily chart formed an approximately 3-month-long symmetrical triangle chart pattern as a bullish reversal after an uptrend.
A daily close below 318.16 levels would validate the breakdown from the 3-month-long symmetrical triangle chart pattern.
Based on this chart pattern, the potential price target is 290 levels.
Quanta Services, Inc.-(PWR/NYSE)-Long/Short Idea
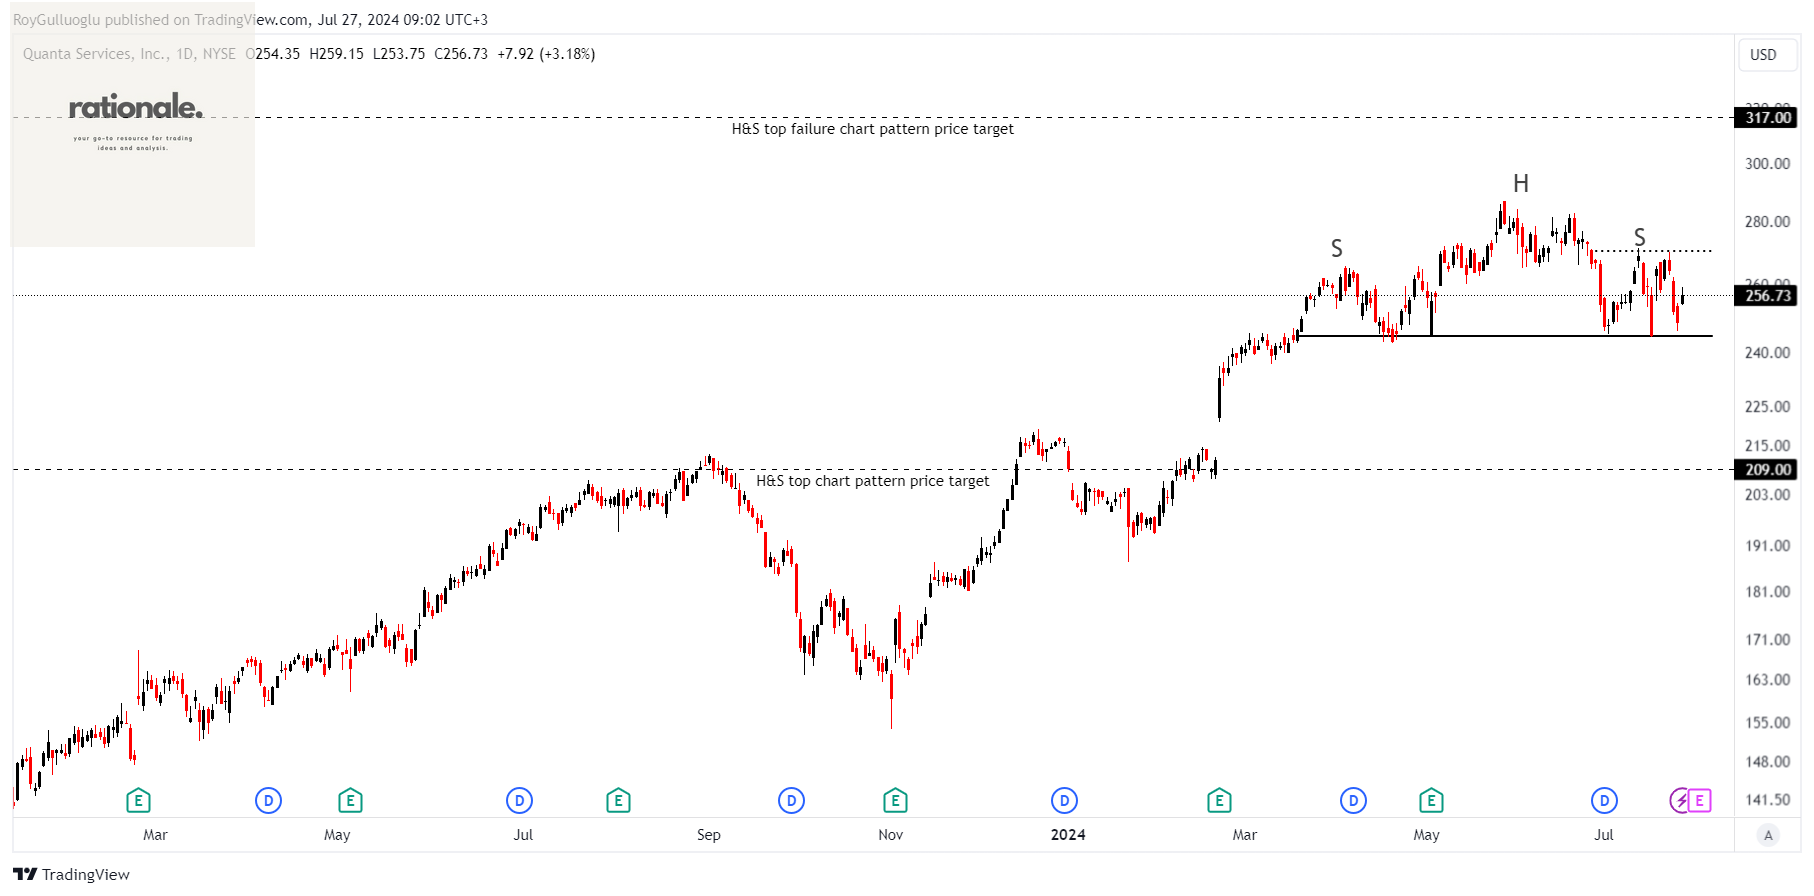
Quanta Services, Inc. delivers infrastructure solutions for the electric and gas utility, renewable energy, communications, and pipeline and energy industries in the United States, Canada, Australia, and internationally.
The above daily chart formed an approximately 3-month-long H&S top chart pattern formation that potentially would act as a reversal or failure after an uptrend.
The horizontal boundary at 244.71 levels acts as a support within the H&S top chart pattern and the horizontal boundary at 270.45 levels acts as a resistance within the H&S failure chart pattern.
A daily close below 262.34 levels would validate the breakdown from the 3-month-long H&S top chart pattern while a daily close above 278.56 levels would validate the breakout H&S failure chart pattern.
Based on this chart pattern, the potential price targets are 209 and 317 levels respectively.
Dave Inc.-(DAVE/NASDAQ)-Long/Short Idea
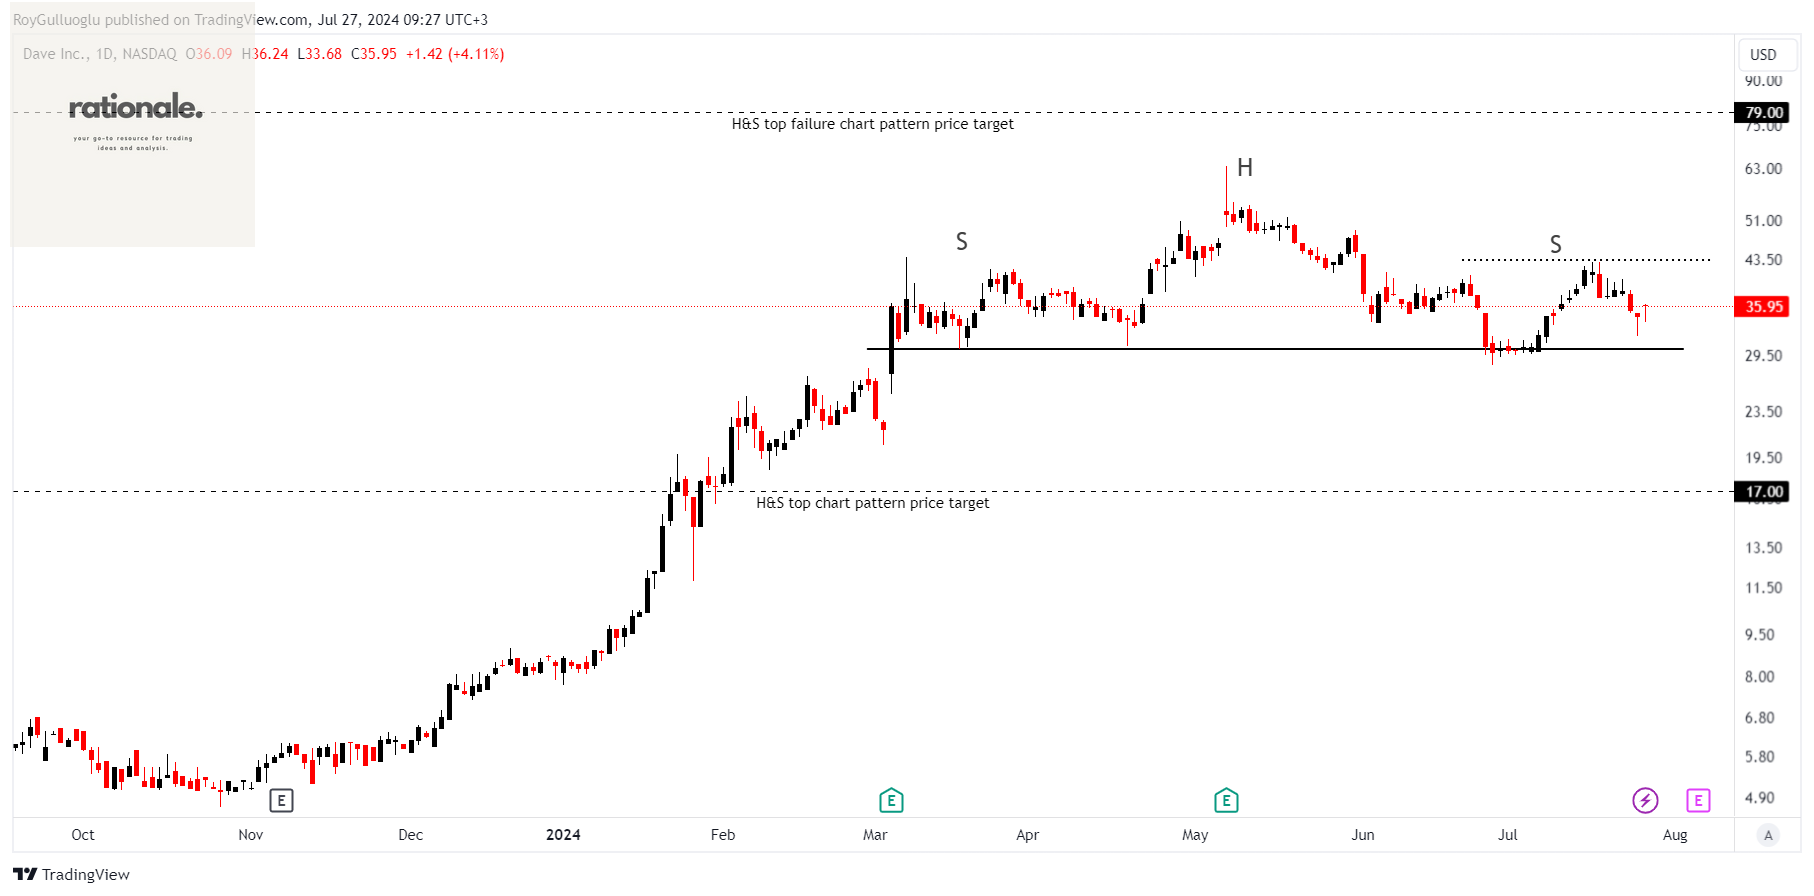
Dave Inc. offers a range of financial products and services through its financial services platform.
The above daily chart formed an approximately 3-month-long H&S top chart pattern formation that potentially would act as a reversal or failure after an uptrend.
The horizontal boundary at 30.21 levels acts as a support within the H&S top chart pattern and the horizontal boundary at 43.41 levels acts as a resistance within the H&S failure chart pattern.
A daily close below 29.3 levels would validate the breakdown from the 3-month-long H&S top chart pattern while a daily close above 44.71 levels would validate the breakout H&S failure chart pattern.
Based on this chart pattern, the potential price targets are 17 and 79 levels respectively.