


PJT Partners Inc.-(PJT/NYSE)-Long Idea
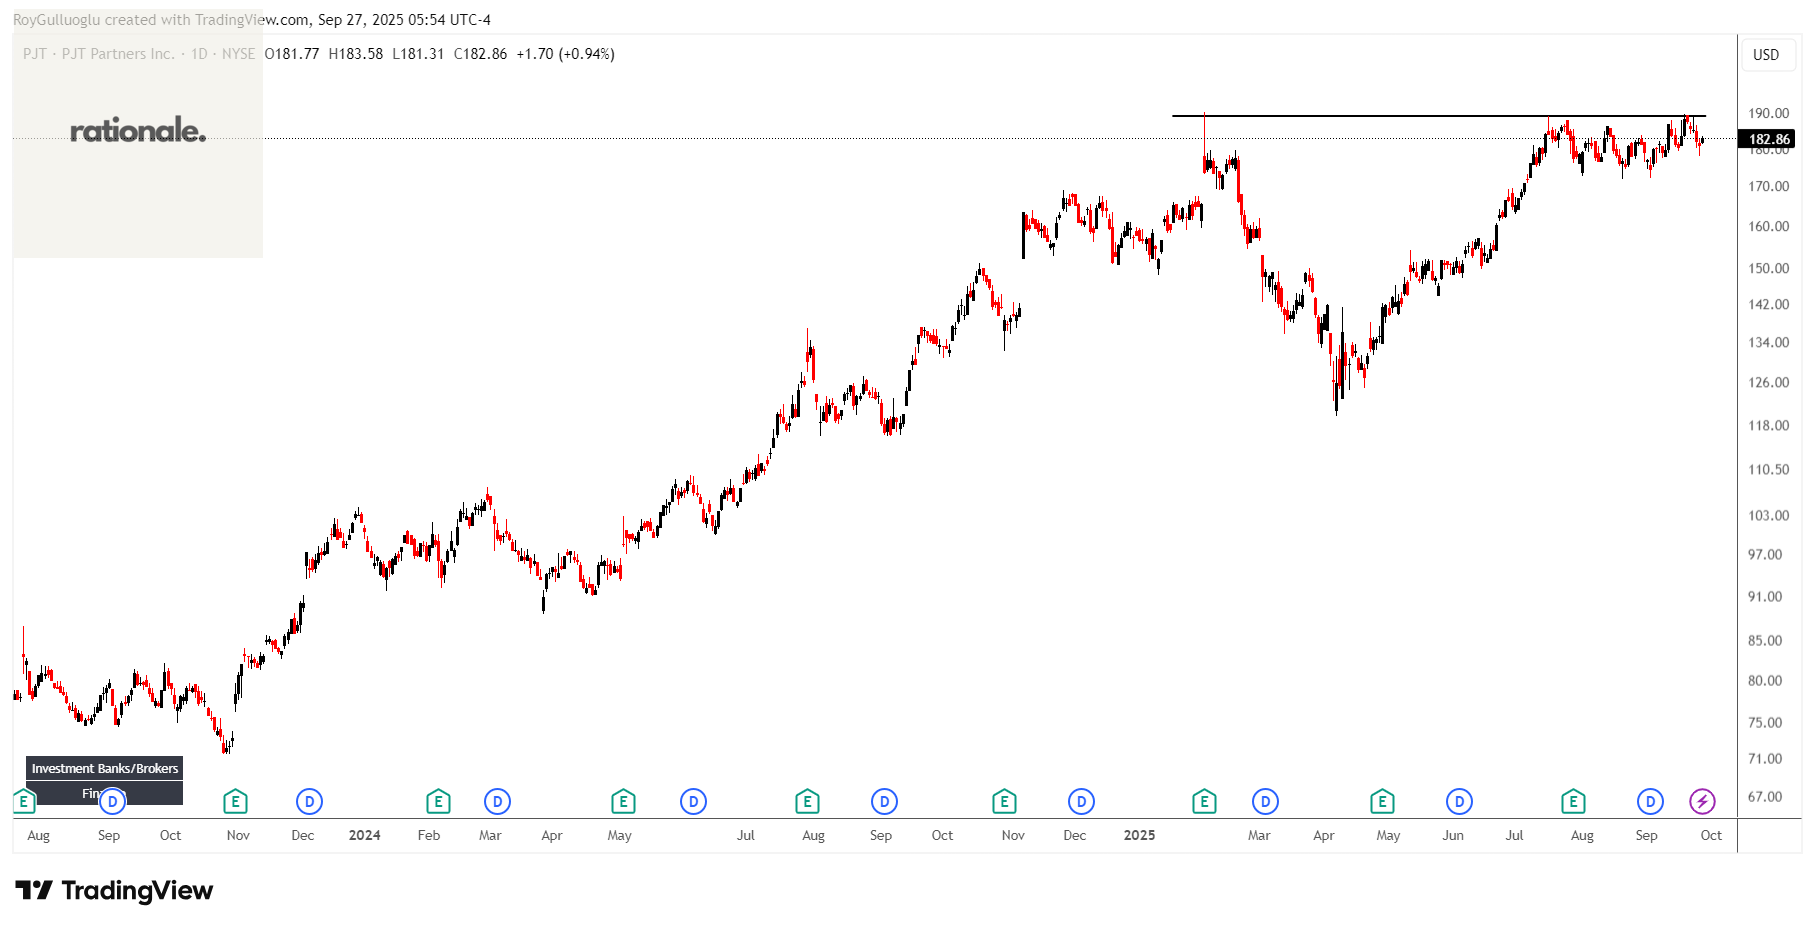
PJT Partners Inc., an investment bank, provides various strategic advisory, shareholder advisory, capital markets advisory, and restructuring and special situations services to corporations, financial sponsors, institutional investors, and governments worldwide
The above daily chart formed an approximately 6-month-long cup & handle chart pattern as a bullish continuation after an uptrend.
The horizontal boundary at 189.19 levels acts as a resistance within this pattern.
A daily close above 194.85 levels would validate the breakout from the 6-month-long cup & handle chart pattern.
Based on this chart pattern, the potential price target is 297 levels.
PJT, classified under the “financial services” sector, falls under the “Mid Cap - Income” stock category.
Universal Health Services, Inc.-(UHS/NYSE)-Long Idea
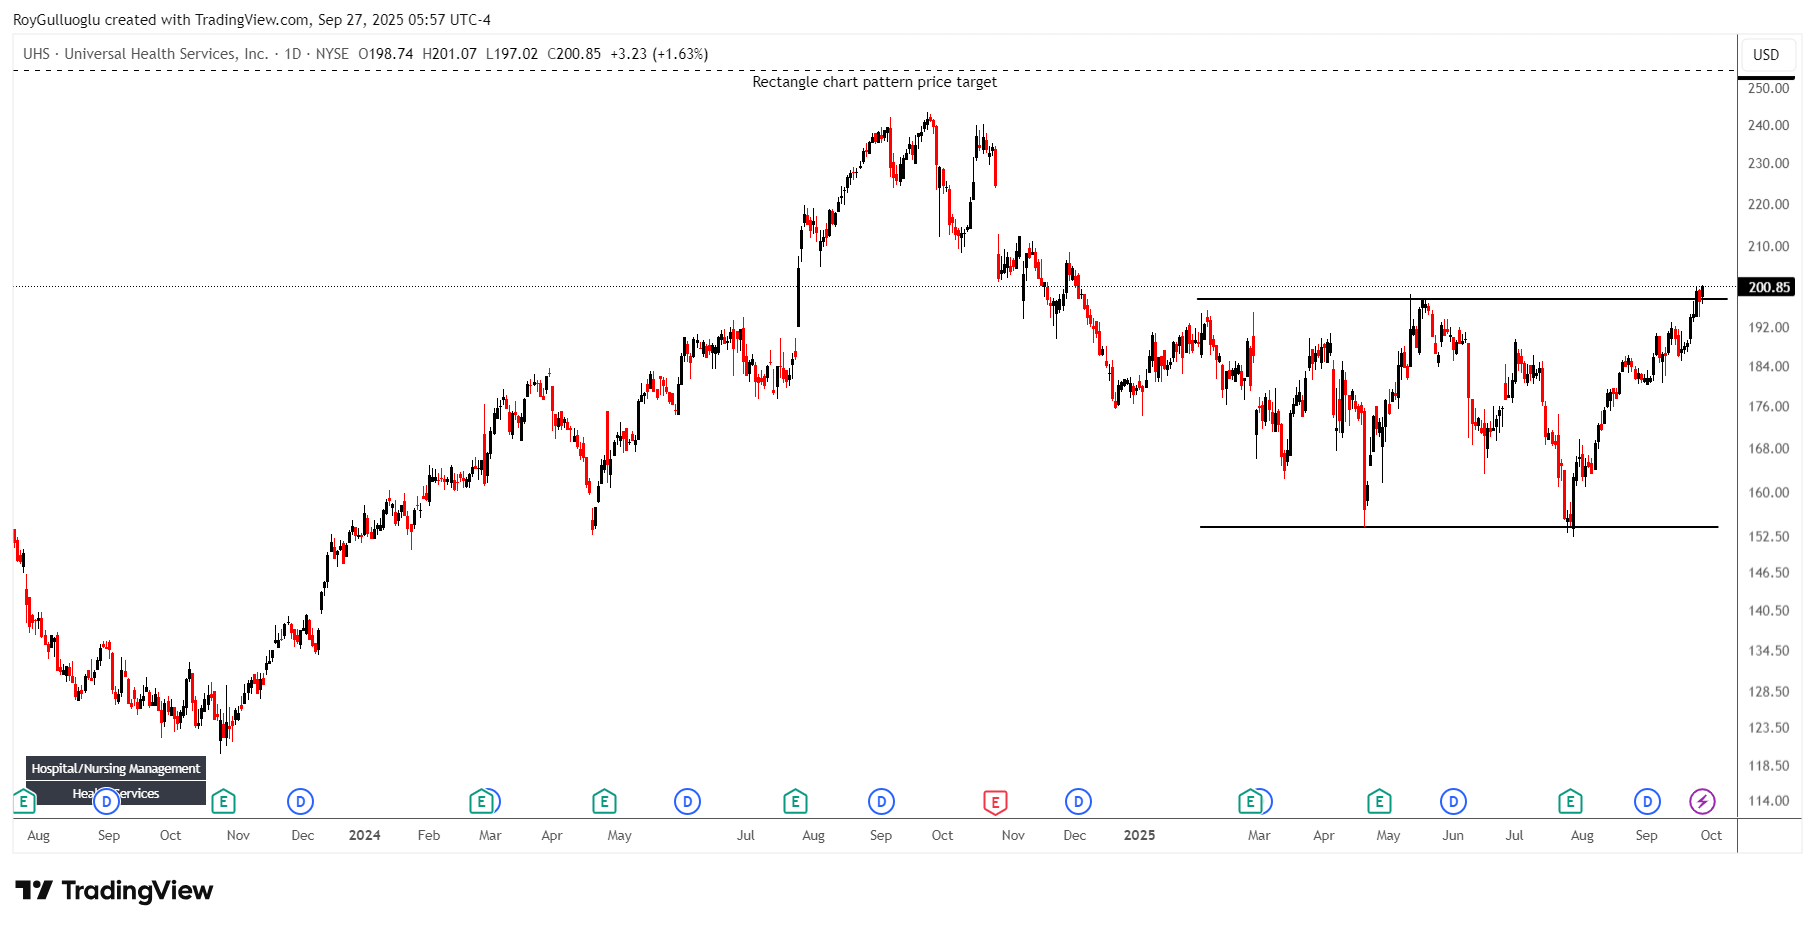
Universal Health Services, Inc., through its subsidiaries, owns and operates acute care hospitals, and outpatient and behavioral health care facilities.
The above daily chart formed an approximately 5-month-long rectangle chart pattern as a bullish reversal after a downtrend.
The horizontal boundary at 198 levels acts as a resistance within this pattern.
A daily close above 204 levels would validate the breakout from the 5-month-long rectangle chart pattern.
Based on this chart pattern, the potential price target is 255 levels.
UHS, classified under the “healthcare” sector, falls under the “Large Cap - Value” stock category.
Globalstar, Inc.-(GSAT/NASDAQ)-Long Idea
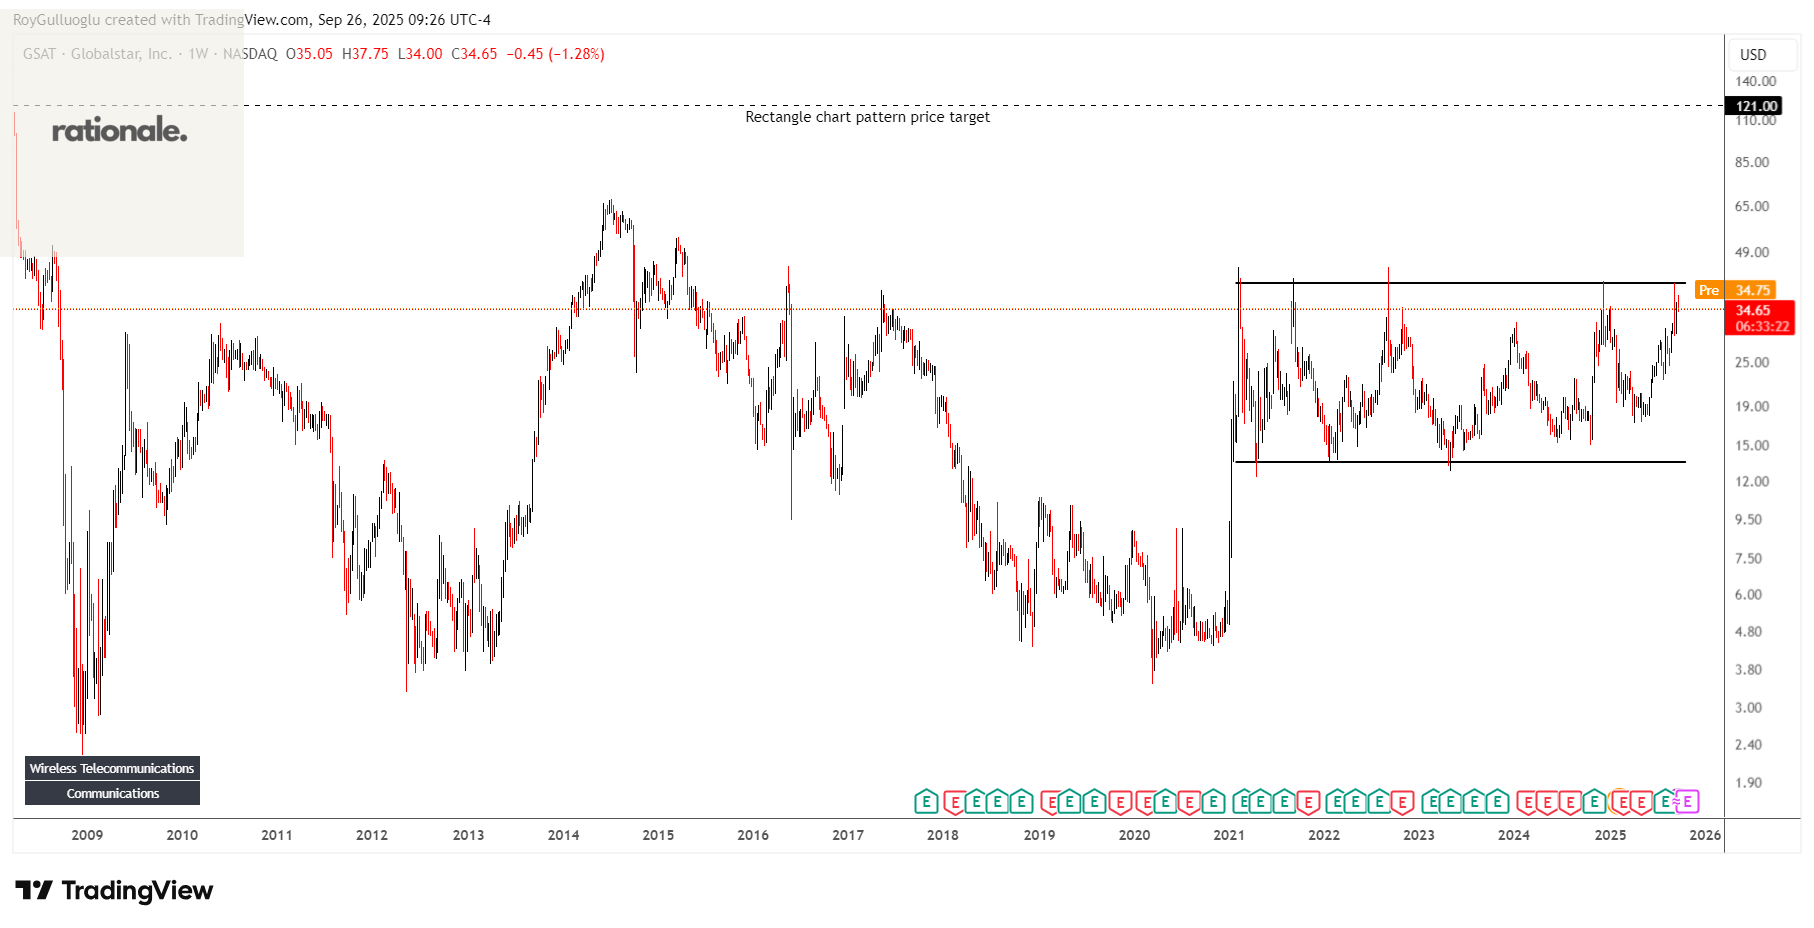
Globalstar, Inc. provides mobile satellite services in the United States, Canada, Europe, Central and South America, and internationally.
The above weekly chart formed an approximately 58-month-long rectangle chart pattern as a bullish continuation after an uptrend.
The horizontal boundary at 40.5 levels acts as a resistance within this pattern.
A daily close above 41.71 levels would validate the breakout from the 58-month-long rectangle chart pattern.
Based on this chart pattern, the potential price target is 121 levels.
GSAT, classified under the “communication services” sector, falls under the “Mid Cap - Value” stock category.
HA Sustainable Infrastructure Capital, Inc. -(HASI/NYSE)-Long Idea
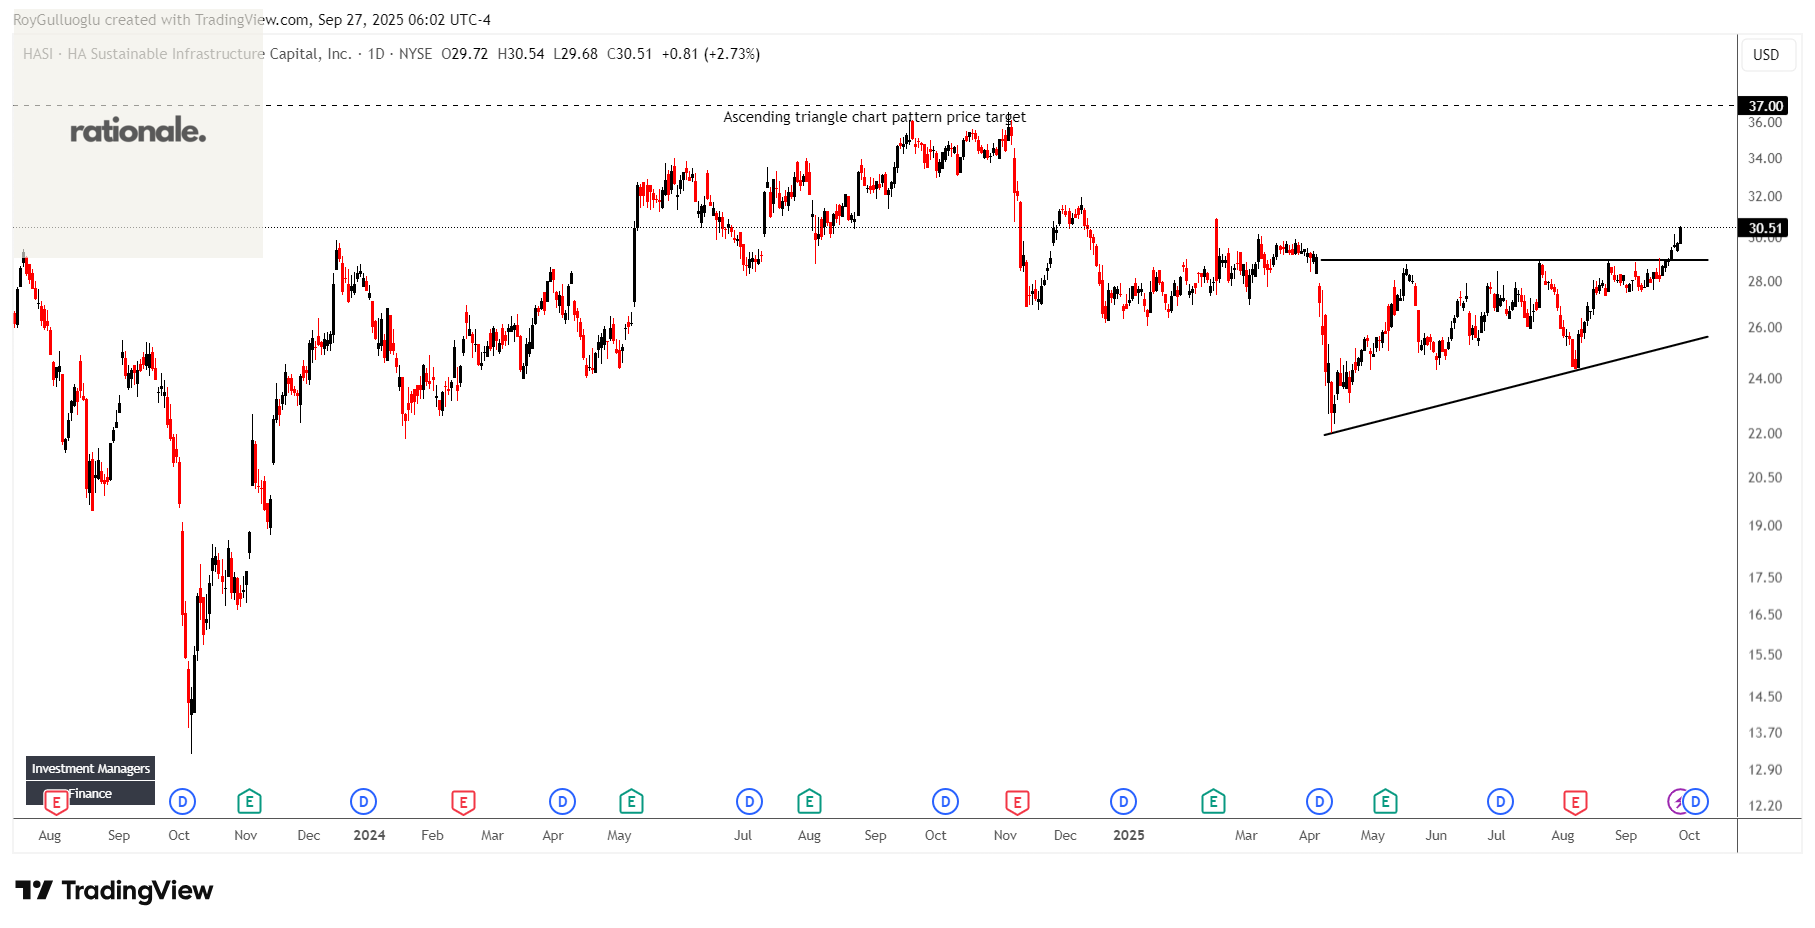
HA Sustainable Infrastructure Capital, Inc., through its subsidiaries, engages in the investment in energy efficiency, renewable energy, and sustainable infrastructure markets in the United States.
The above daily chart formed an approximately 4-month-long ascending triangle chart pattern as a bullish reversal after a downtrend.
The horizontal boundary at 28.94 levels acted as a resistance within this pattern.
A daily close above 29.8 levels validated the breakout from the 4-month-long ascending triangle chart pattern.
Based on this chart pattern, the potential price target is 37 levels.
HASI, classified under the “financial services” sector, falls under the “Mid Cap - Income” stock category.
Türk Tuborg Bira ve Malt Sanayii A.S.-(TBORG/BIST)-Long Idea
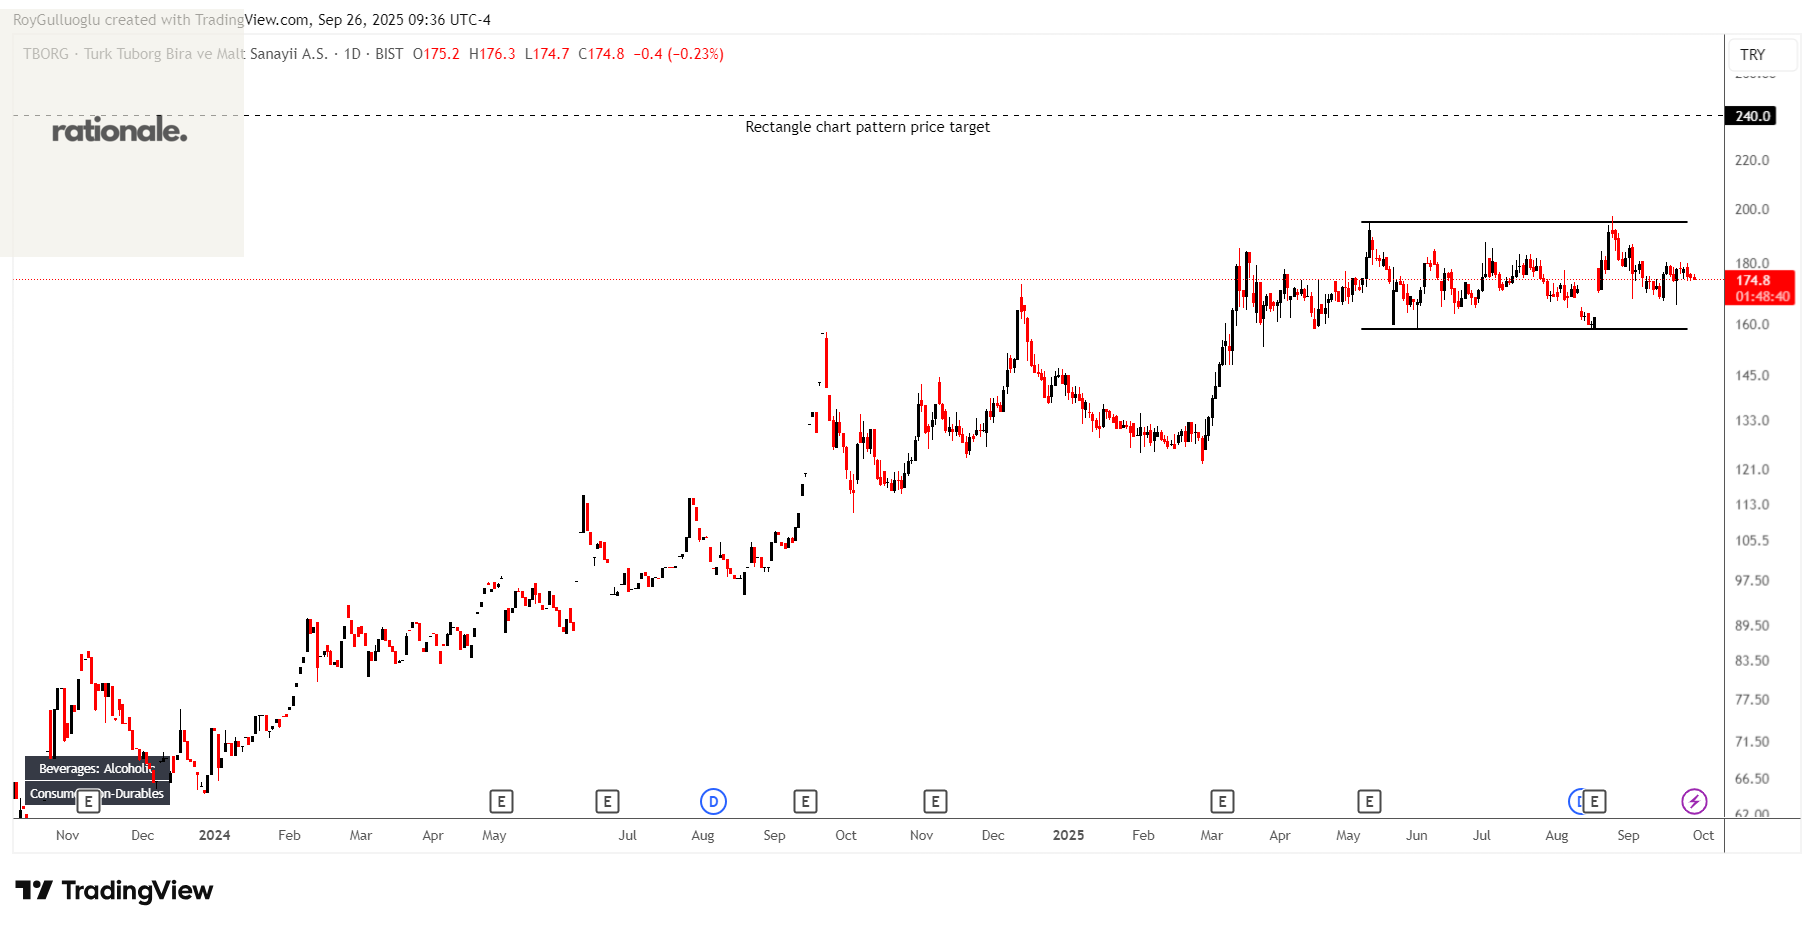
Türk Tuborg Bira ve Malt Sanayii A.S. produces, sells, and distributes beer and malt in Turkey and internationally.
The above daily chart formed an approximately 3-month-long rectangle chart pattern as a bullish continuation after an uptrend.
The horizontal boundary at 194.8 levels acts as a resistance within this pattern.
A daily close above 200.6 levels would validate the breakout from the 3-month-long rectangle chart pattern.
Based on this chart pattern, the potential price target is 240 levels.