


iRhythm Holdings, Inc.-(IRTC/NASDAQ)-Long Idea
iRhythm Holdings, Inc., a digital healthcare company, engages in the design, development, and commercialization of device-based technology that provides ambulatory cardiac monitoring services to diagnose arrhythmias in the United States.
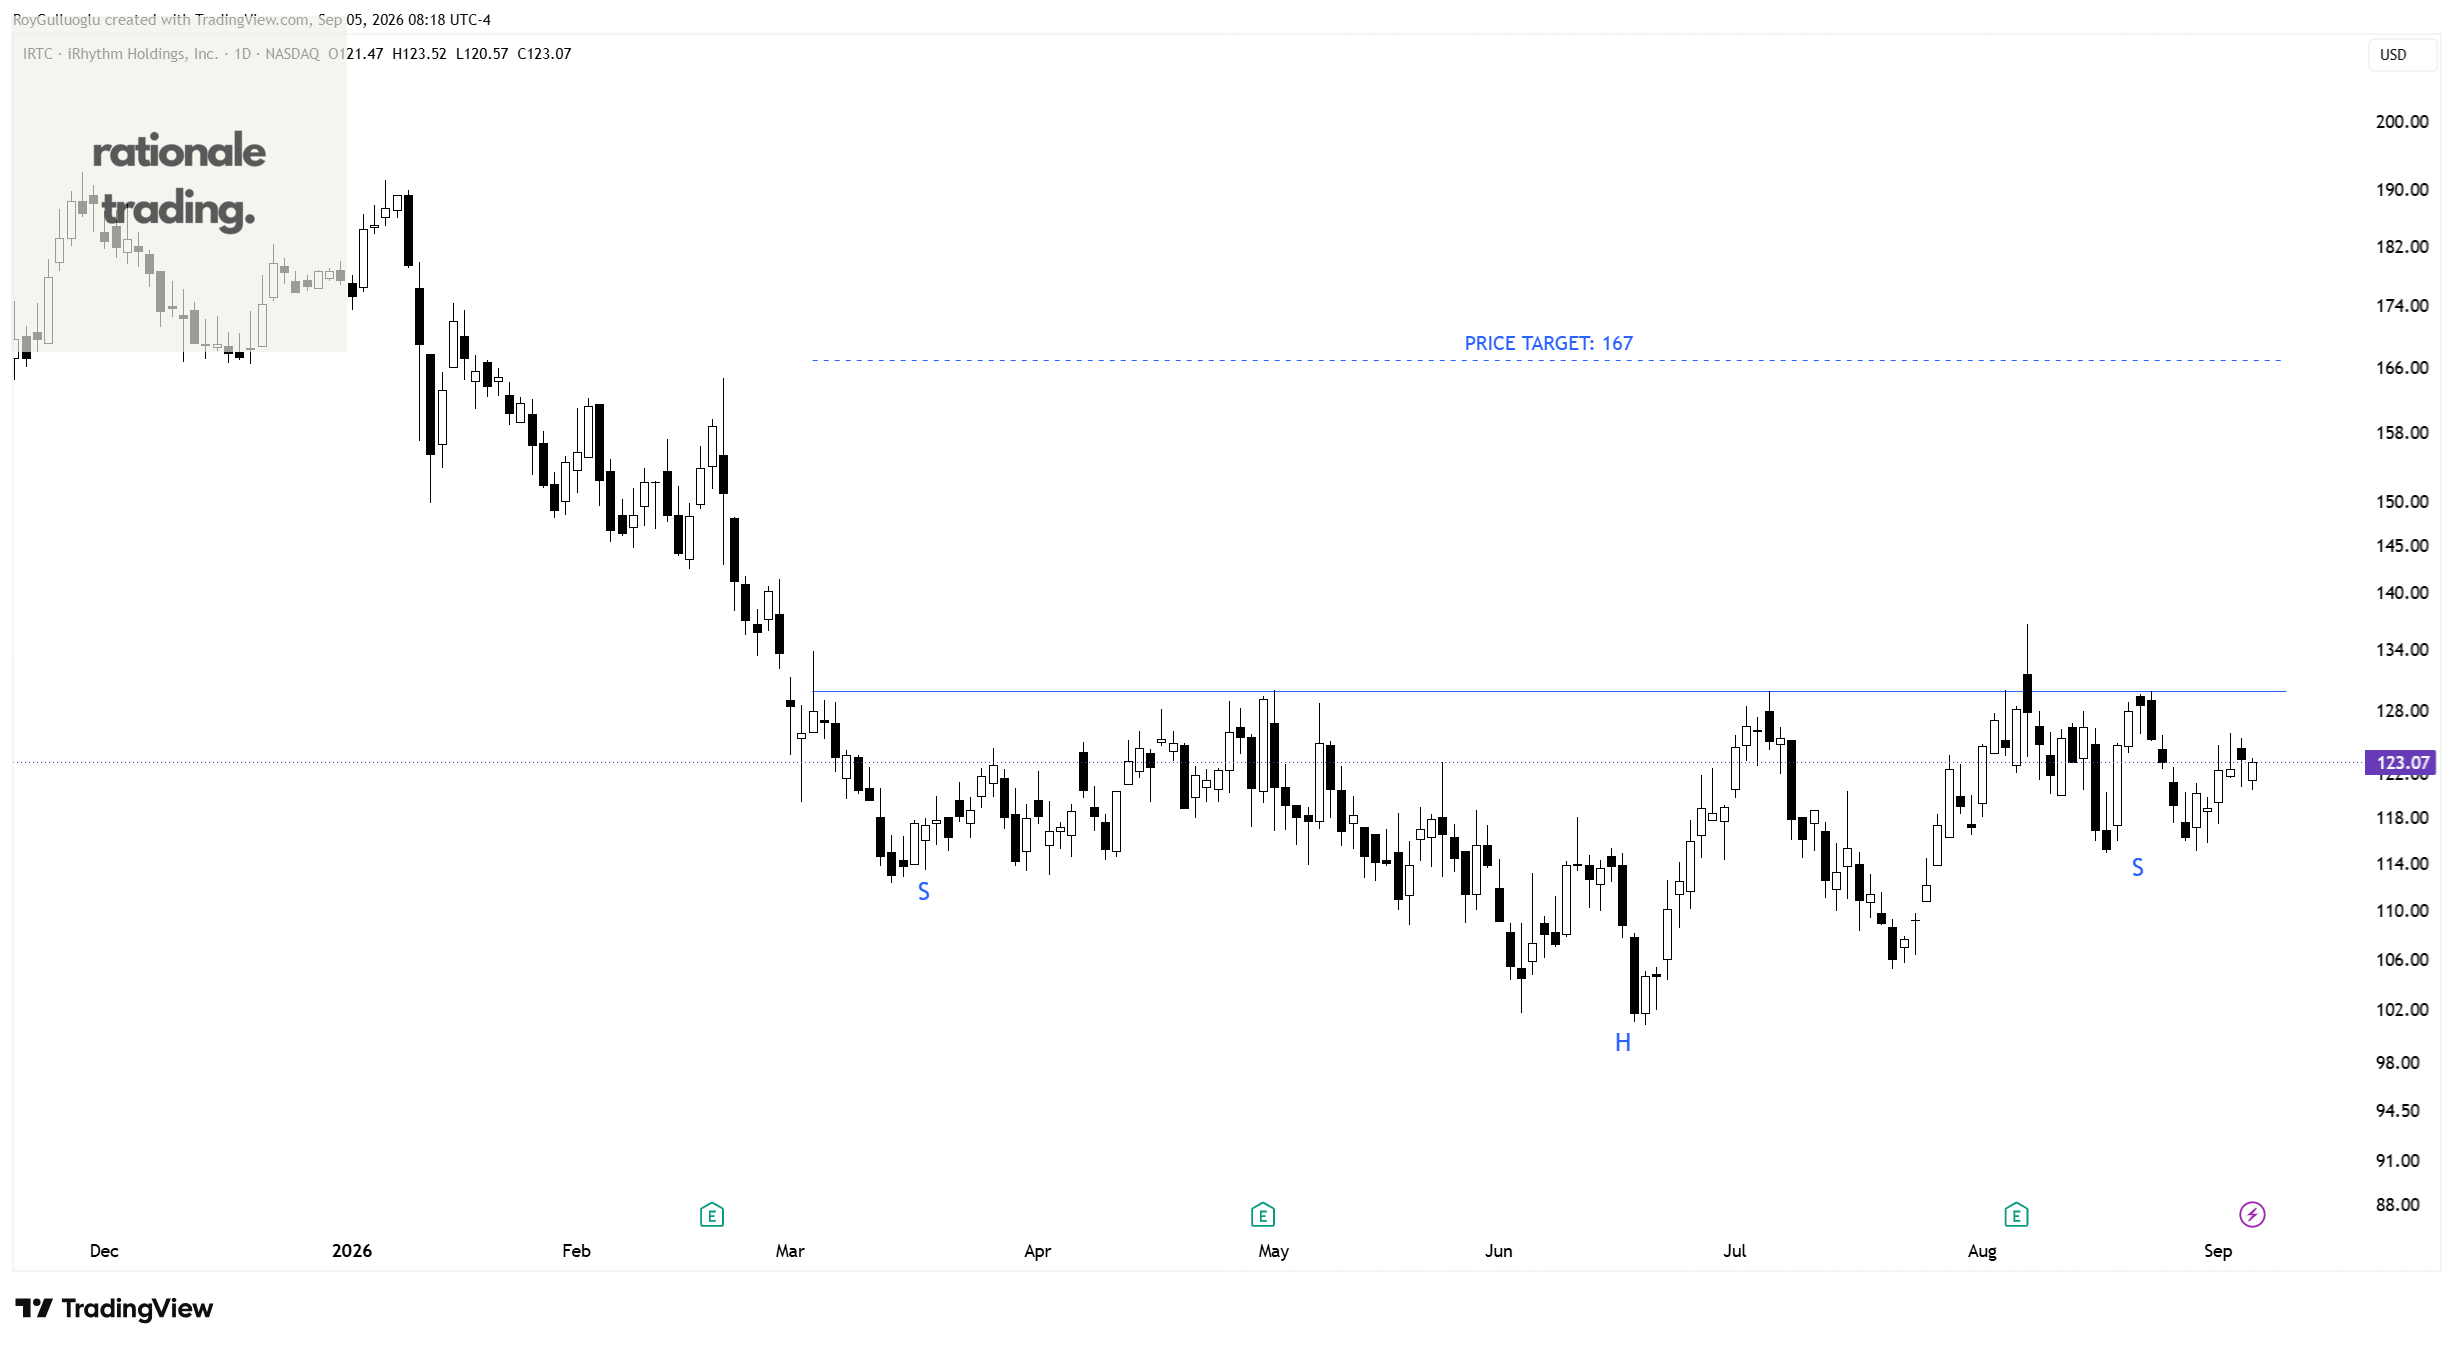
The above daily chart formed an approximately 4-month-long H&S bottom chart pattern as a bullish reversal after a downtrend.
Within this pattern, the horizontal boundary at 129.89 levels acts as a resistance.
A daily close above 133.75 levels would validate the breakout from the 4-month-long H&S bottom chart pattern.
Based on this chart pattern, the potential price target is 167 levels.
ZIM Integrated Shipping Services Ltd.-(ZIM/NYSE)-Long Idea
ZIM Integrated Shipping Services Ltd., together with its subsidiaries, provides container shipping and related services in Israel and internationally.
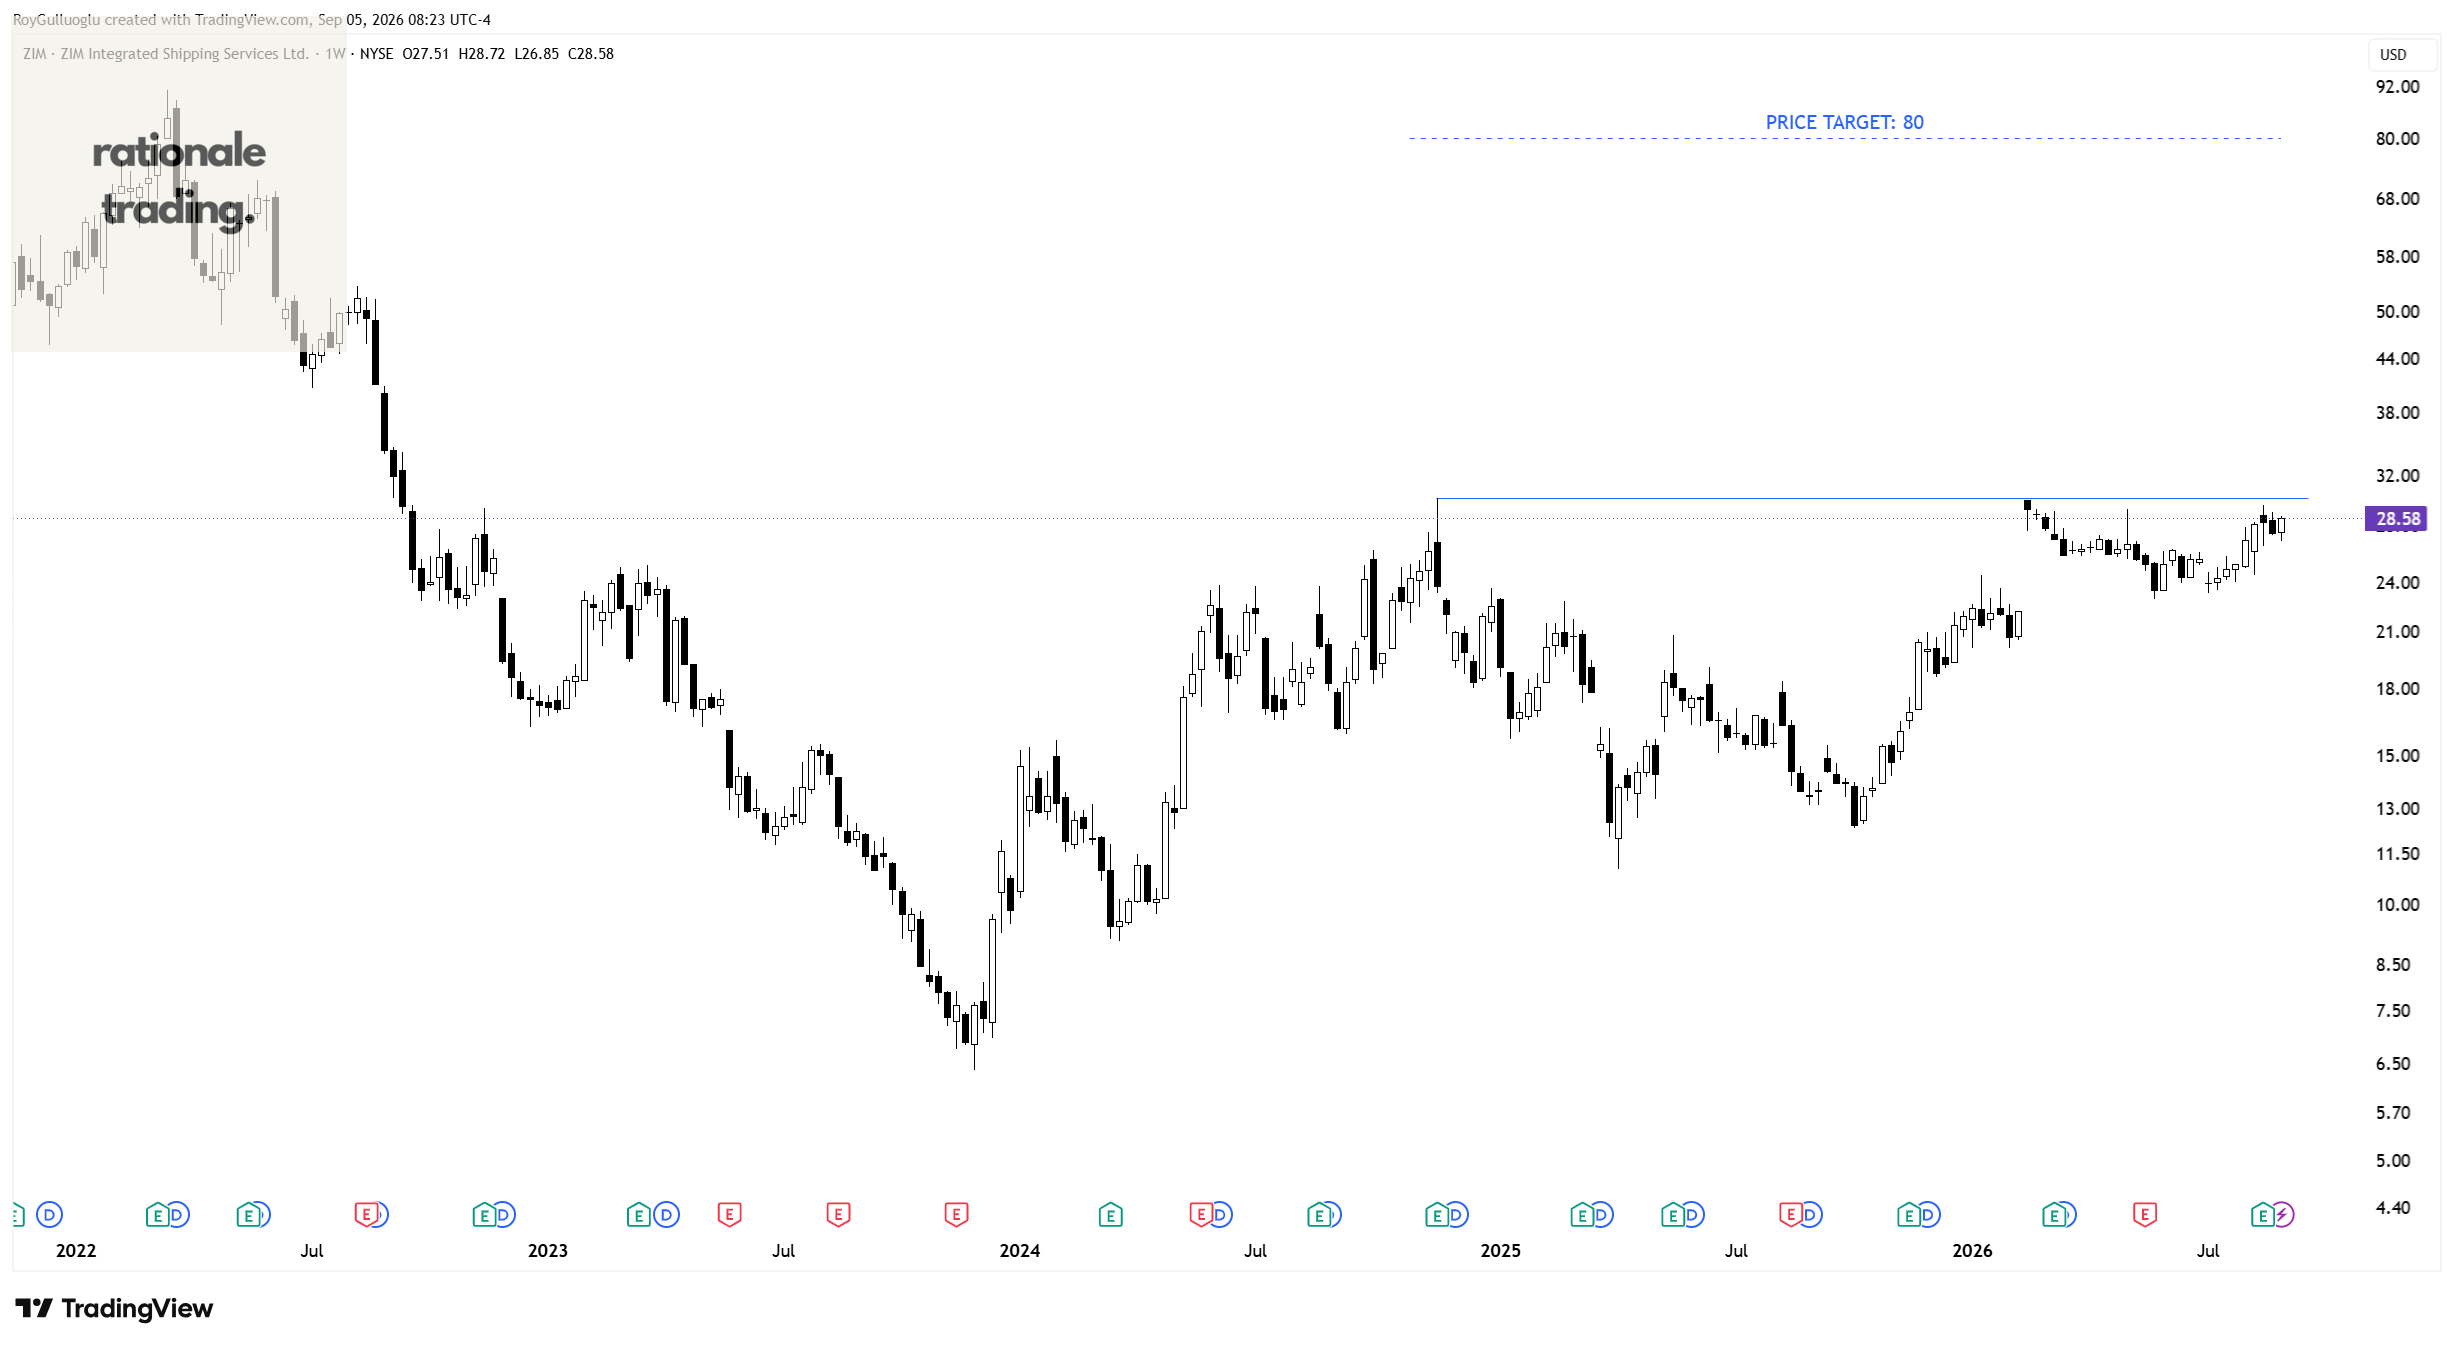
The above weekly chart formed an approximately 23-month-long cup & handle chart pattern as a bullish continuation after an uptrend.
Within this pattern, the horizontal boundary at 30.15 levels acts as a resistance.
A daily close above 31 levels would validate the breakout from the 23-month-long cup & handle chart pattern.
Based on this chart pattern, the potential price target is 80 levels.
Kohl’s Corporation-(KSS/NYSE)-Long Idea
Kohl’s Corporation operates as an omnichannel retailer in the United States. It offers apparel, footwear, accessories, beauty products, and home products through its stores and website.
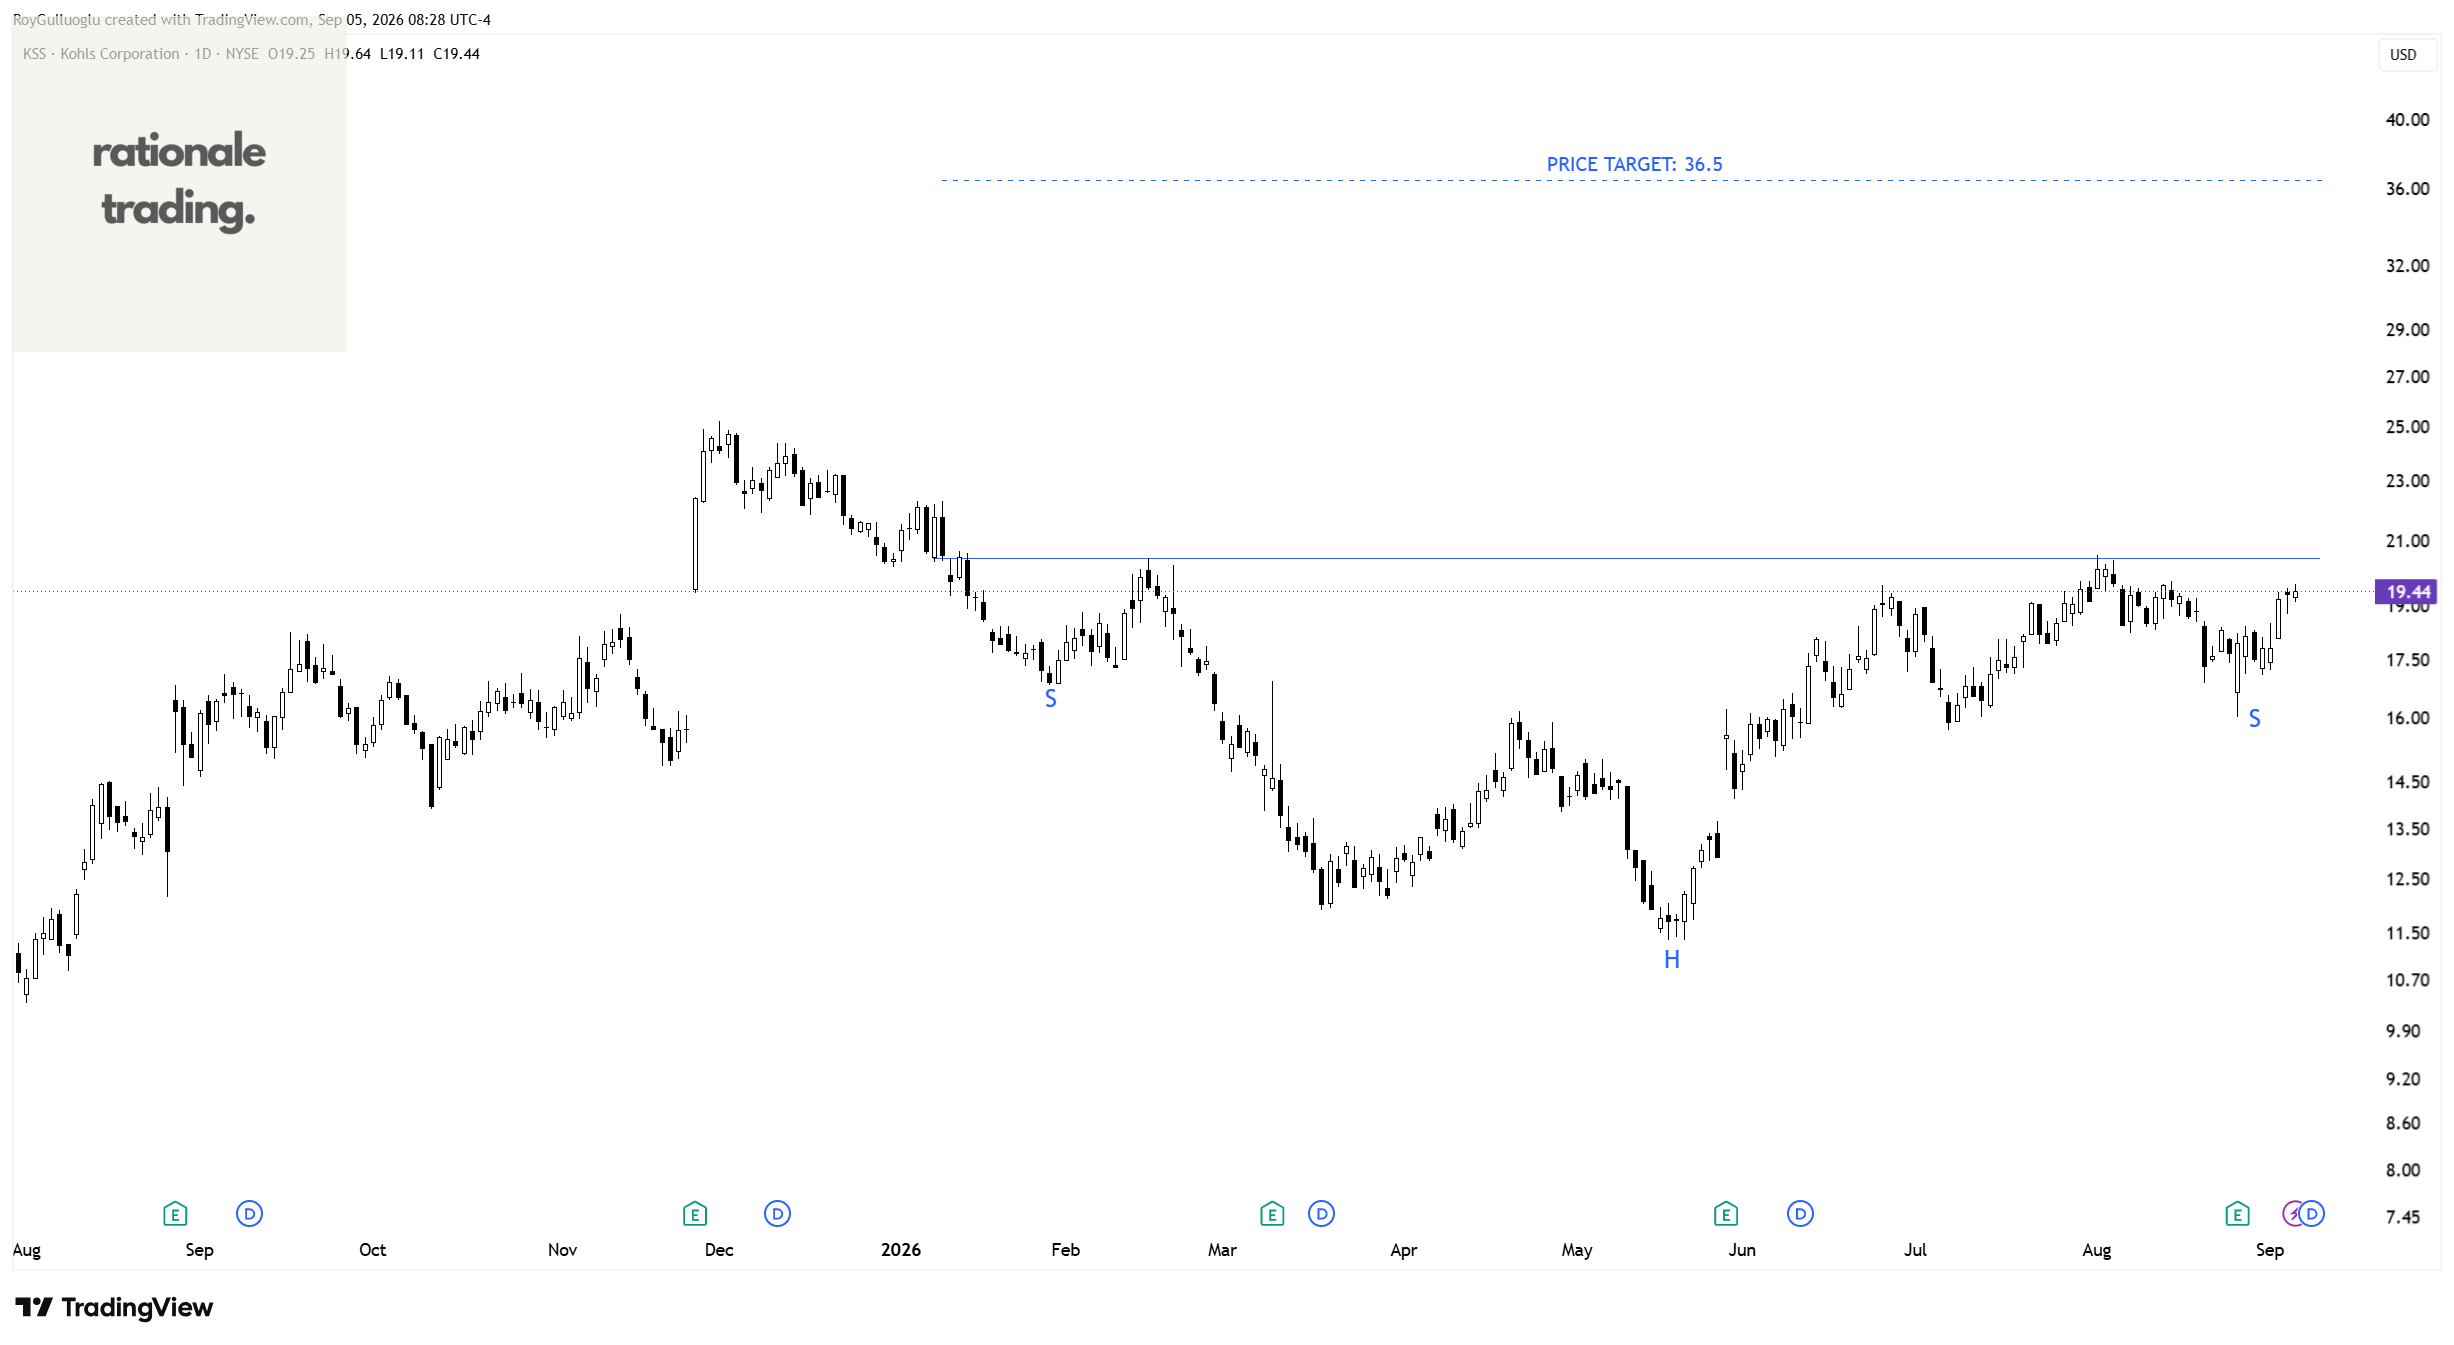
The above daily chart formed an approximately 5-month-long H&S bottom chart pattern as a bullish reversal after a downtrend.
Within this pattern, the horizontal boundary at 20.43 levels acts as a resistance.
A daily close above 21 levels would validate the breakout from the 5-month-long H&S bottom chart pattern.
Based on this chart pattern, the potential price target is 36.5 levels.
Restaurant Brands International Inc.-(QSR/NYSE)-Long Idea
Restaurant Brands International Inc. operates as a quick service restaurant company in Canada, the United States, and internationally.
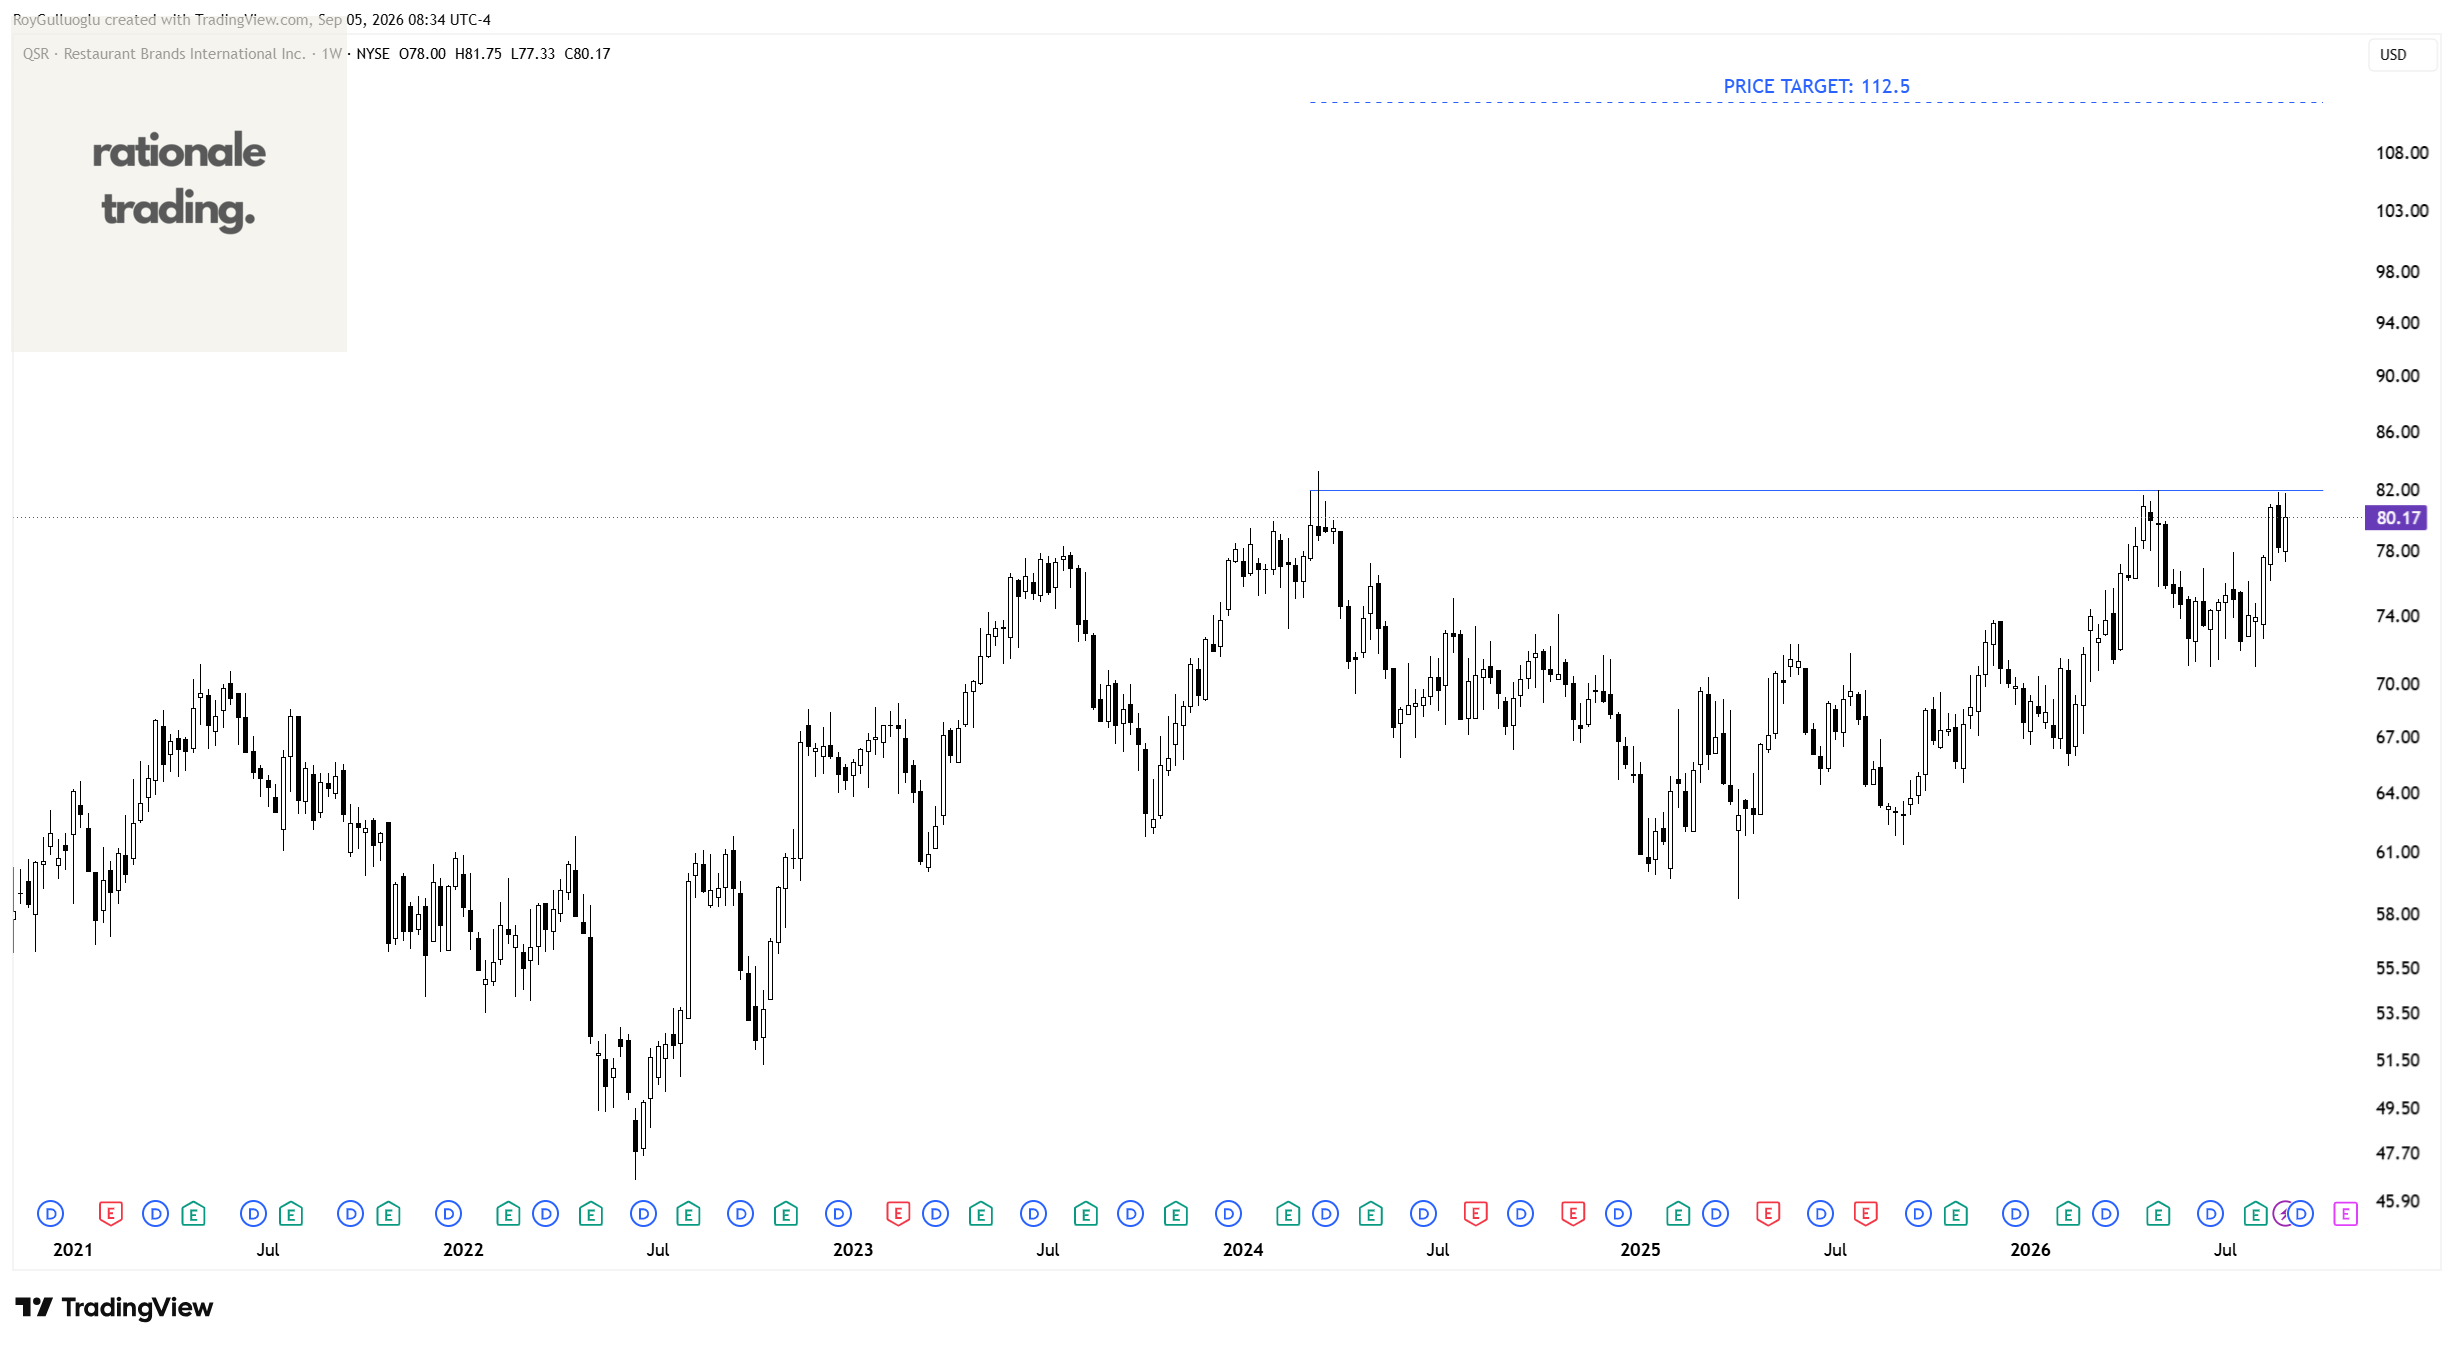
The above weekly chart formed an approximately 32-month-long cup & handle chart pattern as a bullish continuation after an uptrend.
Within this pattern, the horizontal boundary at 81.96 levels acts as a resistance.
A daily close above 84.4 levels would validate the breakout from the 32-month-long cup & handle chart pattern.
Based on this chart pattern, the potential price target is 112.5 levels.
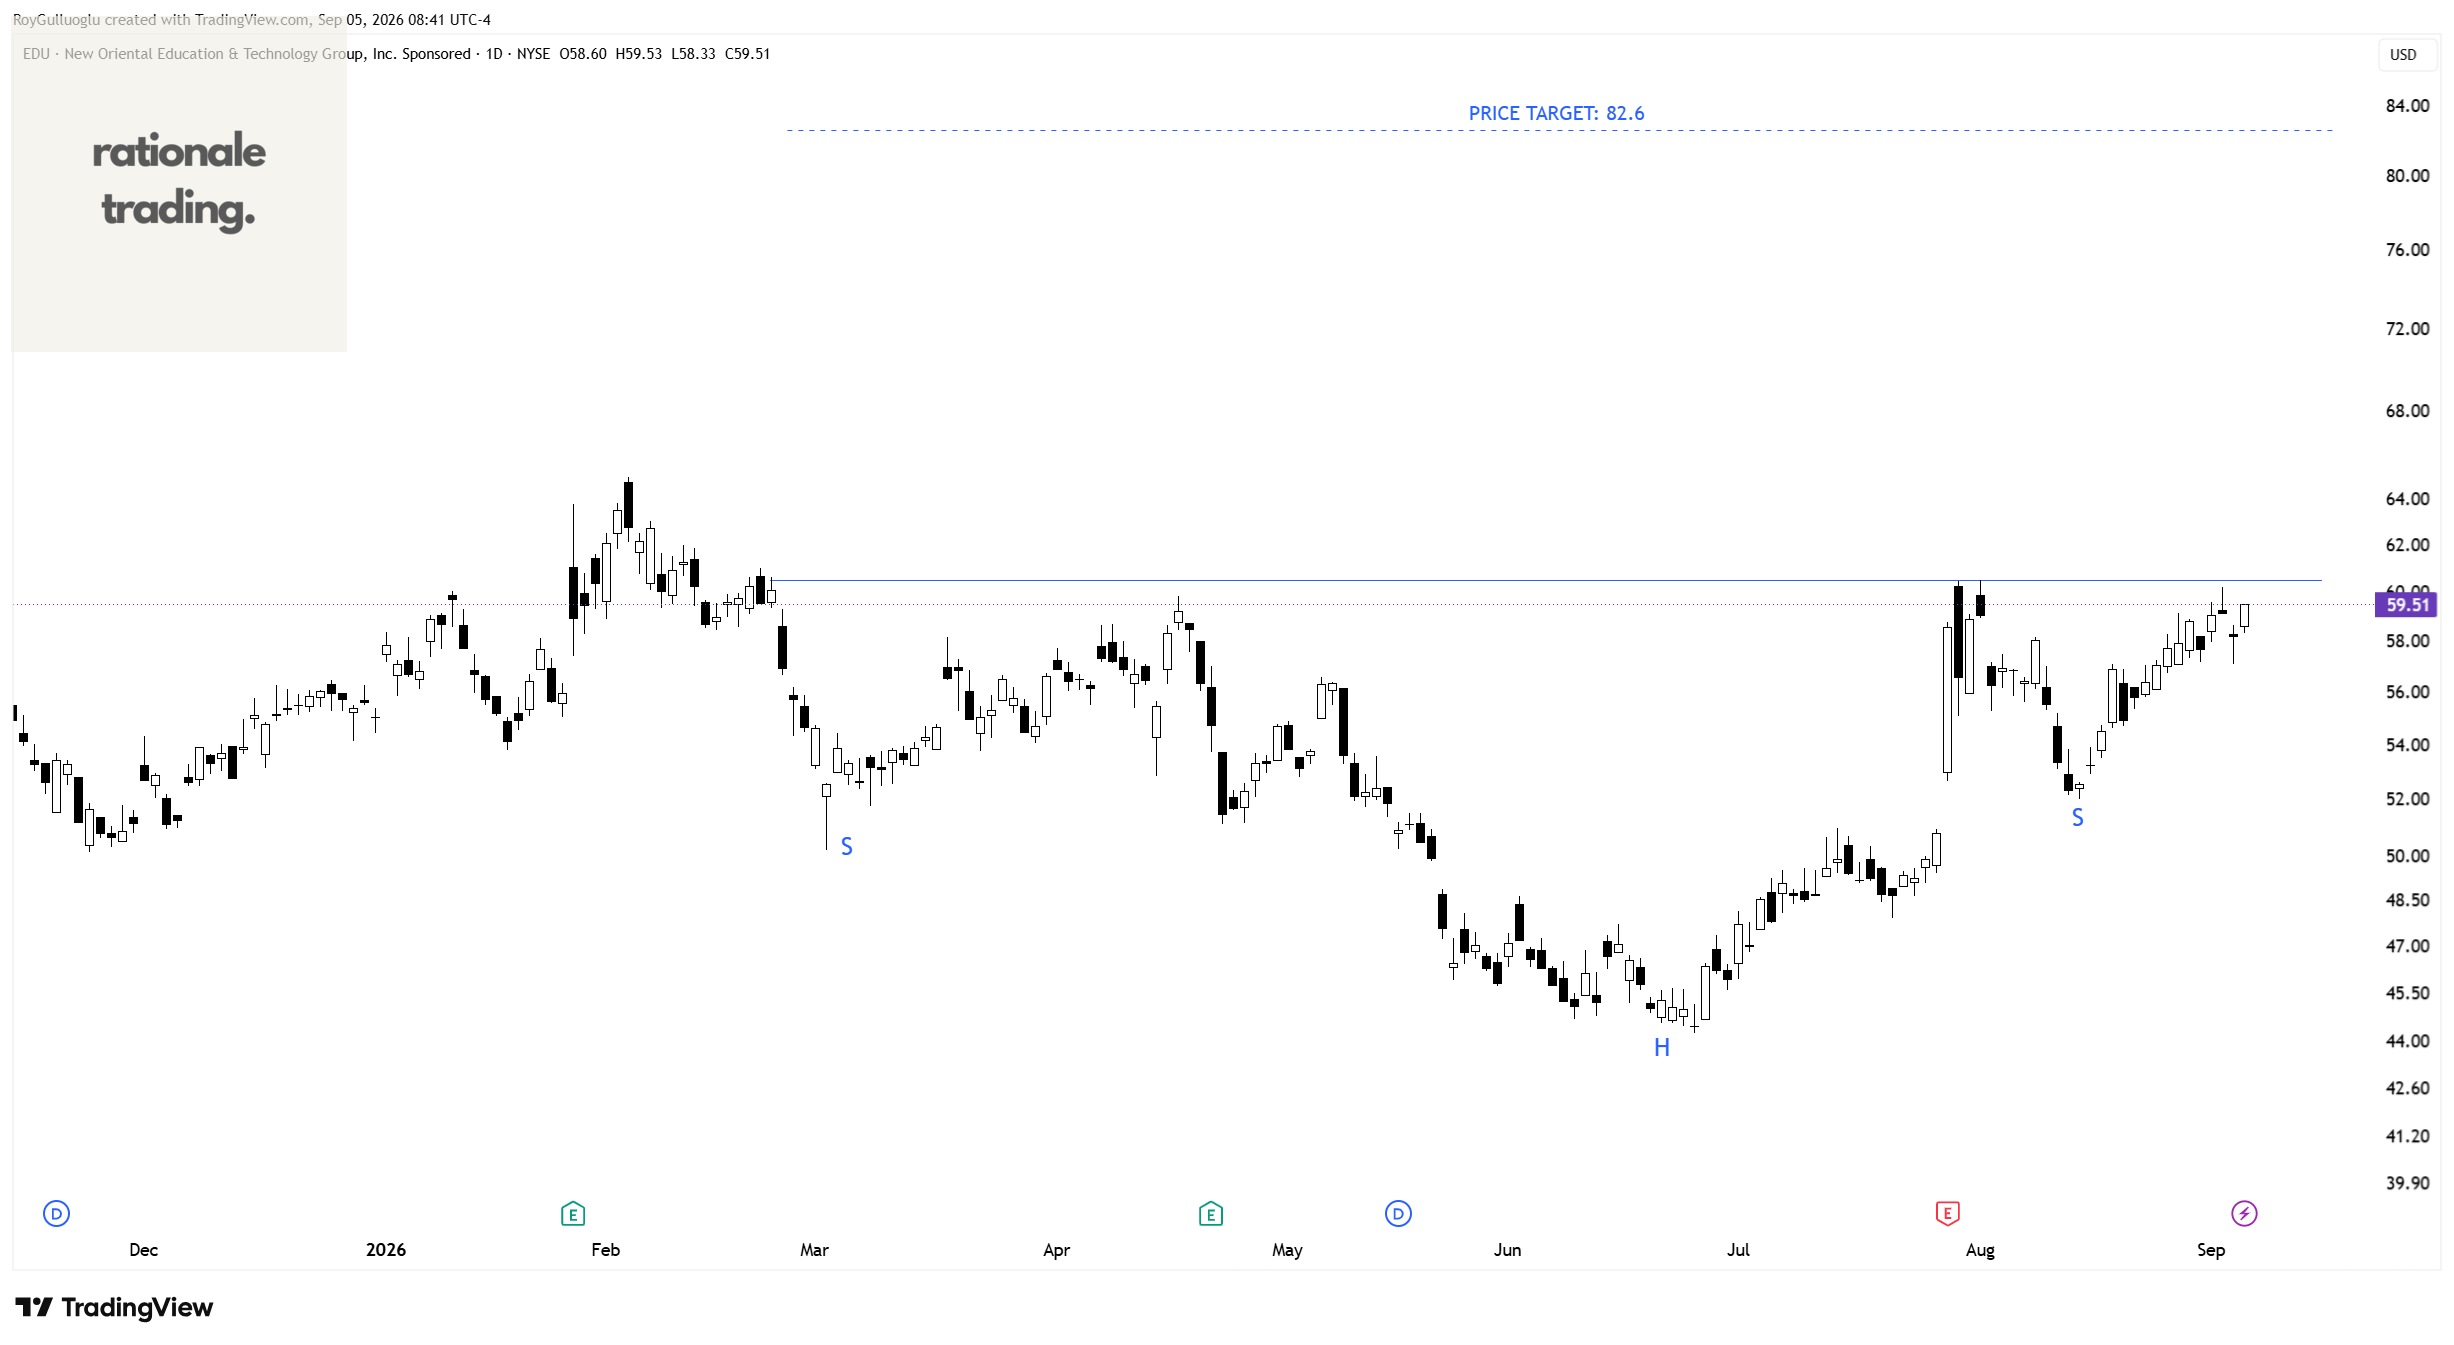
New Oriental Education & Technology Group Inc.-(EDU/NYSE)-Long Idea
New Oriental Education & Technology Group Inc. engages in the provision of private educational services under the New Oriental brand in the People’s Republic of China.
The above daily chart formed an approximately 4-month-long H&S bottom chart pattern as a bullish reversal after a downtrend.
Within this pattern, the horizontal boundary at 60.49 levels acts as a resistance.
A daily close above 62.3 levels would validate the breakout from the 4-month-long H&S bottom chart pattern.
Based on this chart pattern, the potential price target is 82.6 levels.
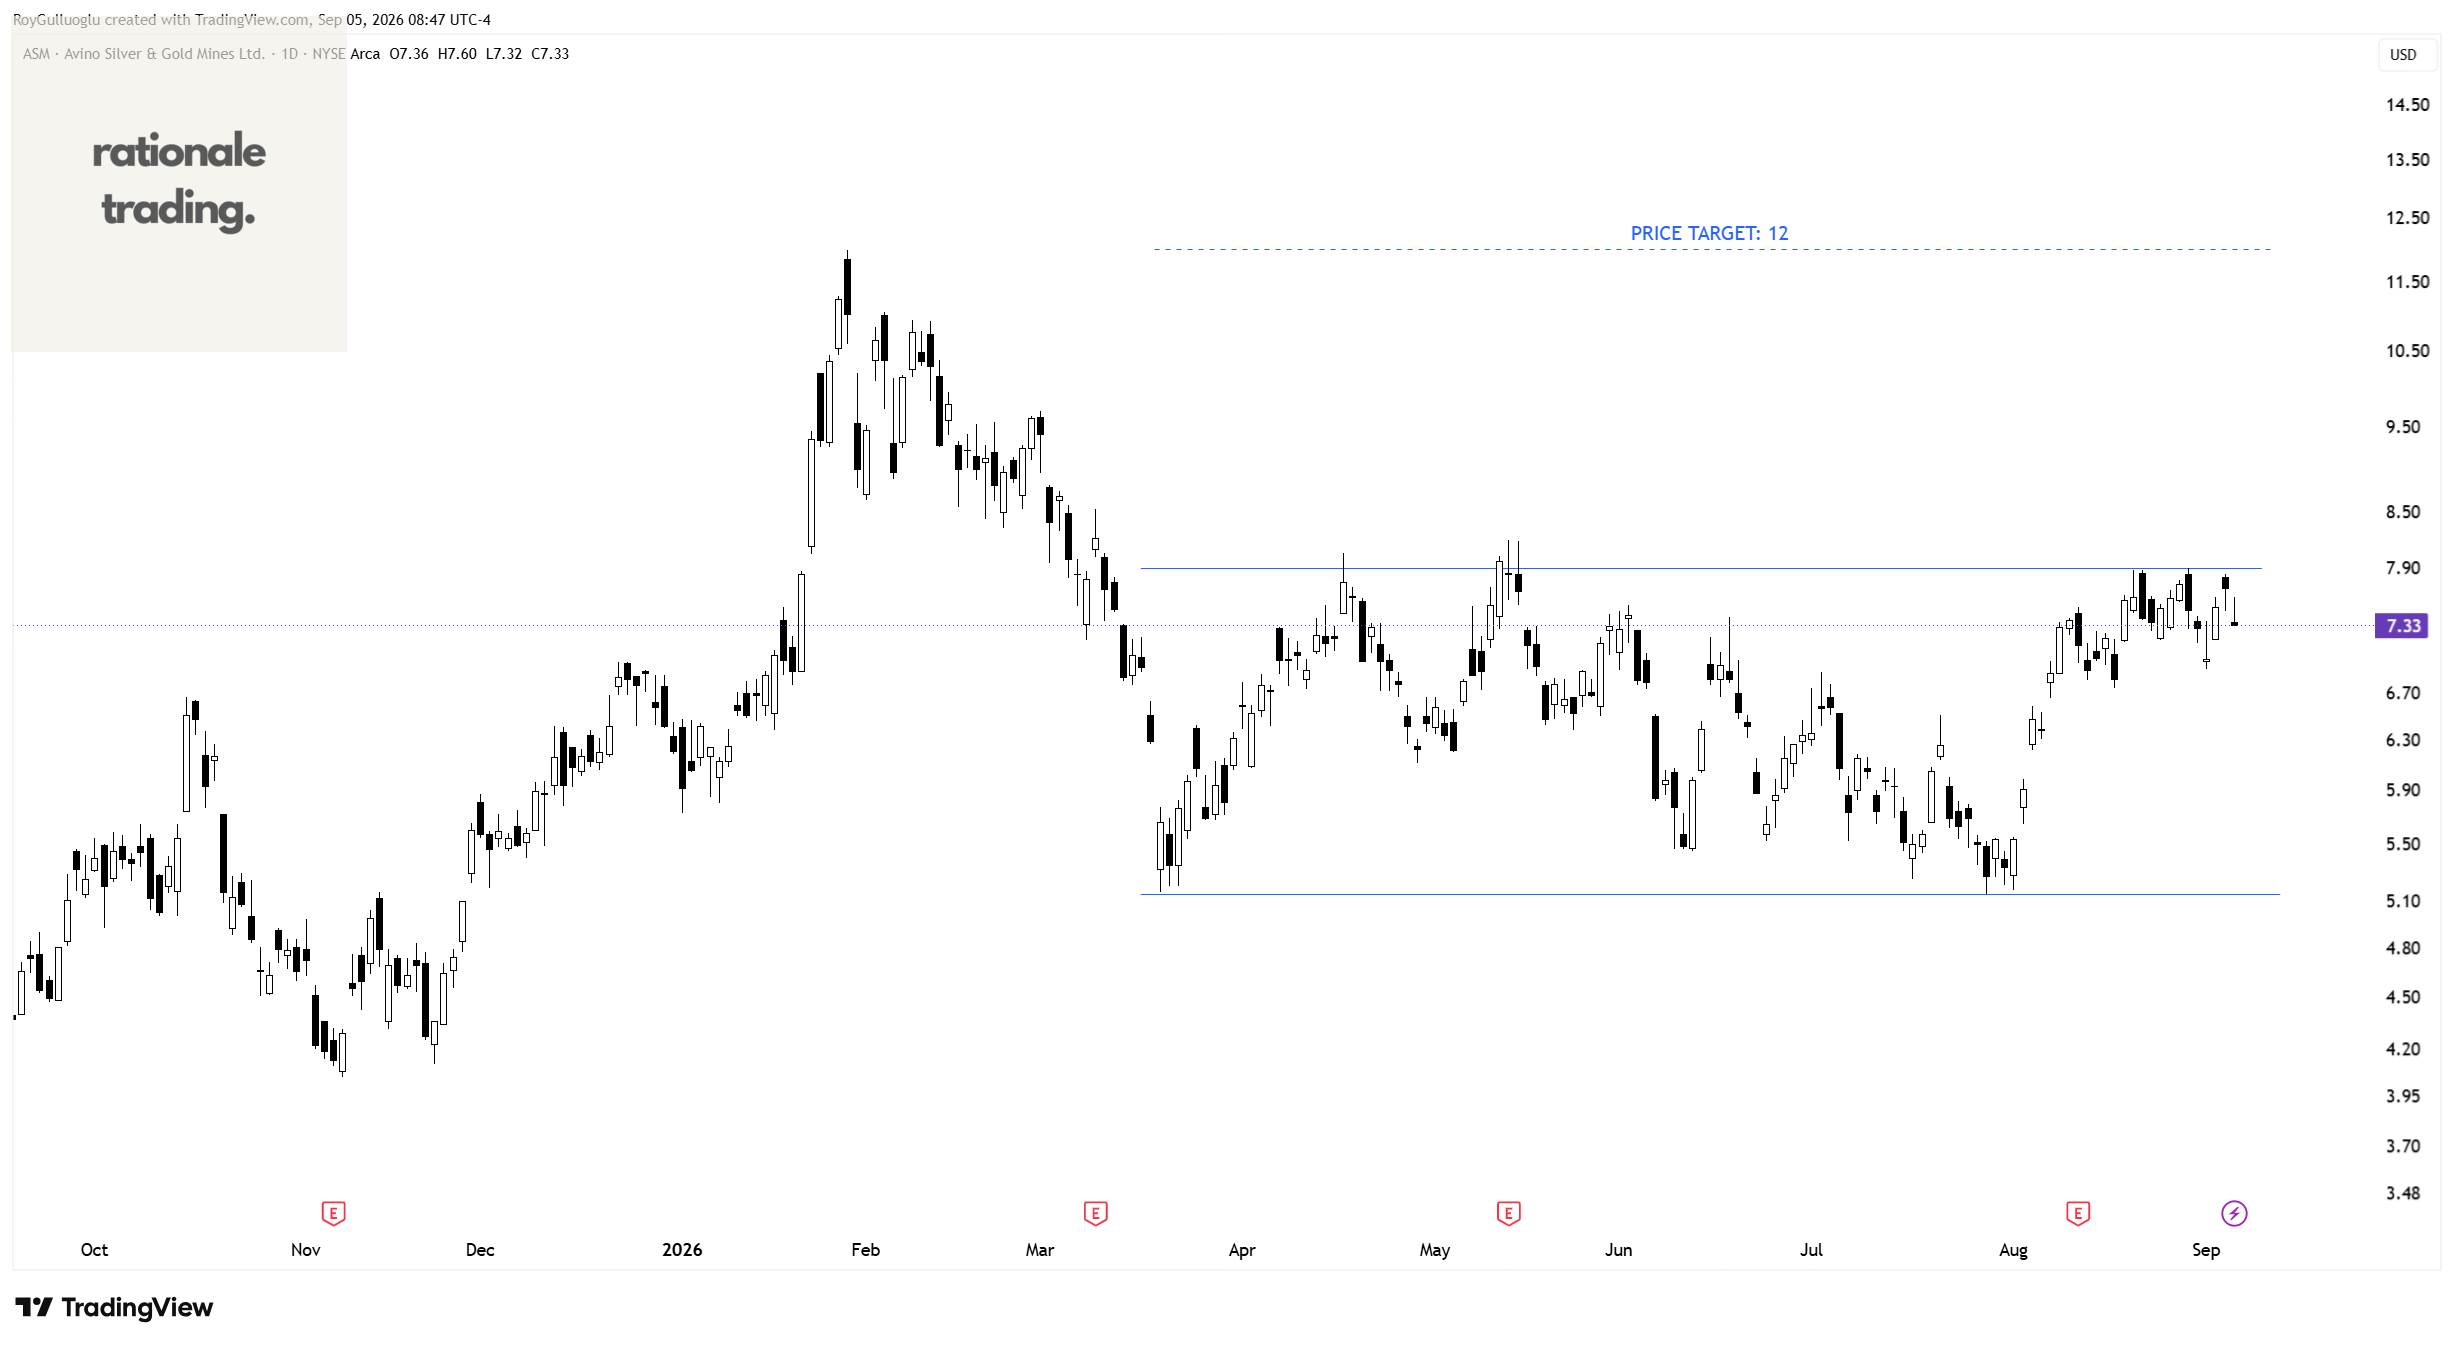
Avino Silver & Gold Mines Ltd.-(ASM/NYSE)-Long Idea
Avino Silver & Gold Mines Ltd., together with its subsidiaries, engages in the acquisition, exploration, and advancement of mineral properties in Mexico.
The above daily chart formed an approximately 4-month-long rectangle chart pattern as a bullish reversal after a downtrend.
Within this pattern, the horizontal boundary at 7.9 levels acts as a resistance.
A daily close above 8.1 levels would validate the breakout from the 4-month-long rectangle chart pattern.
Based on this chart pattern, the potential price target is 12 levels.
H&S Cont on $CF from previous Rationale report retesting boundary post-breakout. Looking like she may be ready to go, Roy
Much appreciated !
Are you and Aksel team members?