


CAVA Group, Inc-(CAVA/NYSE)-Long Idea
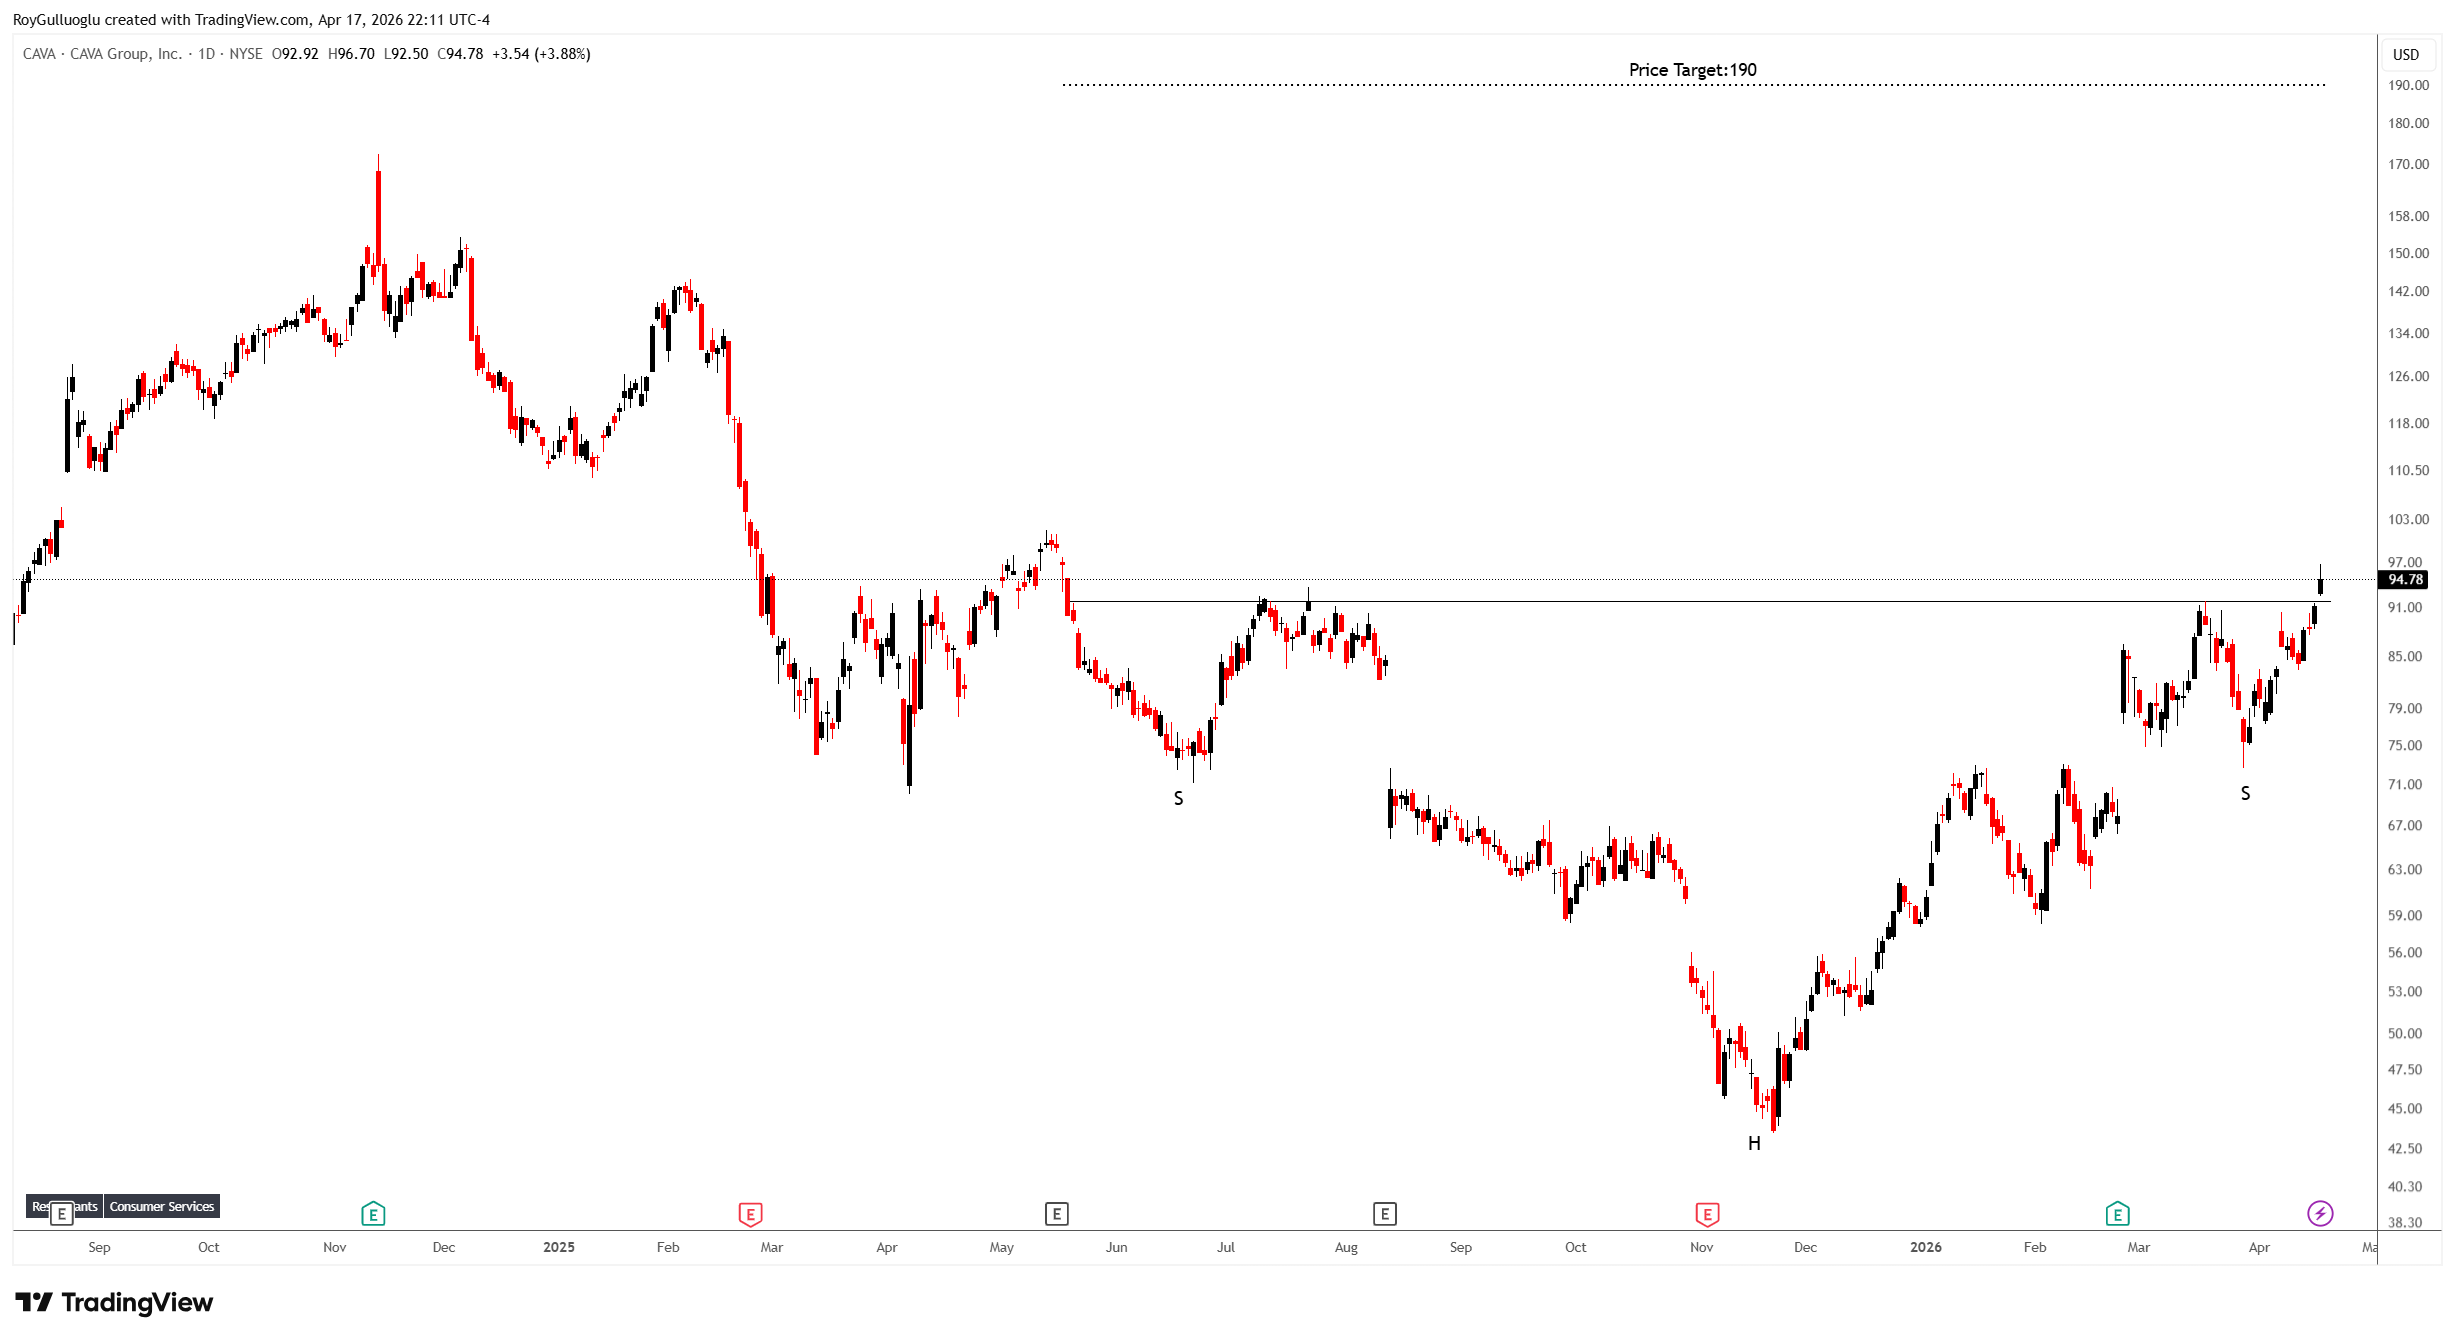
CAVA Group, Inc. owns and operates a chain of restaurants under the CAVA brand in the United States.
The above daily chart formed an approximately 8-month-long H&S bottom chart pattern as a bullish reversal after a downtrend.
The horizontal boundary at 91.83 levels acted as a resistance within this pattern.
A daily close above 94.6 levels validated the breakout from the 8-month-long H&S bottom chart pattern.
Based on this chart pattern, the potential price target is 190 levels.
Hewlett Packard Enterprise Company-(HPE/NYSE)-Long Idea
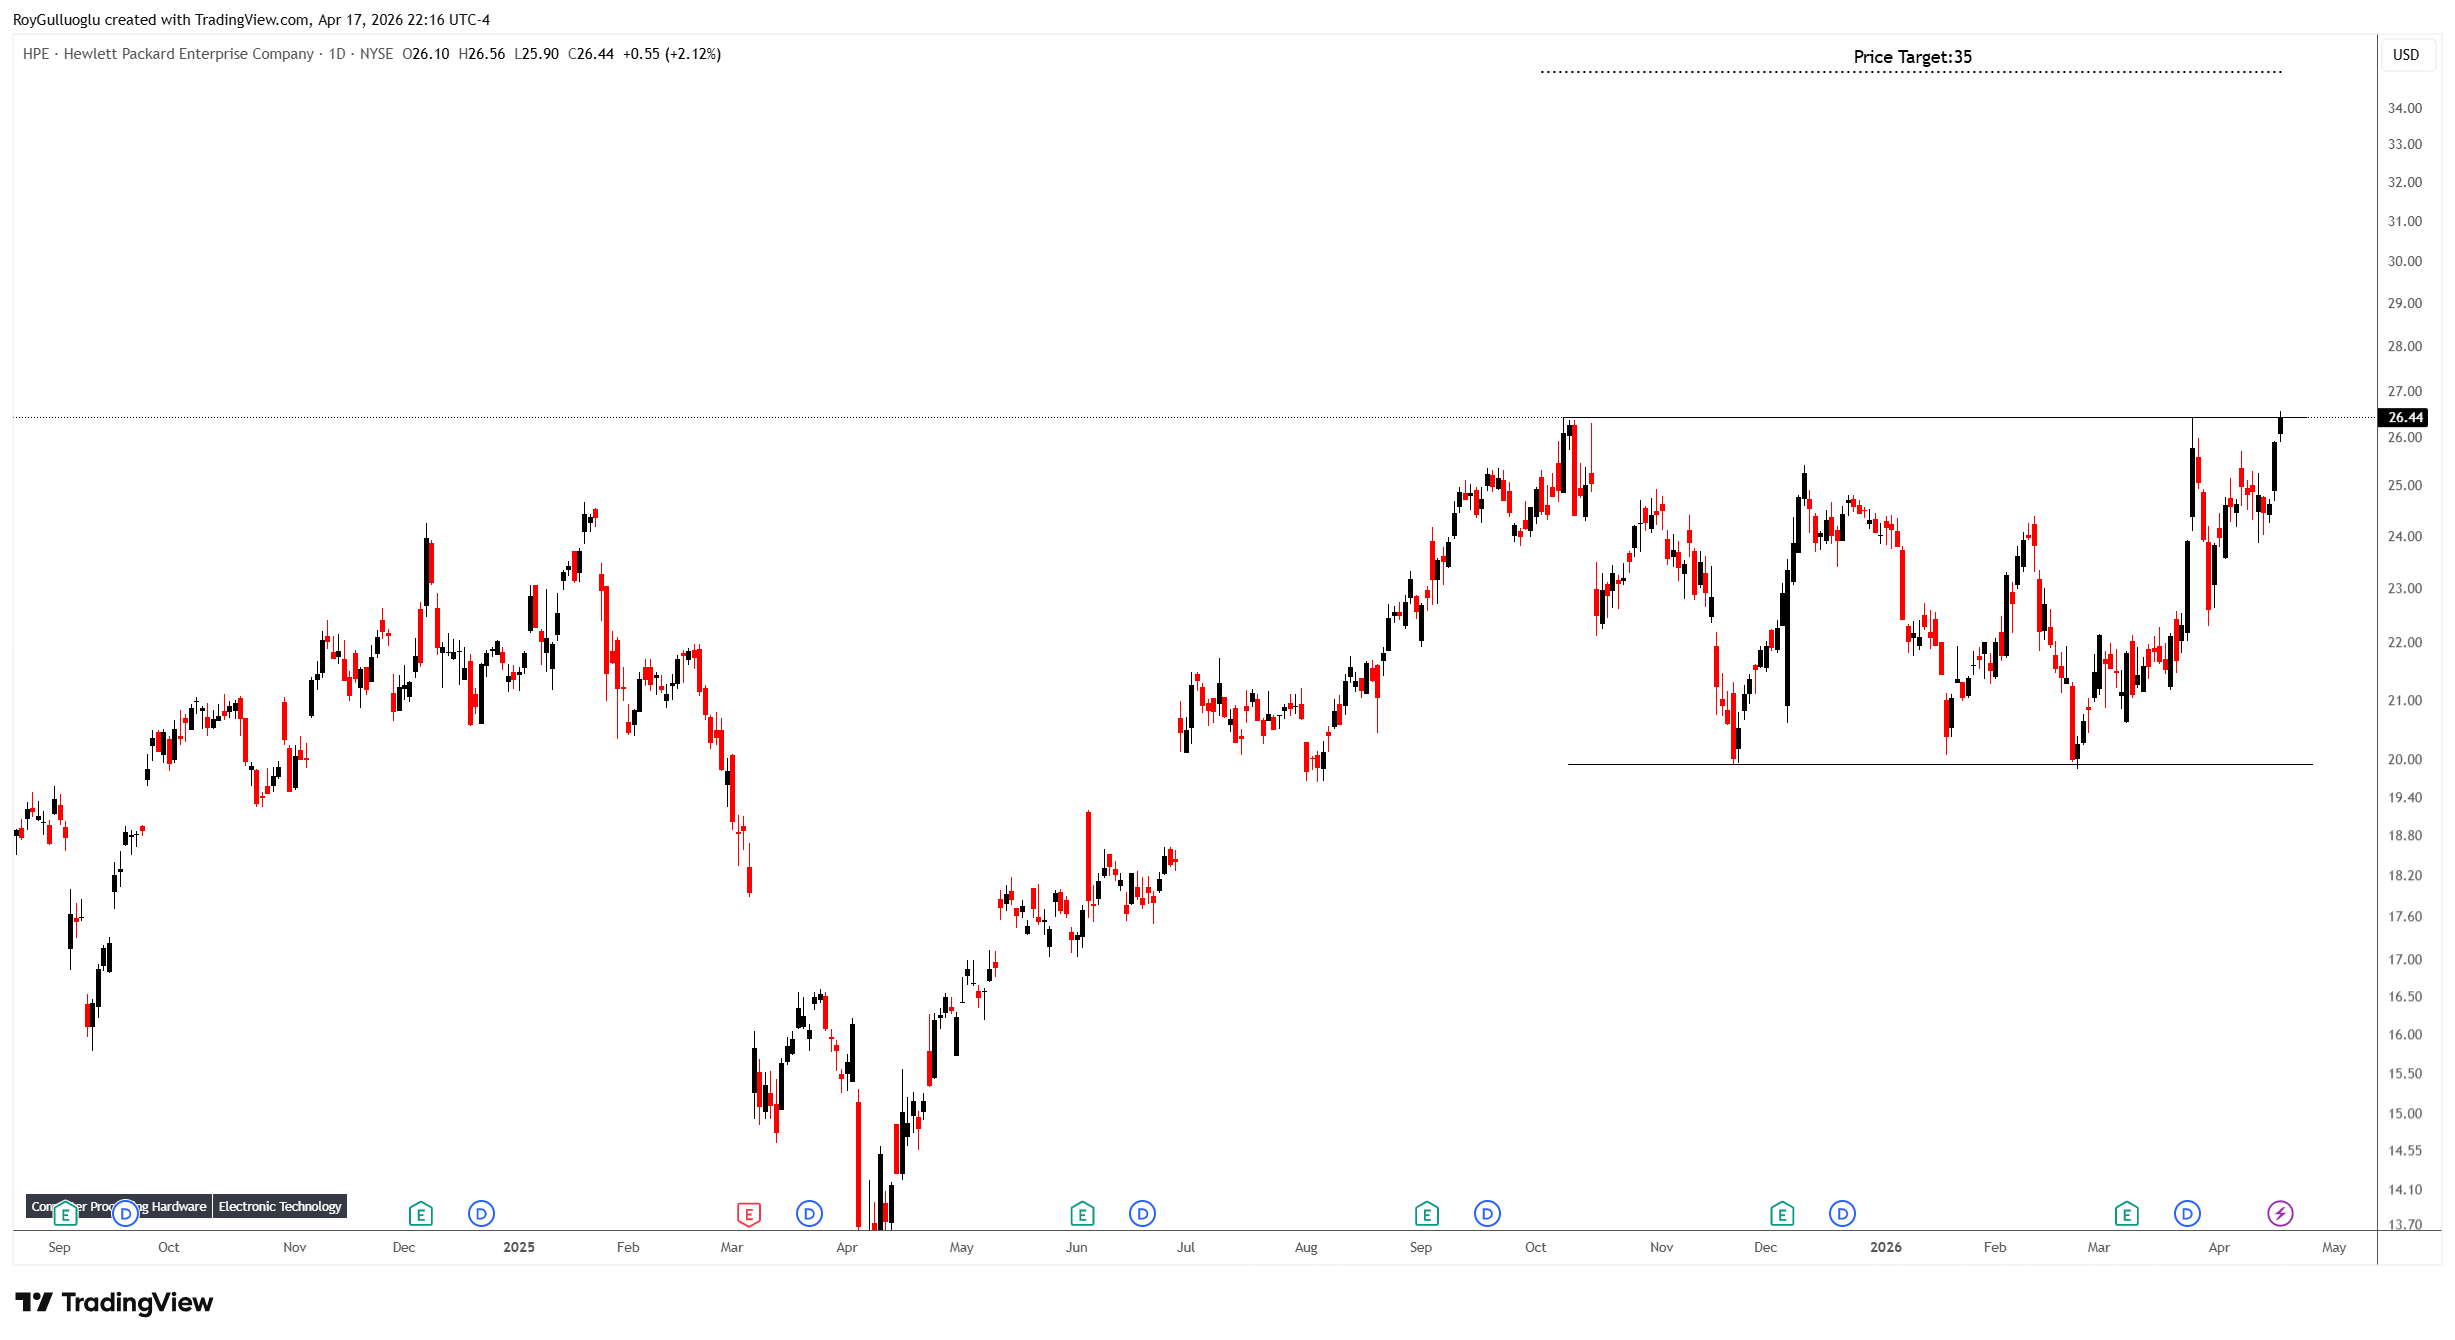
Hewlett Packard Enterprise Company, together with its subsidiaries, develops intelligent solutions in the United States, the Americas, Europe, the Middle East, Africa, the Asia Pacific, Japan, and internationally.
The above daily chart formed an approximately 4-month-long rectangle chart pattern as a bullish continuation after an uptrend.
The horizontal boundary at 26.44 levels acts as a resistance within this pattern.
A daily close above 27.23 levels would validate the breakout from the 4-month-long rectangle chart pattern.
Based on this chart pattern, the potential price target is 35 levels.
MGIC Investment Corporation-(MTG/NYSE)-Long Idea
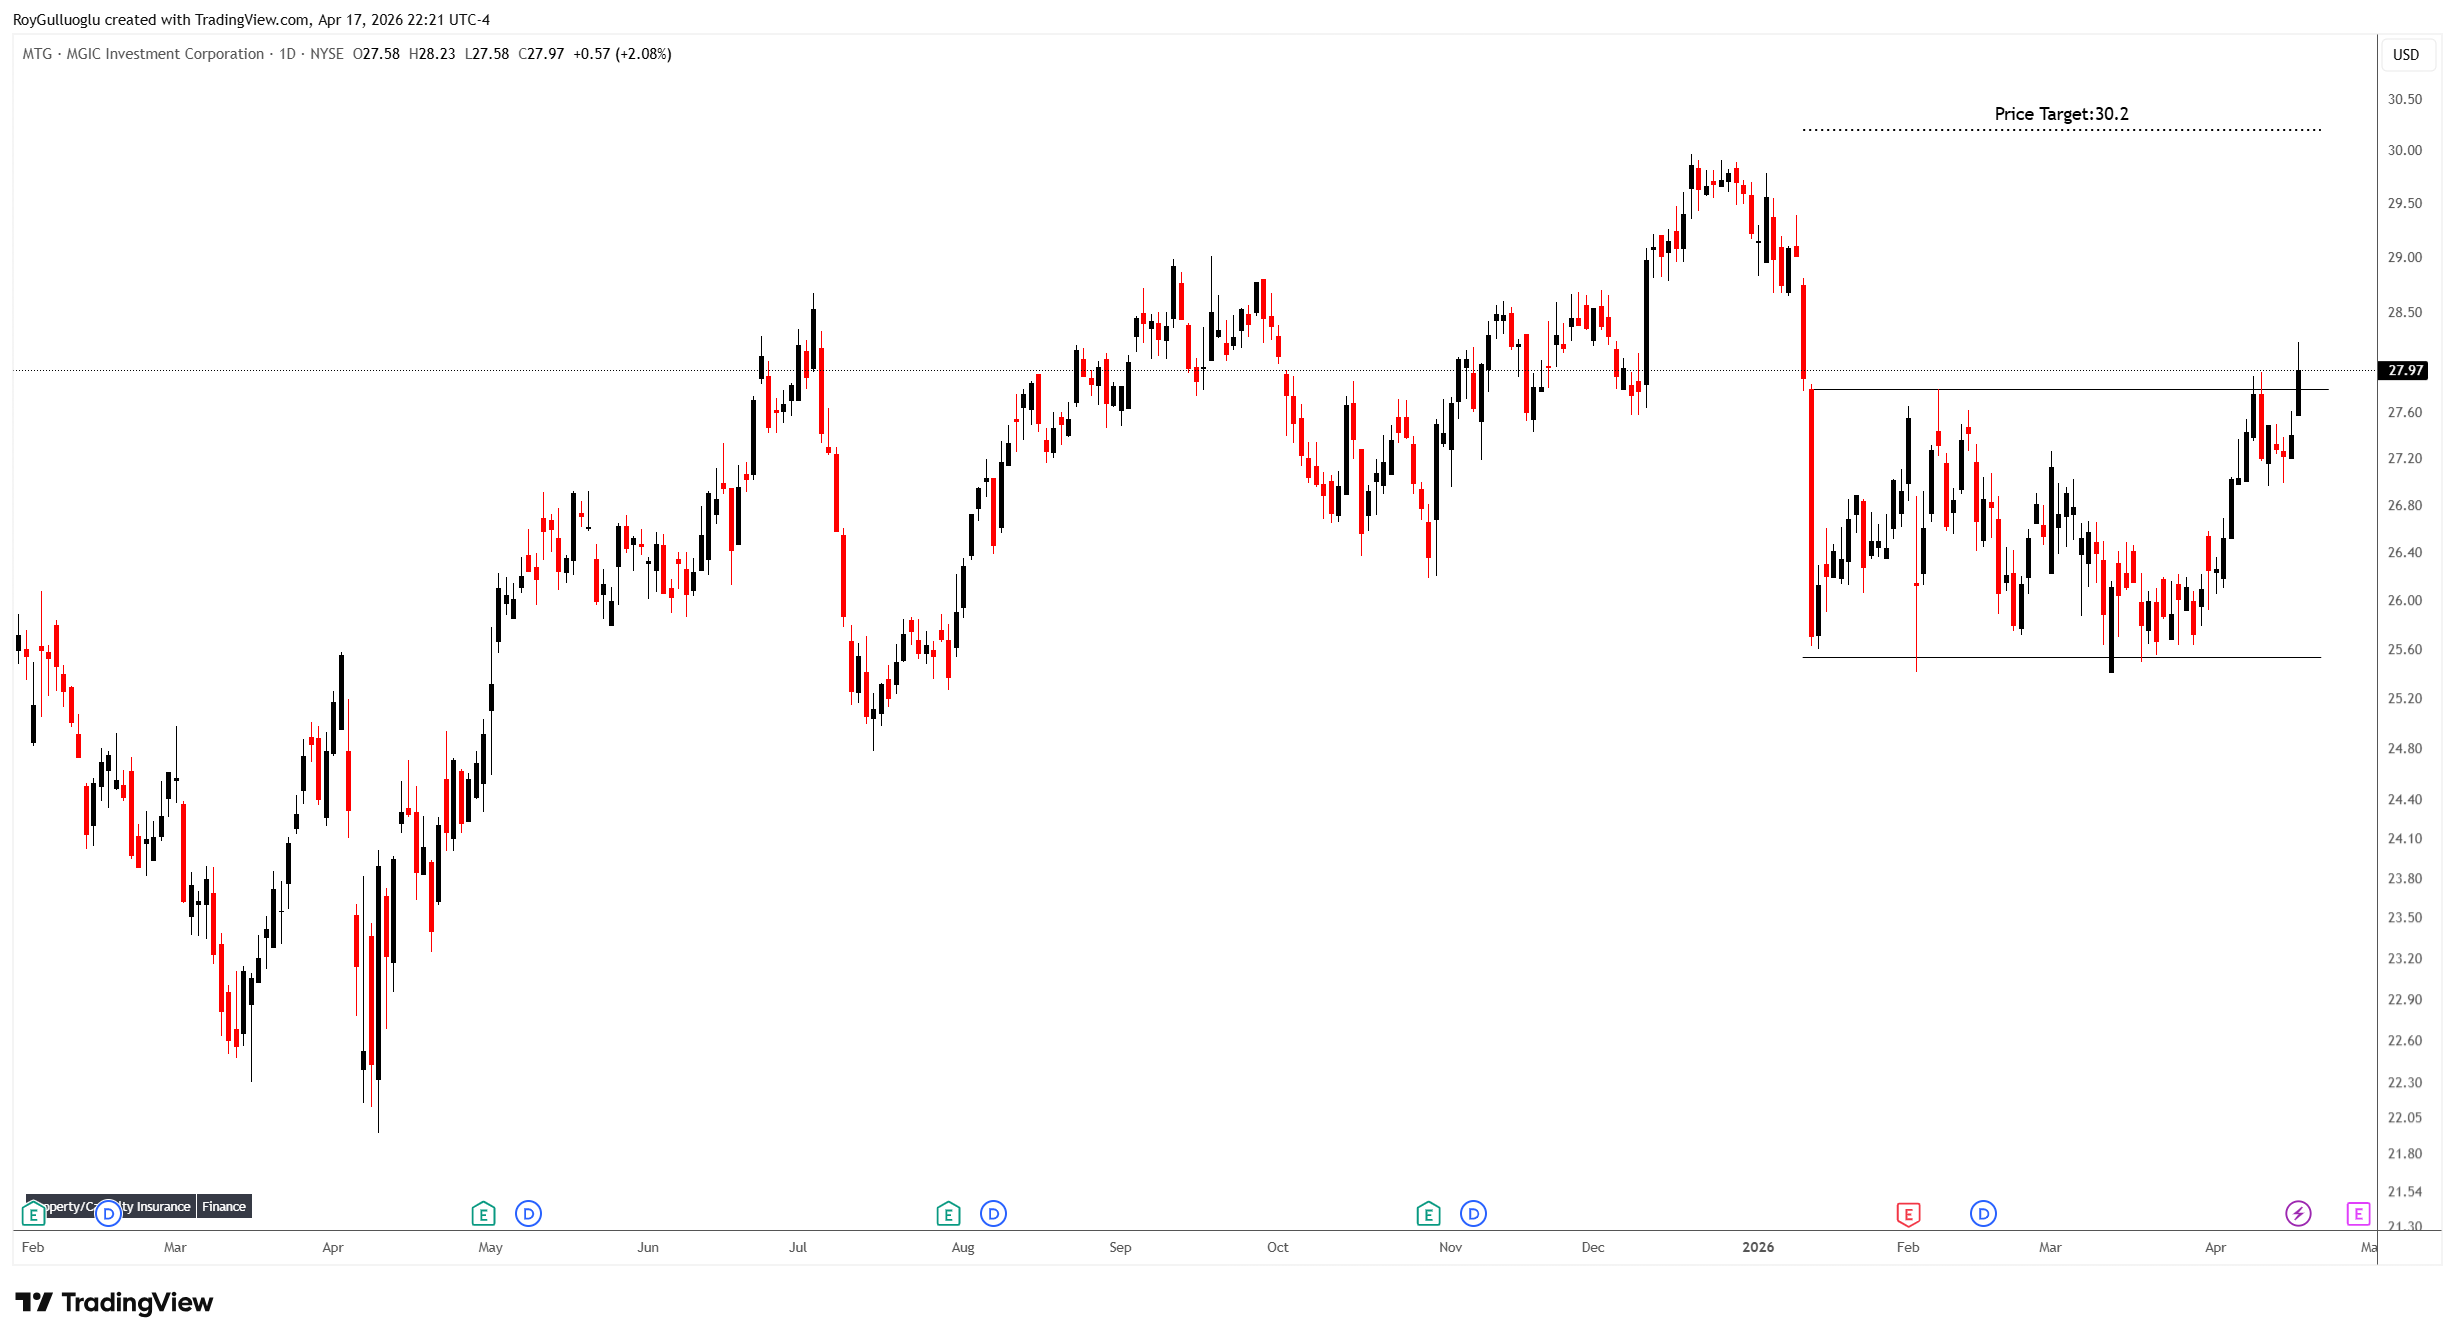
MGIC Investment Corporation, through its subsidiaries, provides private mortgage insurance, other mortgage credit risk management solutions, and ancillary services in the United States, the District of Columbia, Puerto Rico, and Guam.
The above daily chart formed an approximately 2-month-long rectangle chart pattern as a bullish reversal after a downtrend.
The horizontal boundary at 27.8 levels acts as a resistance within this pattern.
A daily close above 28.6 levels would validate the breakout from the 2-month-long rectangle chart pattern.
Based on this chart pattern, the potential price target is 30.2 levels.
eBay Inc. -(EBAY/NASDAQ)-Long Idea
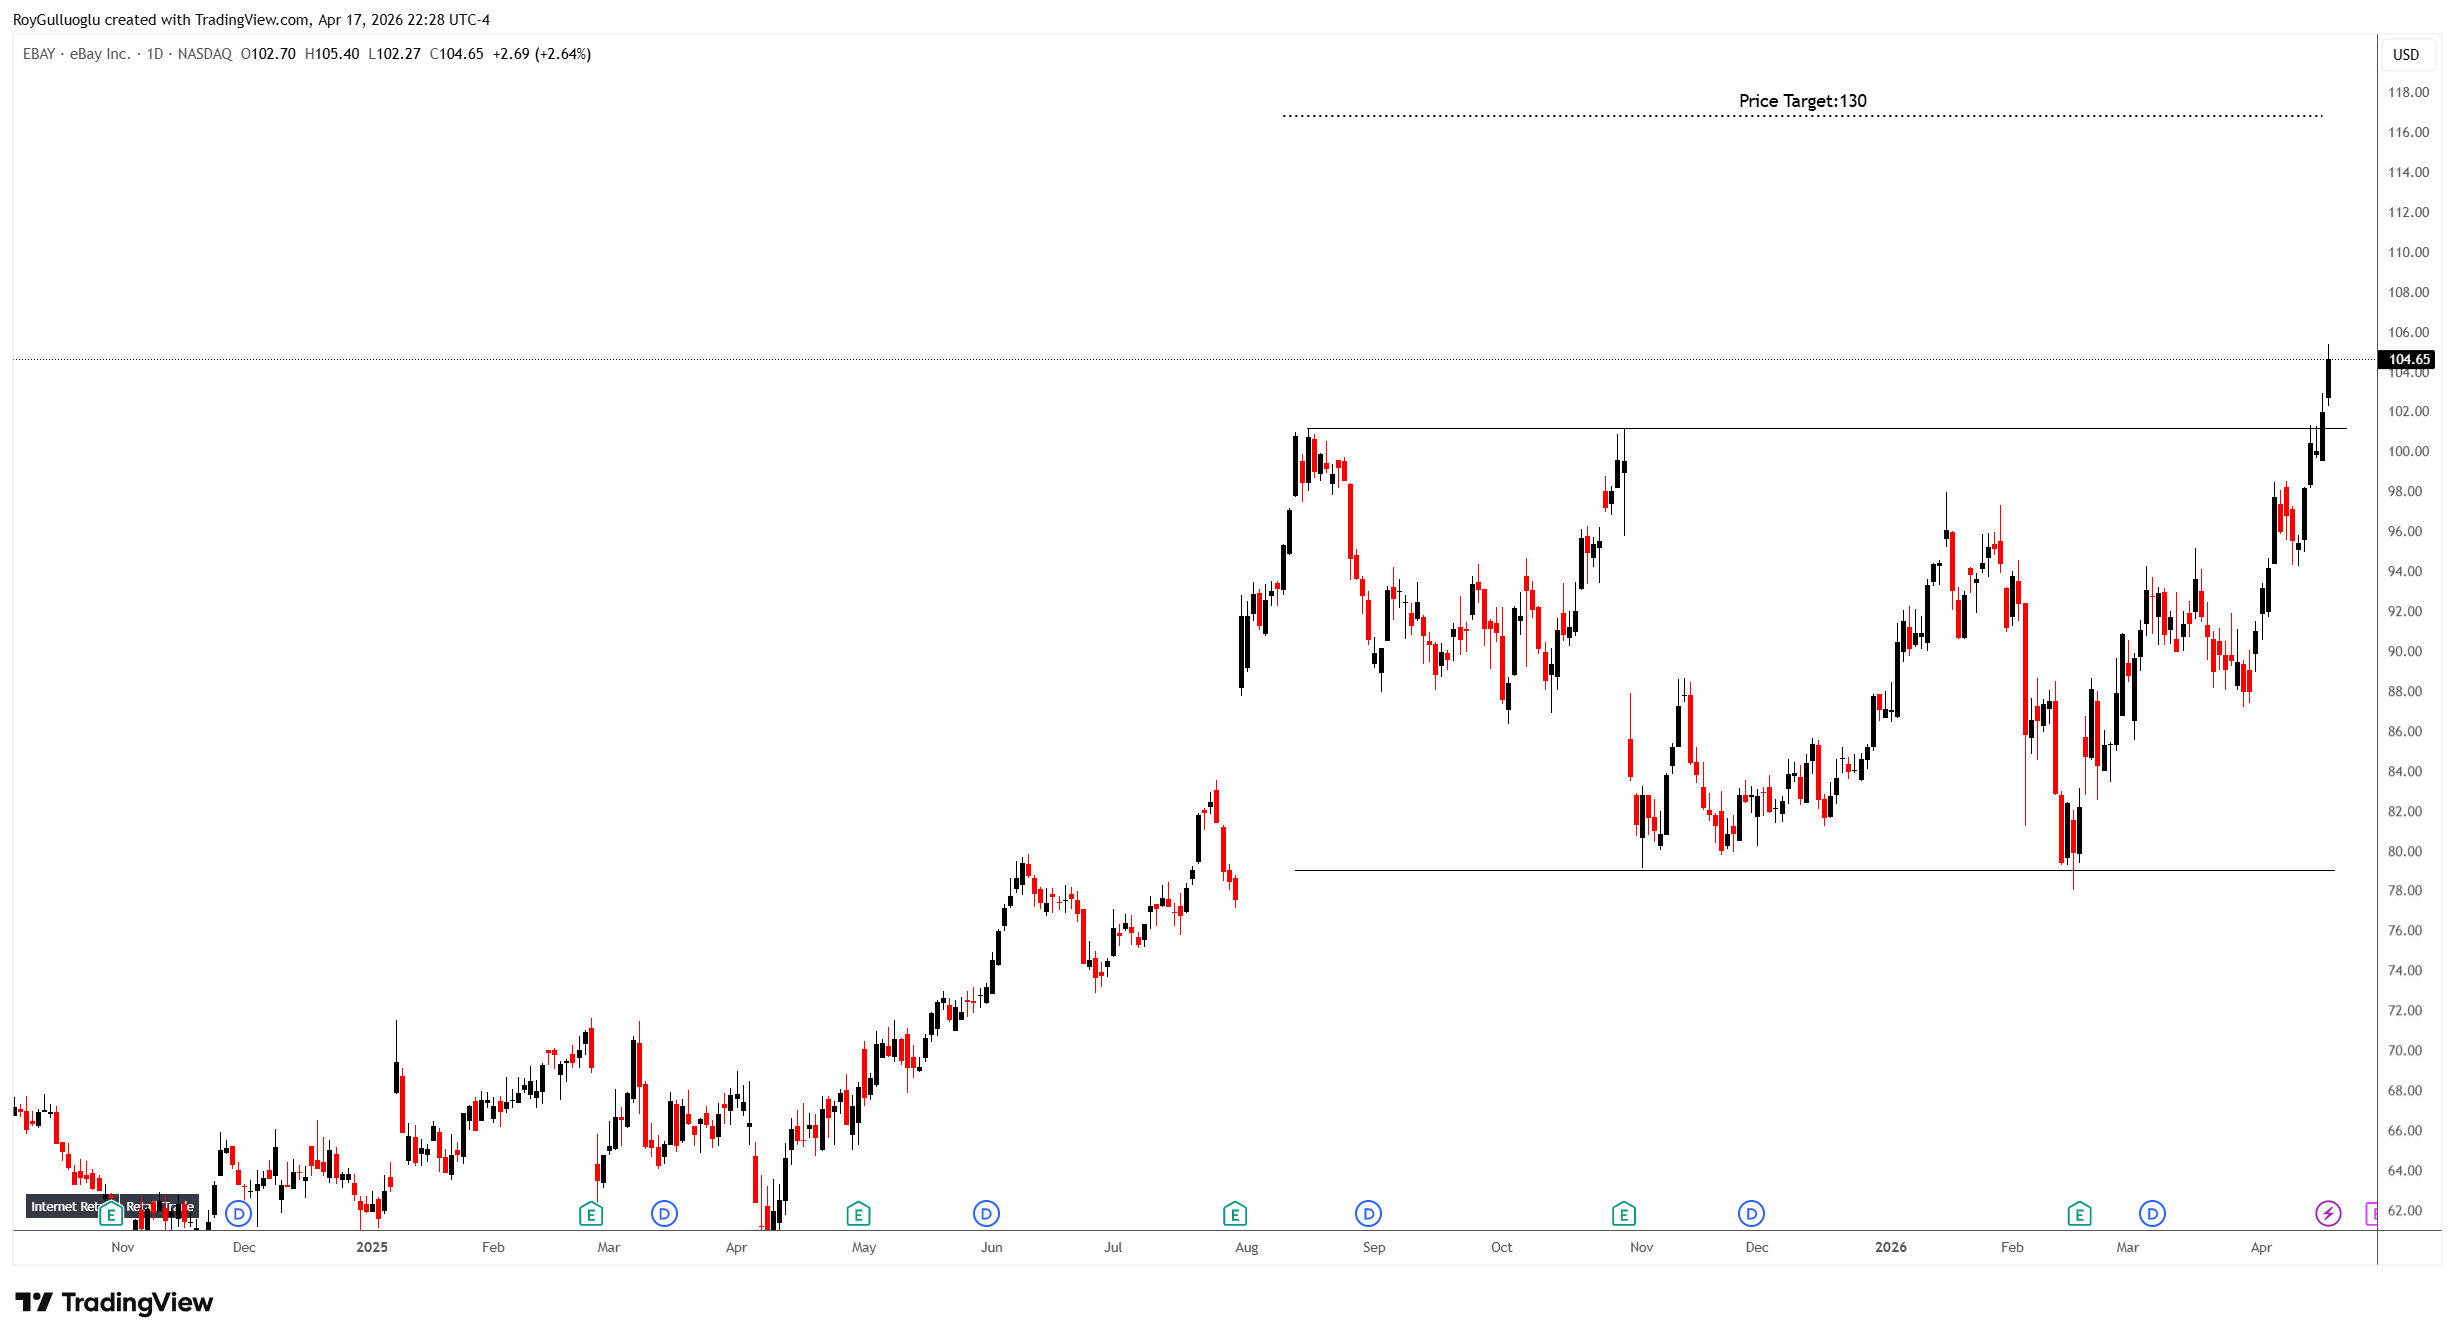
IAC Inc., together with its subsidiaries, operates as a media and internet company worldwide.
The above daily chart formed an approximately 5-month-long rectangle chart pattern as a bullish continuation after an uptrend.
The horizontal boundary at 101.15 levels acted as a resistance within this pattern.
A daily close above 104.18 levels validated the breakout from the 5-month-long rectangle chart pattern.
Based on this chart pattern, the potential price target is 130 levels.
Monarch Casino & Resort, Inc.-(MCRI/NYSE)-Long Idea
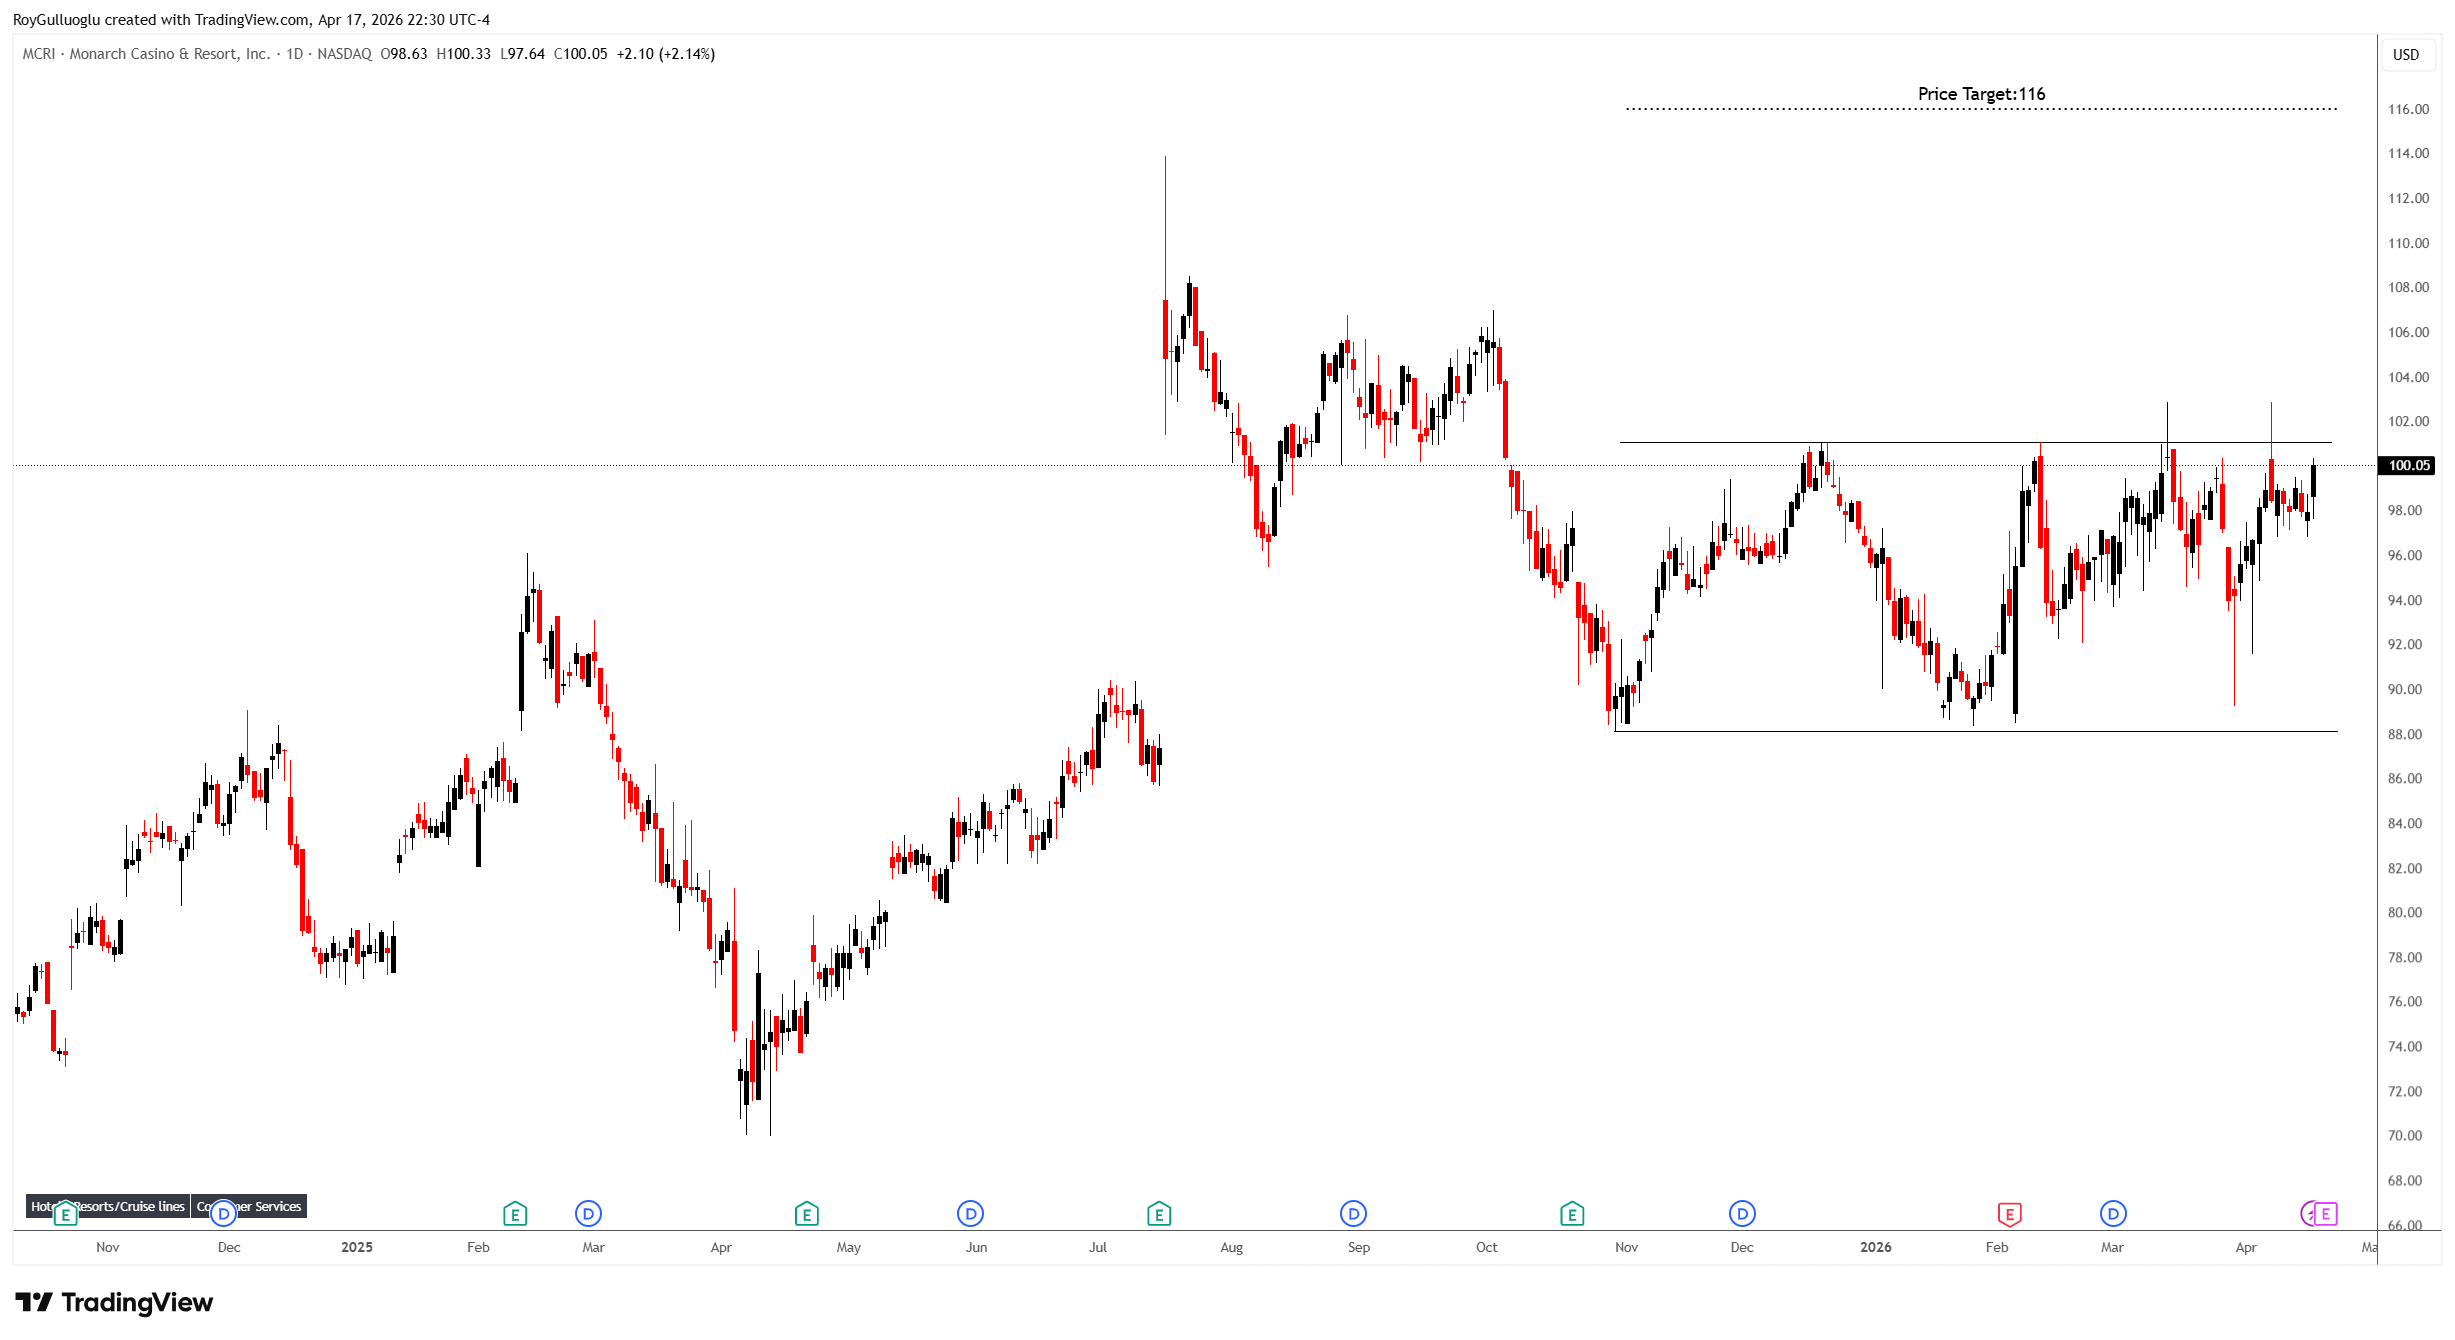
Monarch Casino & Resort, Inc., through its subsidiaries, owns and operates hotels and casinos.
The above daily chart formed an approximately 4-month-long rectangle chart pattern as a bullish reversal after a downtrend.
The horizontal boundary at 101 levels acts as a resistance within this pattern.
A daily close above 104 levels would validate the breakout from the 4-month-long rectangle chart pattern.
Based on this chart pattern, the potential price target is 116 levels.