

Before moving on to this week's trade ideas, I would like to share a brief note on the global outlook…
Even though there are tons of good setups out there, being aware of the potential risks and avoiding FOMO would be important.
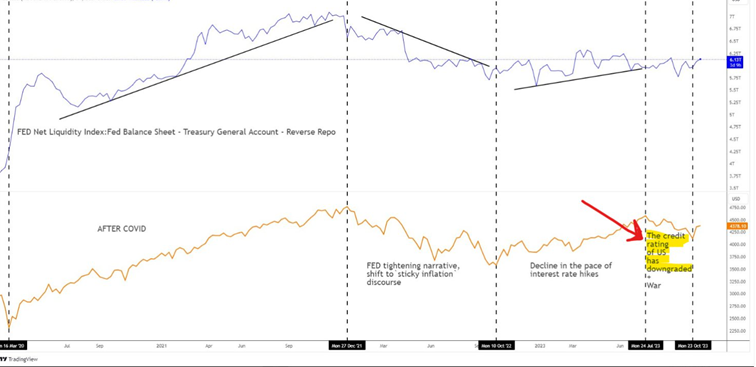
The chart below illustrates the relationship between the FED net liquidity index and the SP500 index. As liquidity in the market increases, we observe an upward trend in the SP500 and vice versa. The AI narrative, the increase in the EPS expectations, the downward tendency in yields, and lastly the strength shown against the lack of demand on 30Y auctions have been the main drivers of the positive outlook of the equity markets. However, the impact of the liquidity is very crucial as well. Thanks to the decrease in the demand for the reverse repo tool, the attached net liquidity index has been rising. The reverse repo tool can be thought of as the amount where the excess reserves in the market are parked overnight. As the parked amount decreases, money enters the market, liquidity increases, and this positively impacts the stock market. Another crucial point to consider came after the market closed on Friday. Moody's downgraded the American credit rating. The impact of the first rating downgrade in August 2023 can be seen in the chart. Let's see if the effect will be similar this time.
Other potential risk factors to consider;
Potential government shutdown
Potential illiquidity in treasuries in Q4-remember the lack of demand at the long end of the curve which drove the market lower. (Considering the given reaction to the lack of demand for this week's 30Y treasuries, the market did not respond much.)
Geopolitical events
Energy prices
BoJ’s stronger policy shift
New setups
Adobe Inc-(ADBE/NASDAQ)-Long Idea
Adobe Inc. provides a range of software and services designed for content creation and the analysis of digital advertising and marketing effectiveness.
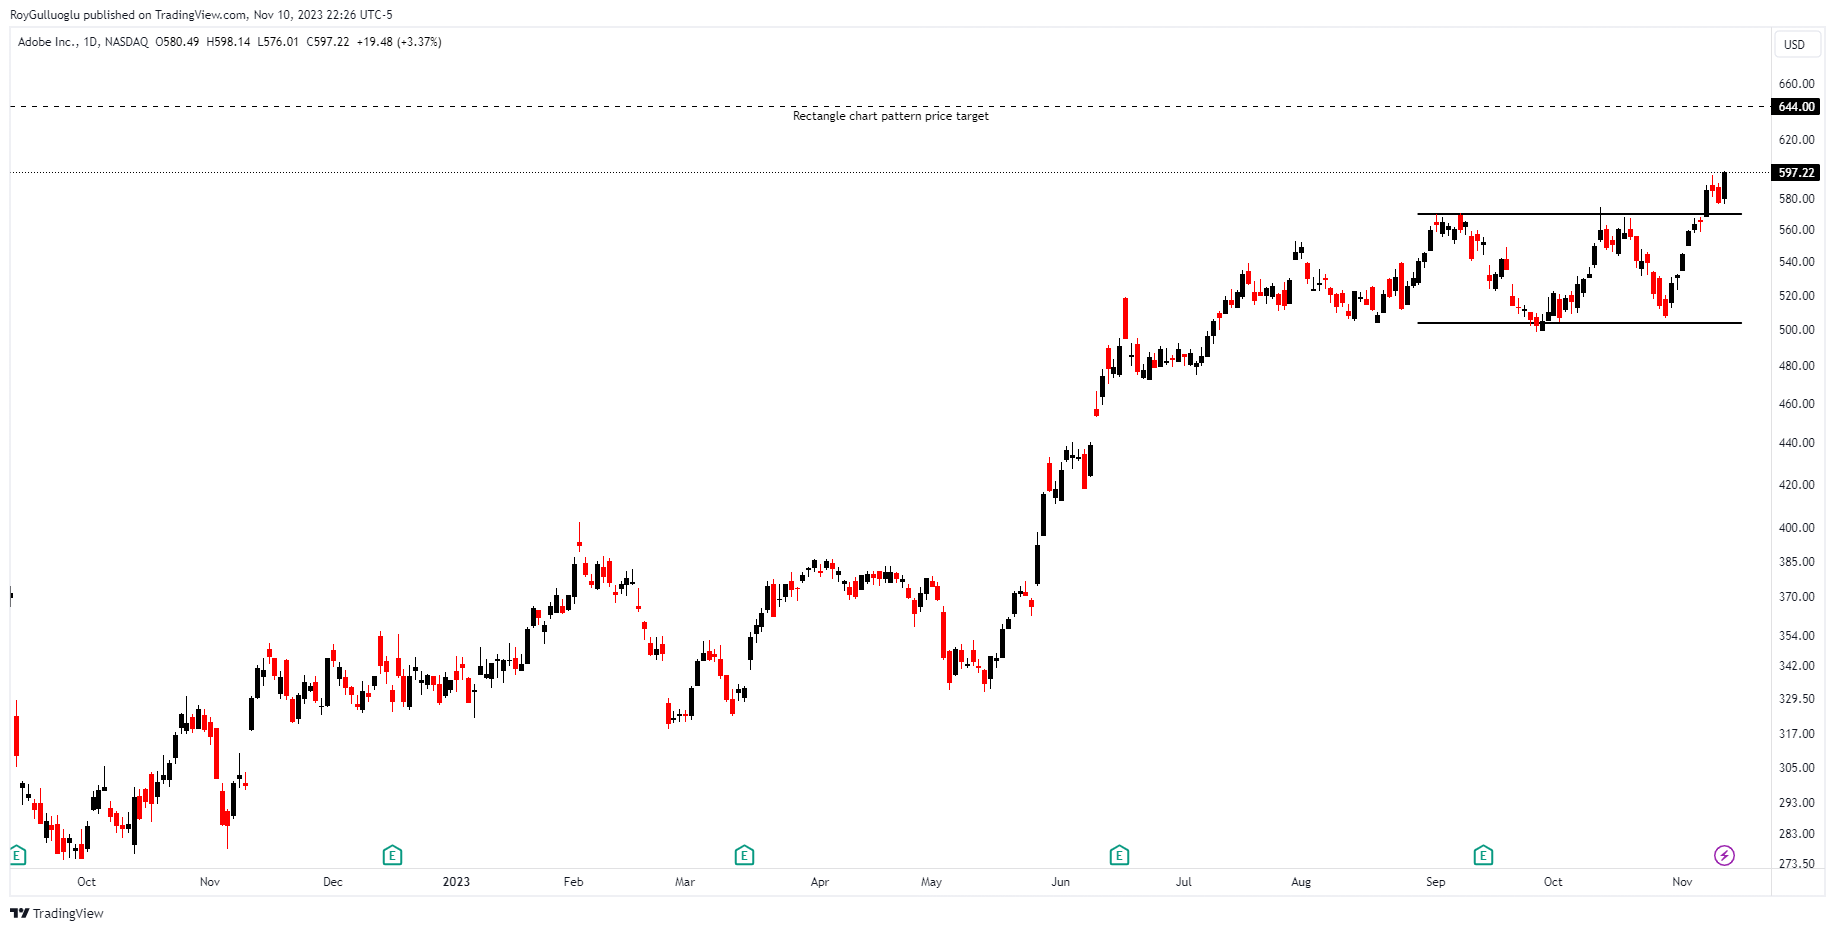
The above daily chart formed an approximately 2-month-long rectangle chart pattern as a bullish continuation after an uptrend.
Within this pattern, the horizontal boundary at 570 levels acted as strong resistance.
A daily close above 587 levels validated the breakout from the 2-month-long rectangle chart pattern.
The potential price target, based on this chart pattern, is 644 levels.
ADBE, classified under the "technology" sector, falls under the “Large Cap - Growth” stock category.
Three-quarters of gross margin, EPS, and revenue acceleration YoY in Quarterly Earnings is another strength of the stock.
Pinterest Inc-(PINS/NYSE)-Long Idea
Pinterest serves as a visual discovery engine, utilized by over 250 million people each month to seek inspiration for various aspects of their lives, including ideas for dinner recipes, home decor, and new outfits.
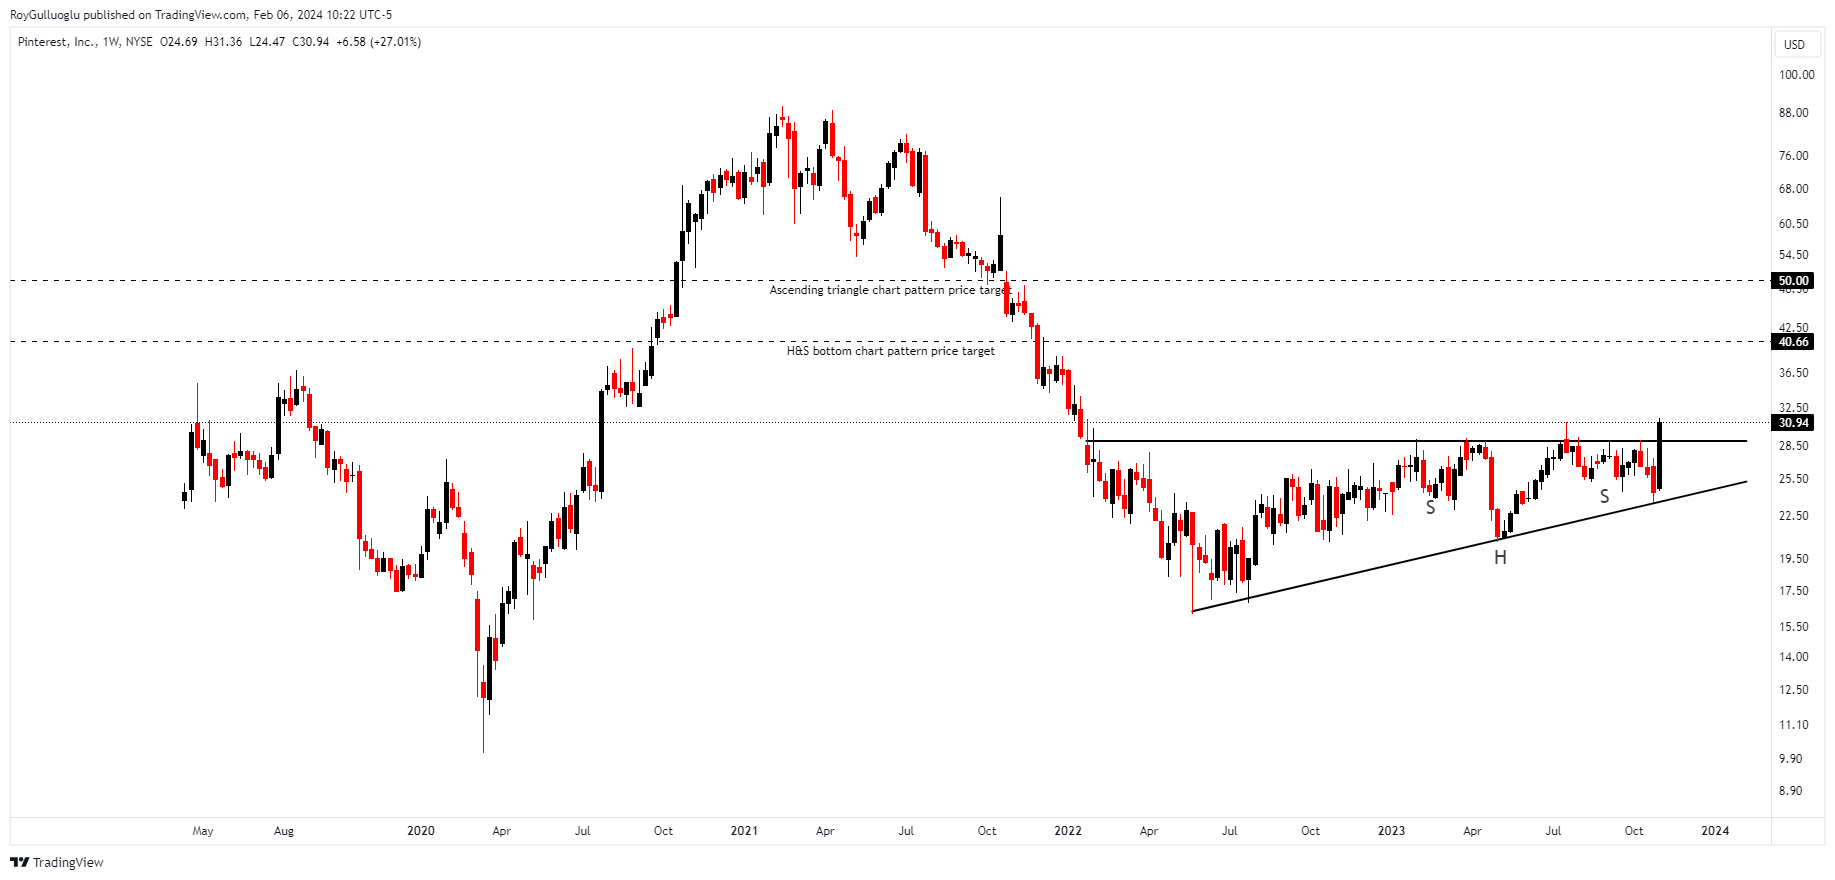
The above weekly chart formed an approximately 18-month-long ascending triangle chart pattern as a bullish reversal after a downtrend and a 10-month-long H&S bottom chart pattern.
Within this pattern, the horizontal boundary at 29 levels acted as strong resistance.
A daily close above 29.87 levels validated the breakout from the 18-month-long ascending triangle chart pattern and 10-month-long H&S bottom chart pattern.
The potential price targets, based on these chart patterns, are respectively 50 and 40.66 levels.
PINS, classified under the "communications" sector, falls under the “Large Cap - Growth” stock category.
Three-quarters of EPS acceleration.
Copart Inc-(CPRT/NASDAQ)-Long Idea
Copart, Inc. is a worldwide supplier of online vehicle auction and remarketing services, catering to automotive resellers, including insurance, rental car, fleet, and finance companies across 11 countries: the US, Canada, the UK, Germany, Ireland, Brazil, Spain, UAE, Bahrain, Oman, and Finland.
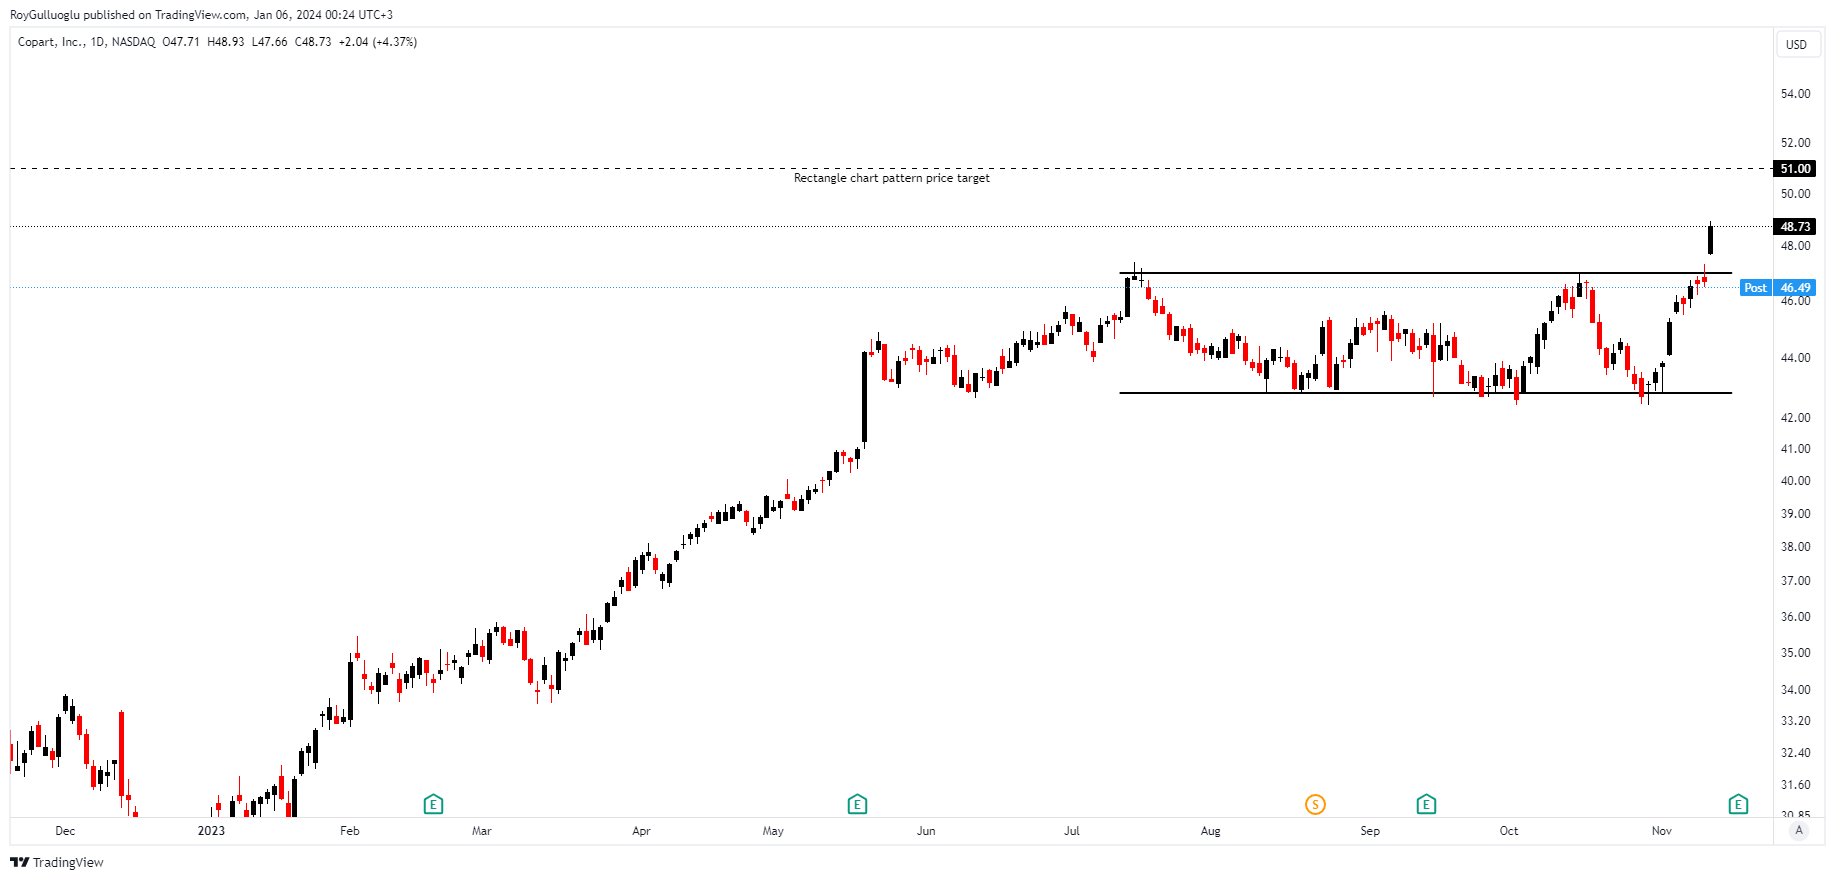
The above daily chart formed an approximately 3-month-long rectangle chart pattern as a bullish continuation after an uptrend.
Within this pattern, the horizontal boundary at 47 levels acted as strong resistance.
A daily close above 48.4 levels validated the breakout from the 3-month-long rectangle chart pattern.
The potential price target, based on this chart pattern, is 51 levels.
CPRT, classified under the "industrials" sector, falls under the “Large Cap - Value” stock category.
ServiceNow Inc-(NOW/NYSE)-Long Idea
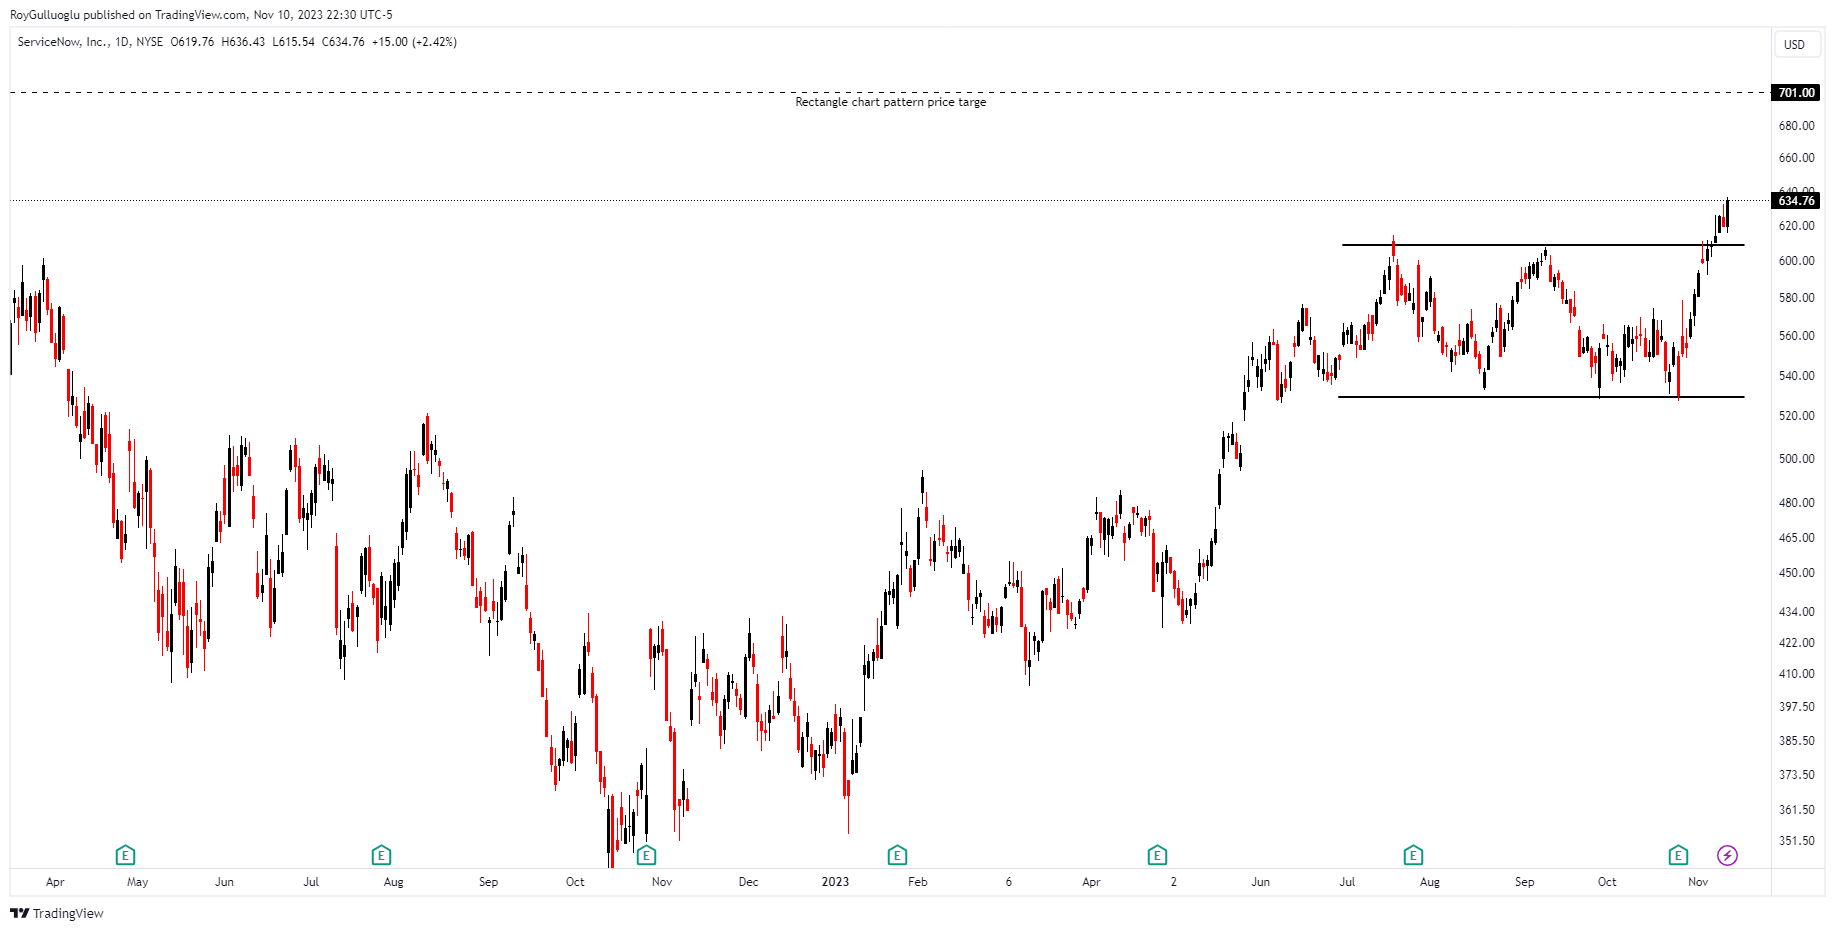
ServiceNow, Inc. is a software company headquartered in Santa Clara, California, specializing in developing a cloud computing platform aimed at assisting companies in the management of digital workflows for enterprise operations.
The above daily chart formed an approximately 3-month-long rectangle chart pattern as a bullish continuation after an uptrend.
Within this pattern, the horizontal boundary at 609.16 levels acted as strong resistance.
A daily close above 627.43 levels validated the breakout from the 3-month-long rectangle chart pattern.
The potential price target, based on this chart pattern, is 701 levels.
NOW, classified under the "technology" sector, falls under the “Large Cap - Growth” stock category.
AppFolio Inc.-(APPF/NASDAQ)-Long Idea
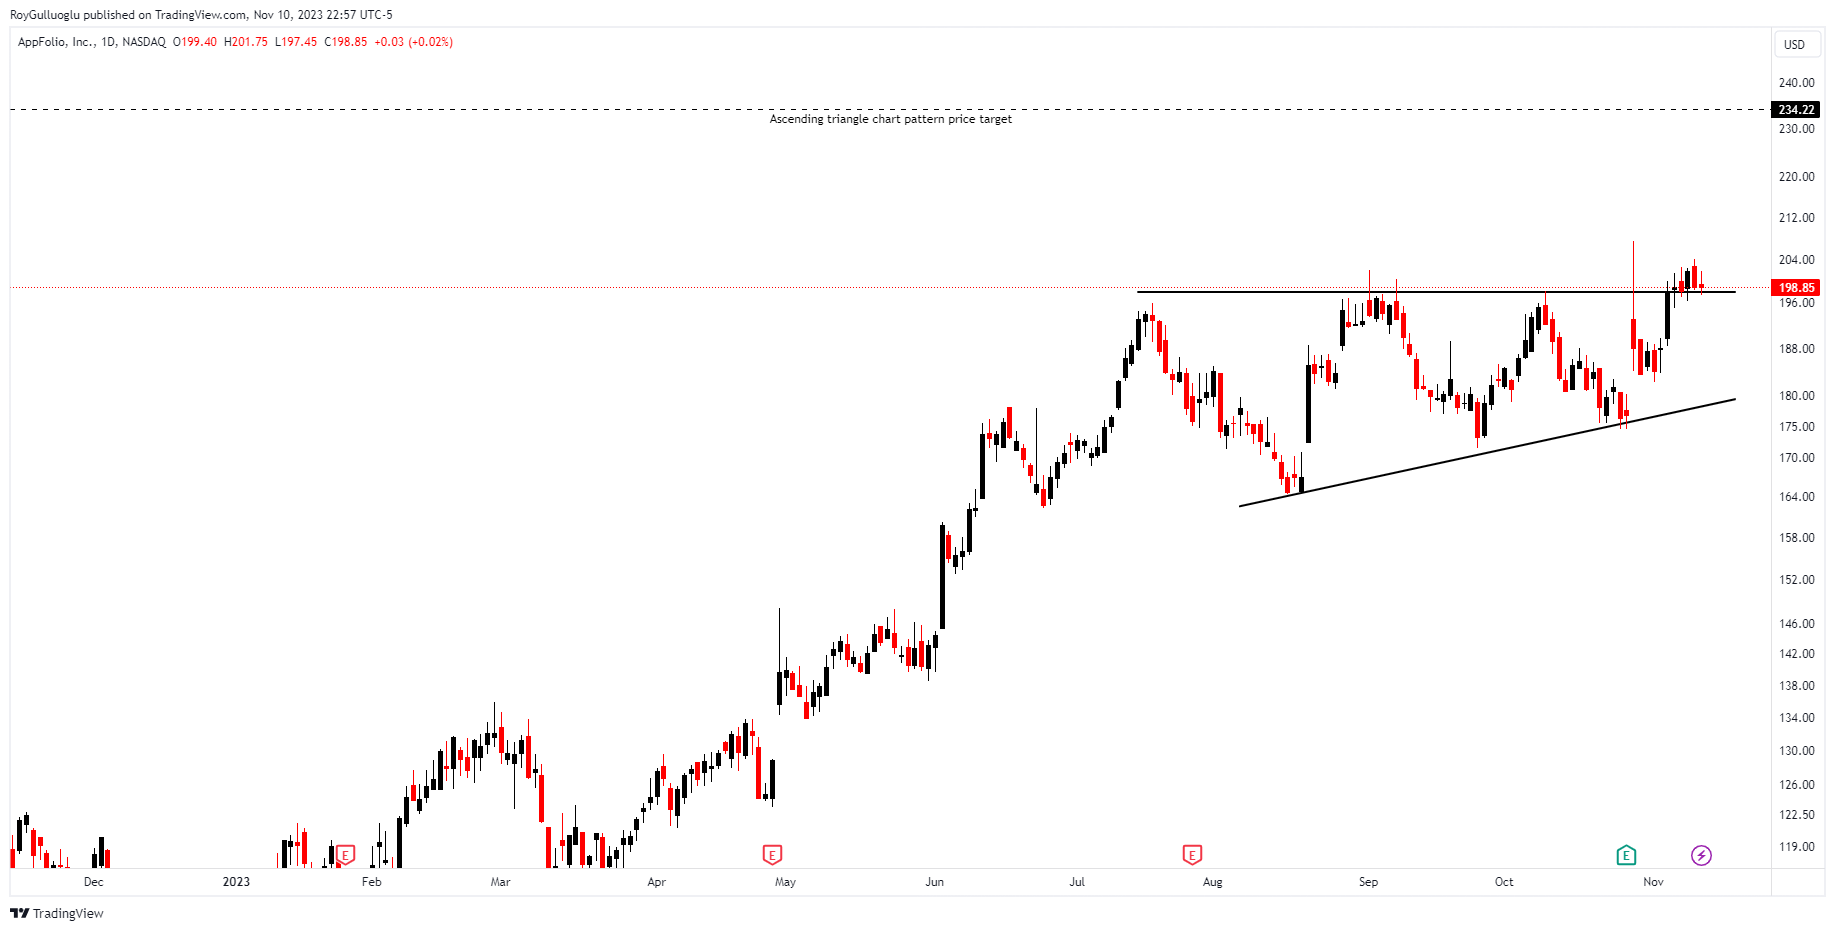
AppFolio Inc. is a supplier of cloud-based software solutions tailored to specific industries, catering to small and medium-sized businesses (SMBs) in the property management and legal sectors.
The above daily chart formed an approximately 3-month-long ascending triangle chart pattern as a bullish continuation after an uptrend.
Within this pattern, the horizontal boundary at 197.85 levels acts as strong resistance.
A daily close above 203.78 levels would validate the breakout from the 3-month-long ascending triangle chart pattern.
The potential price target, based on this chart pattern, is 234.22 levels.
APPF, classified under the "technology" sector, falls under the “Mid Cap - Growth” stock category.
Ross Stores Inc.-(ROST/NASDAQ)-Long Idea
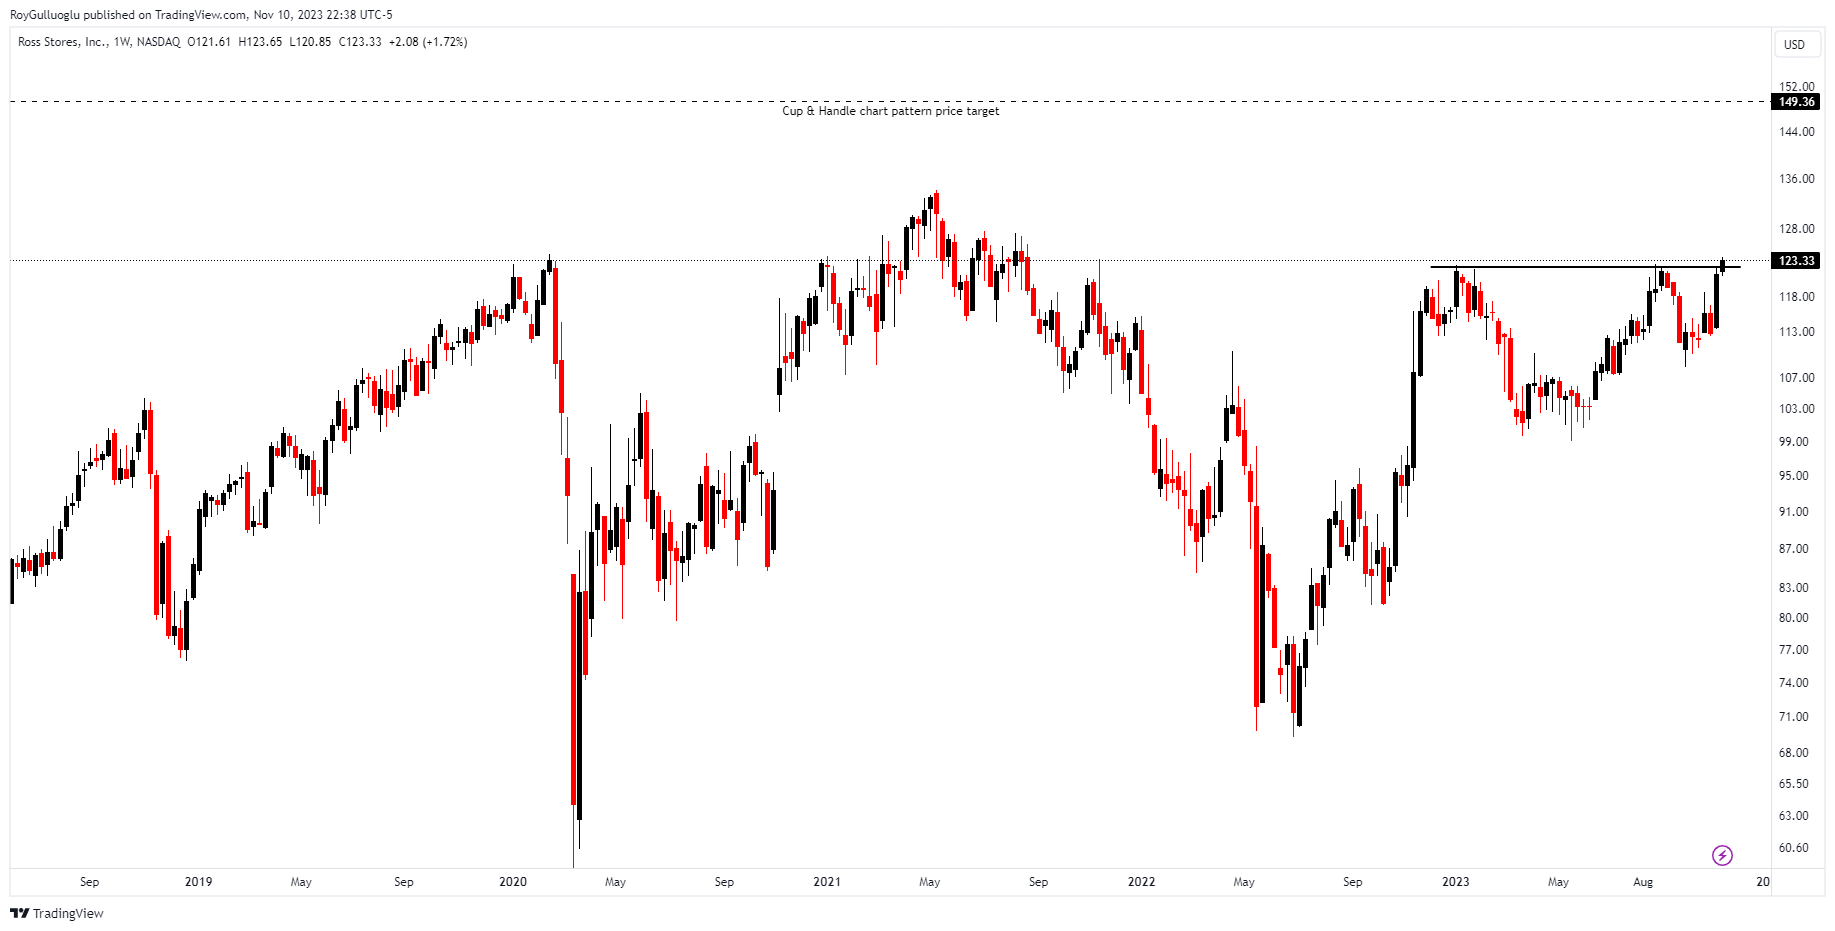
Ross Stores Inc. operates off-price apparel and home fashion chains, focusing on the sale of name-brand and designer apparel, accessories, footwear, and home fashions to middle-income consumers.
The above daily chart formed an approximately 11-month-long cup & handle chart pattern.
Within this pattern, the horizontal boundary at 122.24 levels acts as strong resistance.
A daily close above 125.9 levels would validate the breakout from the 11-month-long cup & handle chart pattern.
The potential price target, based on this chart pattern, is 149 levels.
ROST, classified under the "consumer cyclical" sector, falls under the “Large Cap - Growth” stock category.
Meta Platforms-(META/NASDAQ)-Long Idea
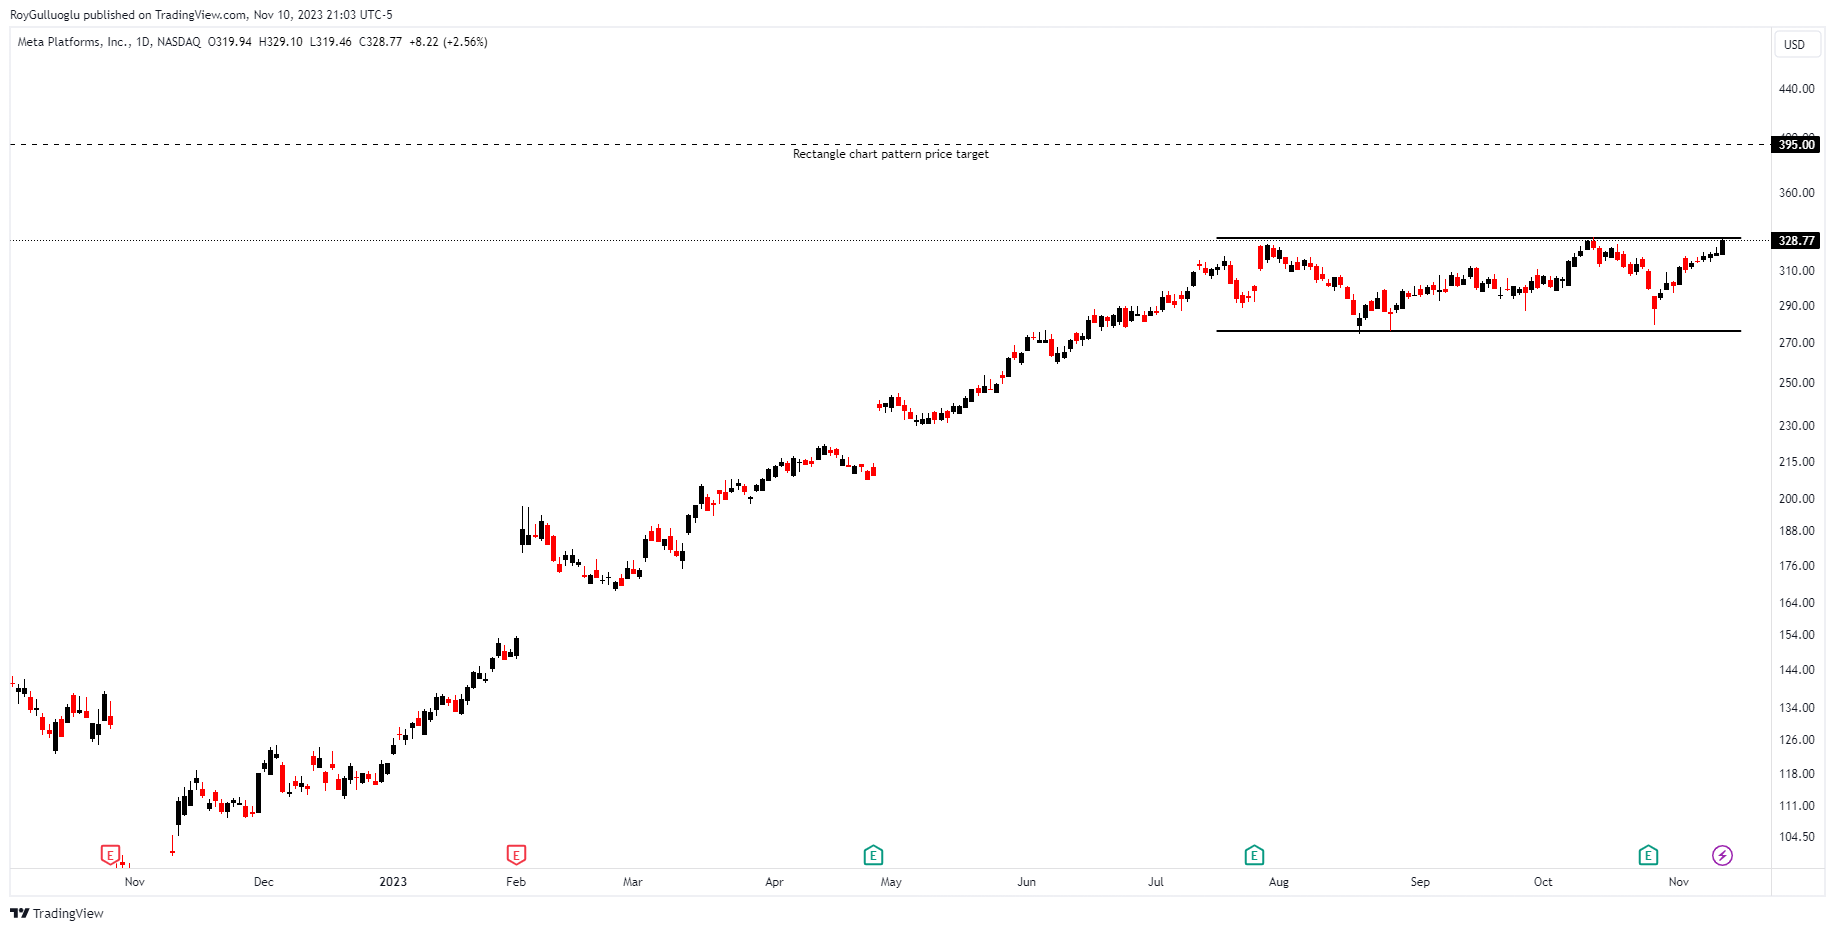
Meta Platforms, Inc., operating under the name Meta, previously known as Facebook, Inc., and TheFacebook, Inc., is a multinational technology conglomerate headquartered in Menlo Park, California. The corporation is responsible for the management of various products and services, including Facebook, Instagram, Threads, and WhatsApp.
The above daily chart formed an approximately 2.5-month-long rectangle chart pattern as a bullish continuation after an uptrend.
Within this pattern, the horizontal boundary at 330 levels acts as strong resistance.
A daily close above 340 levels would validate the breakout from the 2.5-month-long rectangle chart pattern.
The potential price target, based on this chart pattern, is 395 levels.
META, classified under the "communication services" sector, falls under the “Large Cap - Growth” stock category.
Seagate Technology Holdings PLC-(STX/NASDAQ)-Long Ide
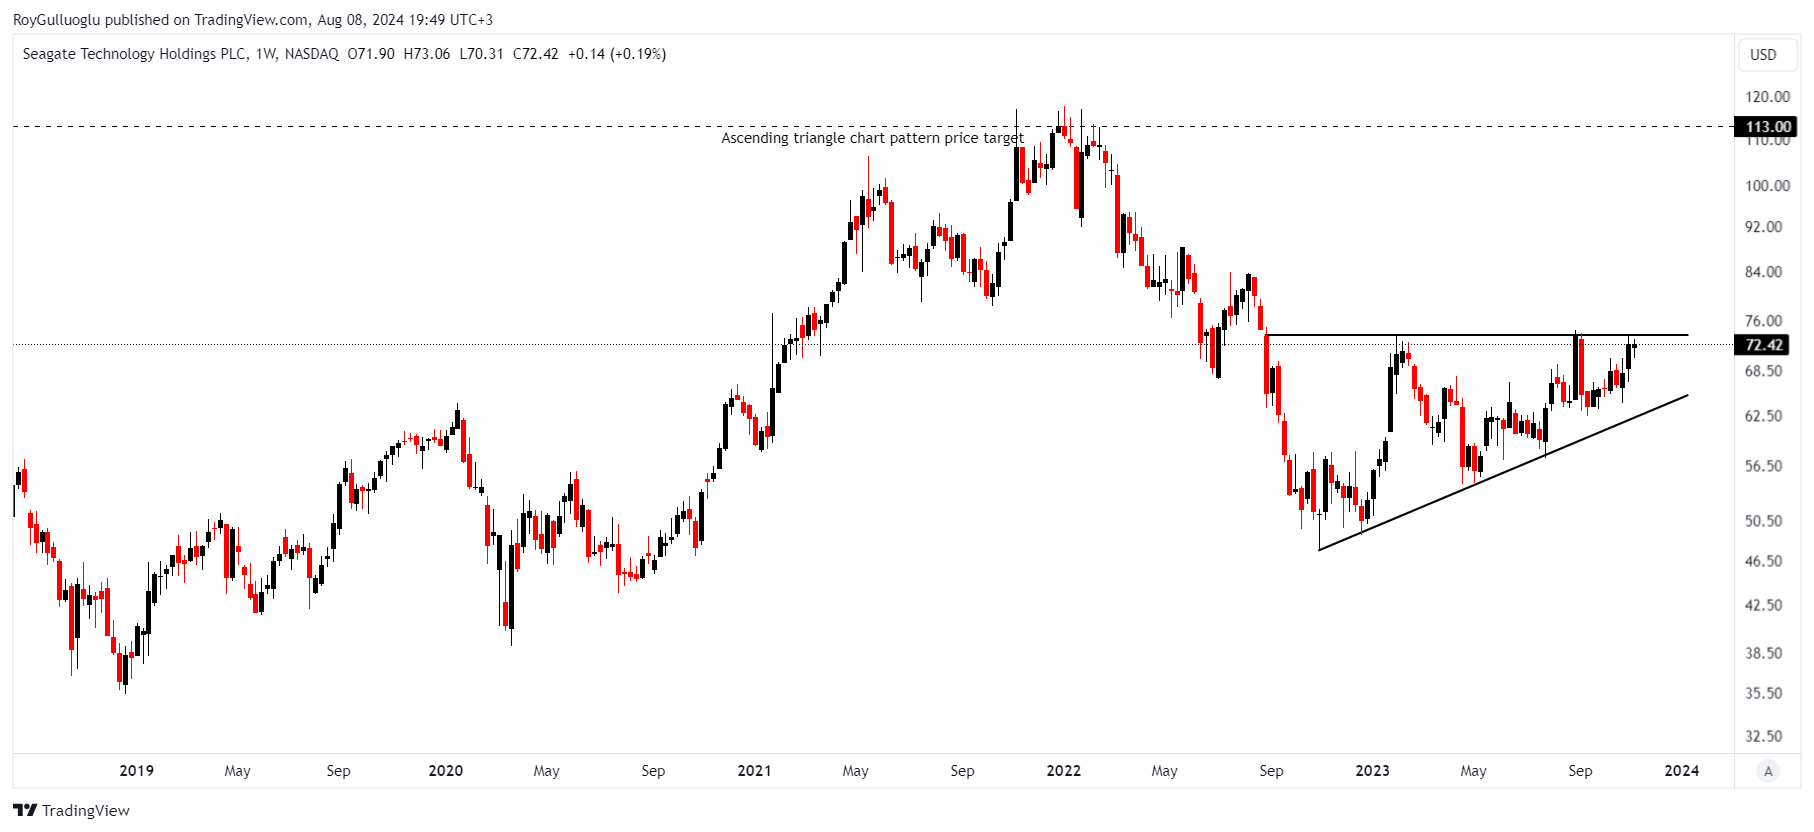
Seagate Technology PLC is a global manufacturer of hard disk drives (HDD). The company is involved in the design, development, and production of a wide variety of HDDs utilized in desktop PCs, notebook PCs, game consoles, digital video recorders, and enterprise storage markets.
The above weekly chart formed an approximately 13-month-long ascending triangle chart pattern as a bullish reversal after a downtrend.
Within this pattern, the horizontal boundary at 73.75 levels acts as strong resistance.
A daily close above 75.96 levels would validate the breakout from the 13-month-long ascending triangle chart pattern.
The potential price target, based on this chart pattern, is 113 levels.
STX, classified under the "technology" sector, falls under the “Large Cap - Growth” stock category.
Celanese Corporation-(CE/NYSE)-Long Idea
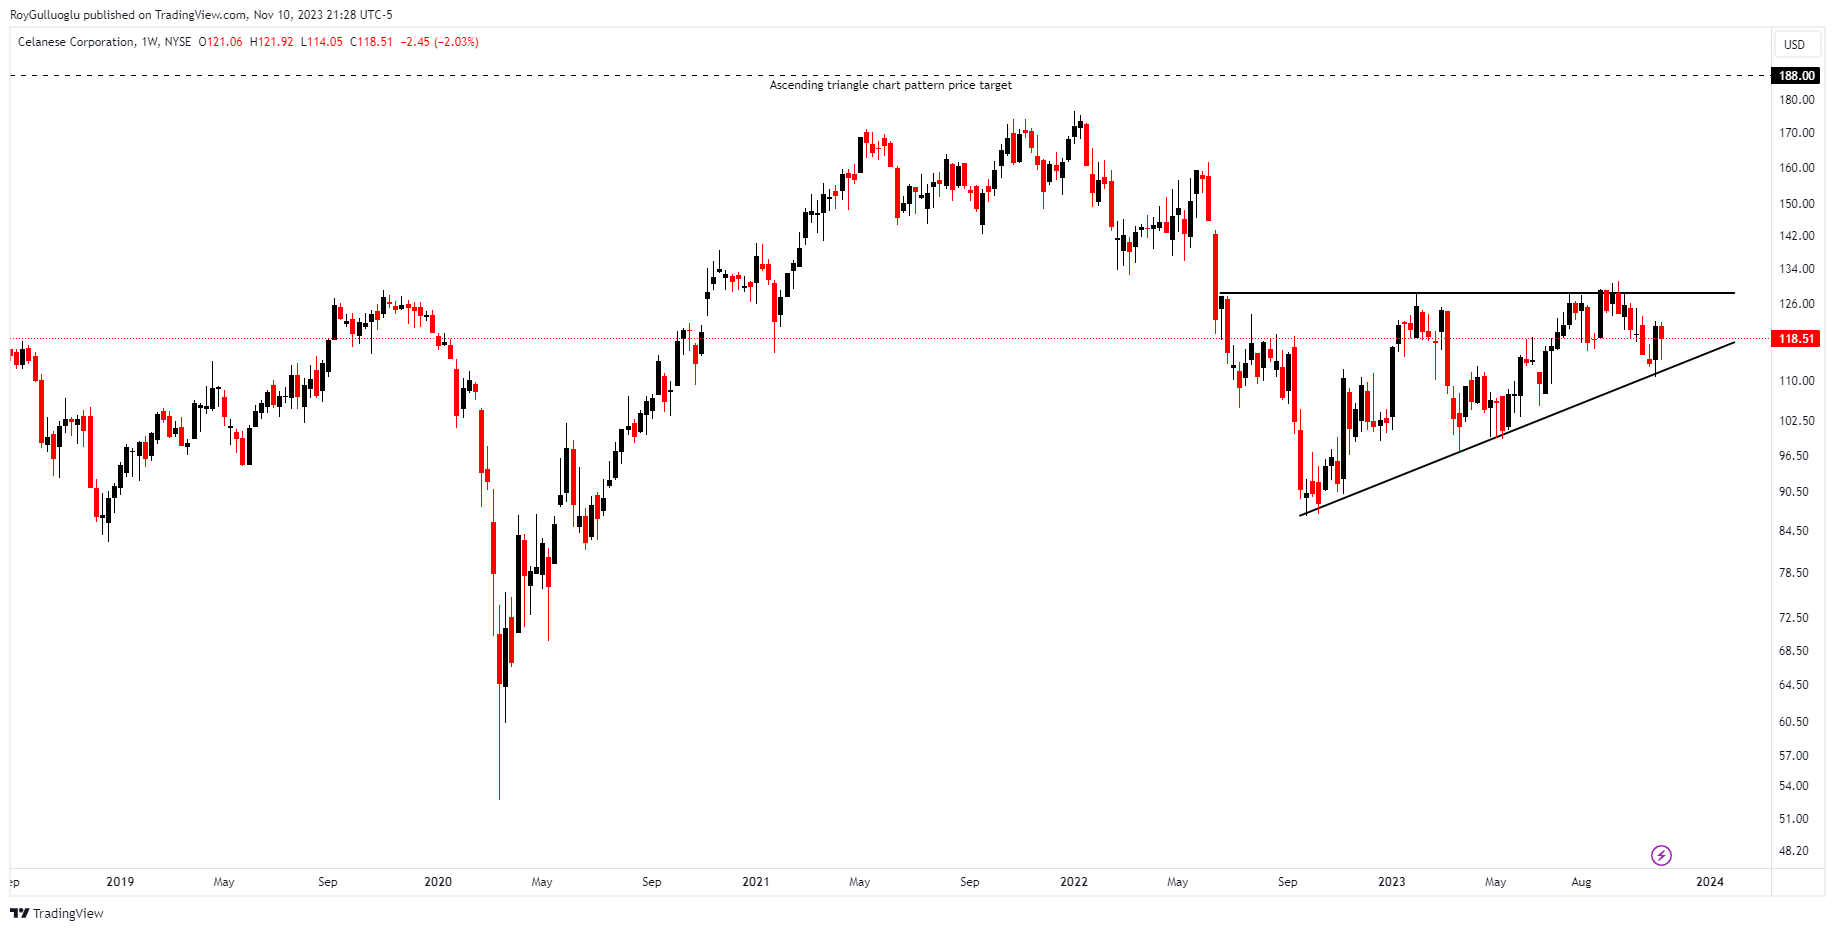
Celanese Corp is a chemical manufacturing company with a focus on producing industrial specialties and acetyl for diverse end markets, including coatings and adhesives. Additionally, the company manufactures cellulose derivatives.
The above weekly chart formed an approximately 14-month-long ascending triangle chart pattern as a bullish reversal after a downtrend.
Within this pattern, the horizontal boundary at 128.22 levels acts as strong resistance.
A daily close above 132 levels would validate the breakout from the 13-month-long ascending triangle chart pattern.
The potential price target, based on this chart pattern, is 188 levels.
CE, classified under the "basic materials" sector, falls under the “Large Cap - Value” stock category.
Ionis Pharmaceuticals-(IONS/NASDAQ)-Long Idea
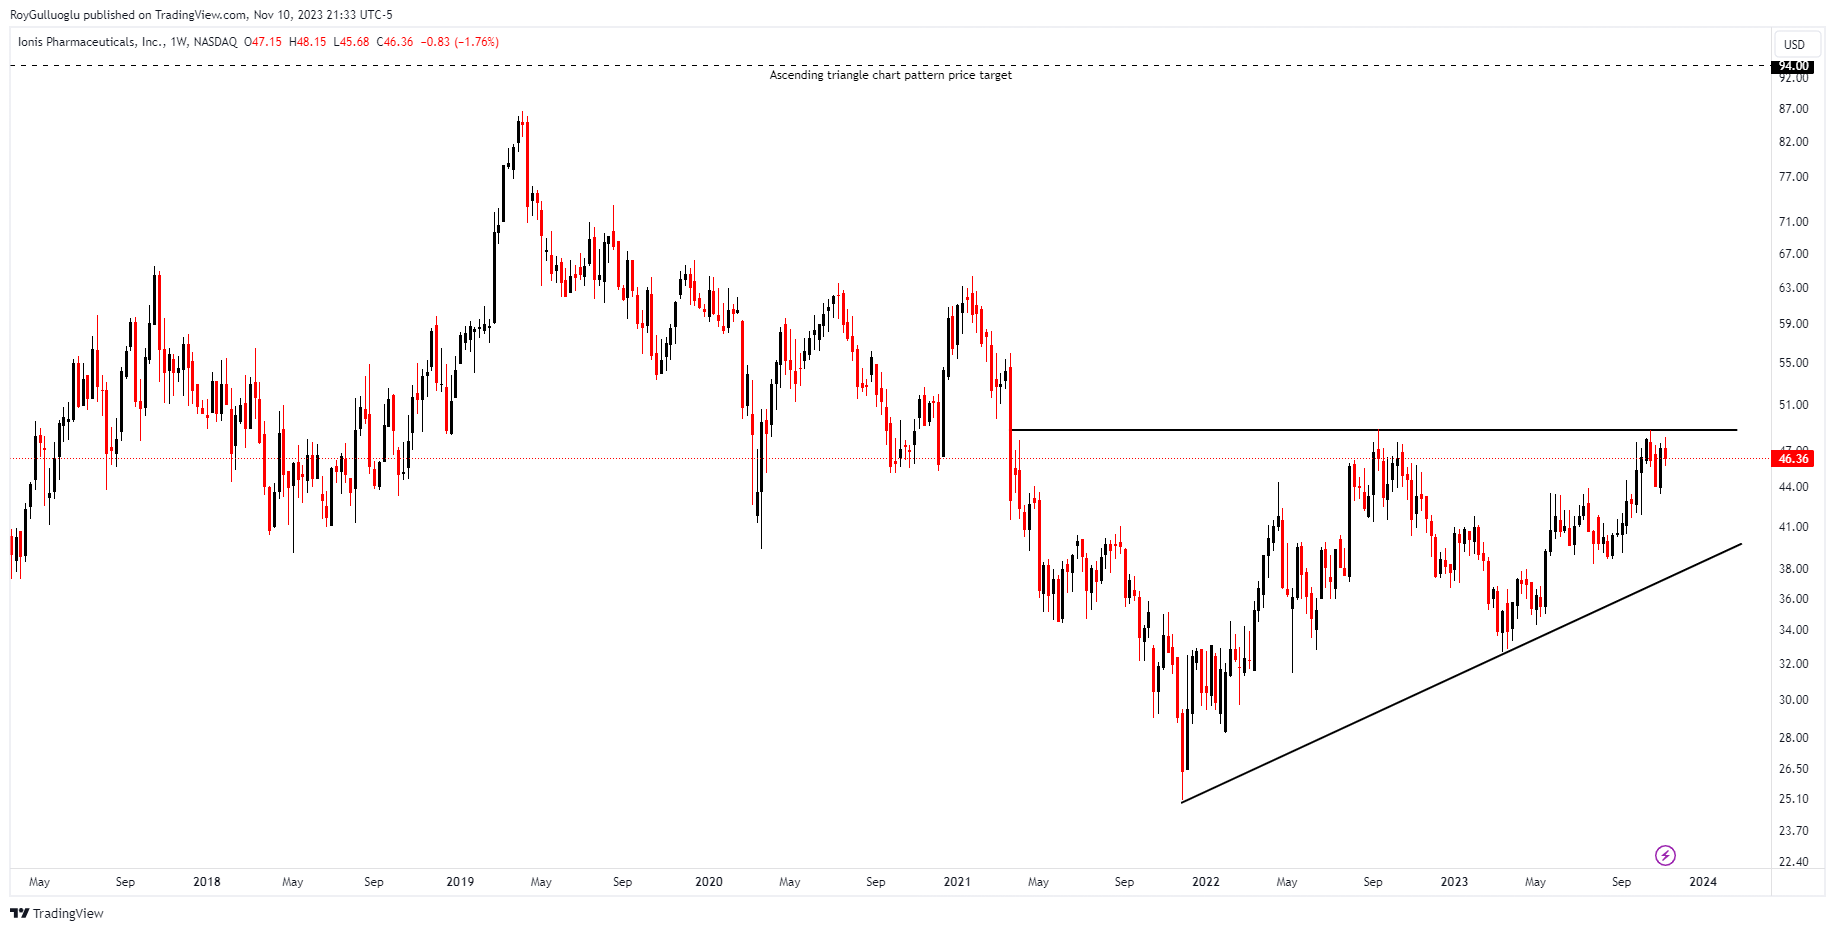
Ionis Pharmaceuticals Inc. is a company specializing in the discovery and development of RNA-targeted drugs. The extensive pipeline of the company encompasses 32 drugs designed to address a range of diseases, with a particular emphasis on cardiovascular, metabolic, severe, and rare conditions.
The above weekly chart formed an approximately 25-month-long ascending triangle chart pattern as a bullish reversal after a downtrend.
Within this pattern, the horizontal boundary at 48.75 levels acts as strong resistance.
A daily close above 50.21 levels would validate the breakout from the 25-month-long ascending triangle chart pattern.
The potential price target, based on this chart pattern, is 94 levels.
IONS, classified under the "health care" sector, falls under the “Mid Cap - Value” stock category.
EnLink Midstream-(ENLC/NYSE)-Long Idea
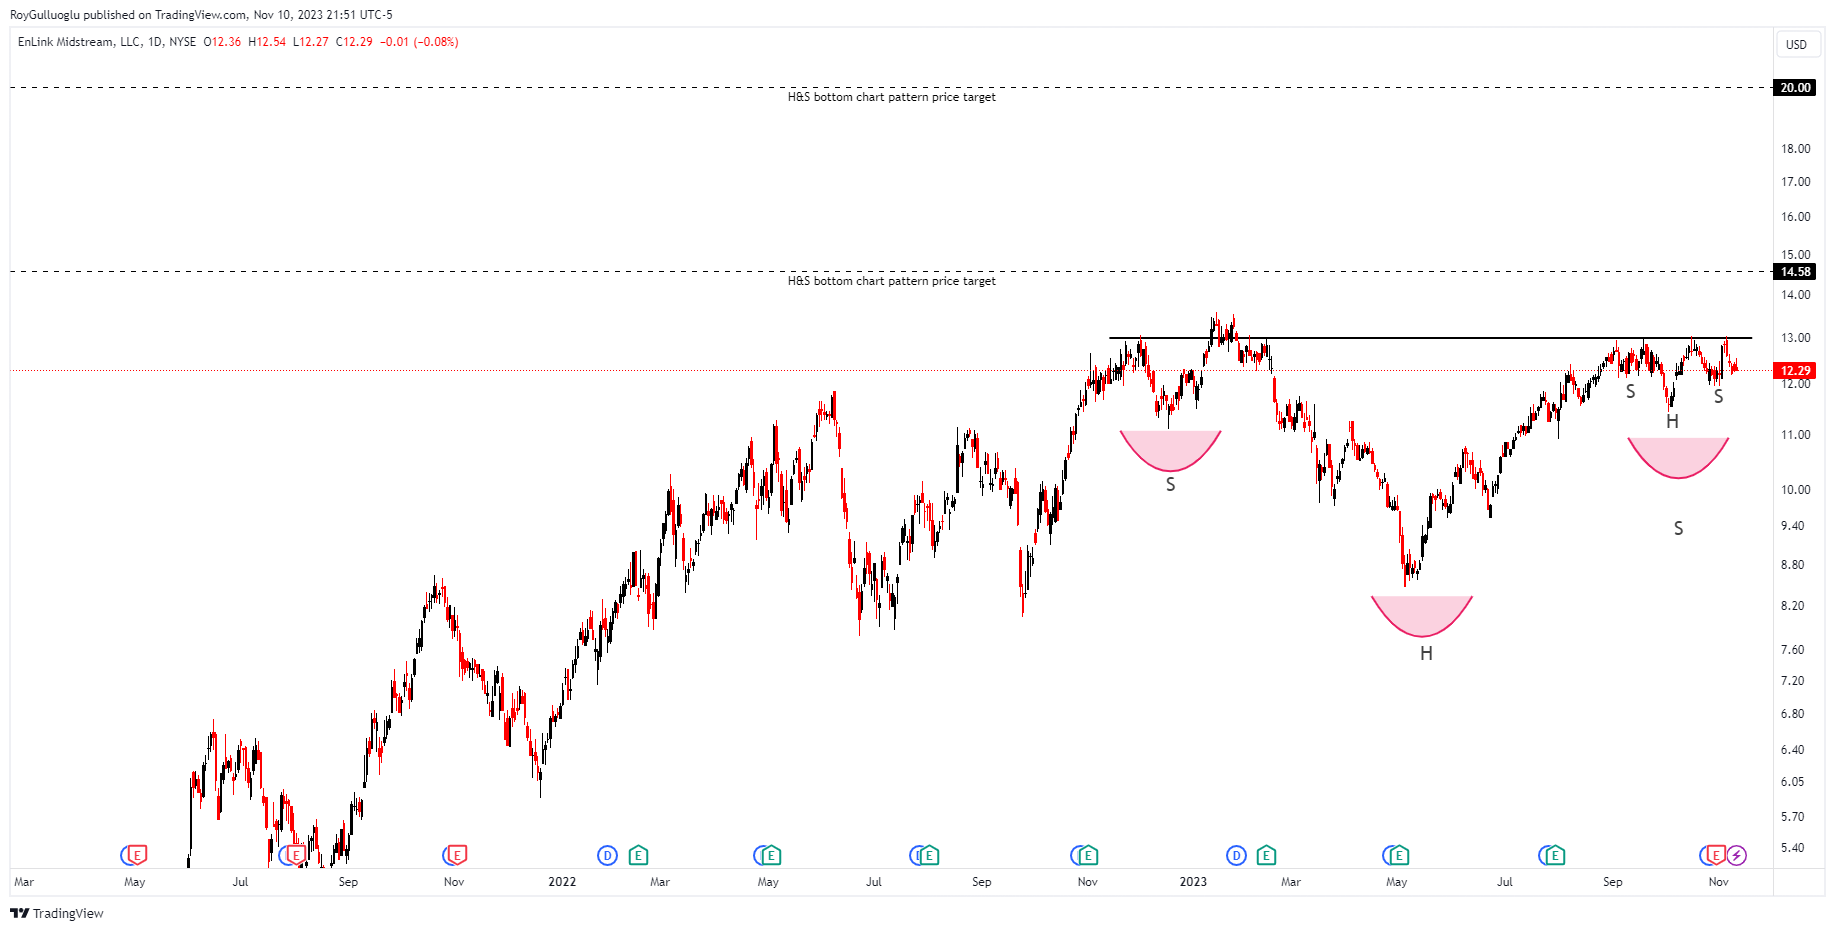
EnLink Midstream LLC is a fully integrated midstream company. Its subsidiaries are actively involved in the gathering, transmission, processing, fractionation, brine services, and marketing of producers of natural gas, crude oil, and condensates.
The above daily chart formed approximately 20-month-long and 1.5-month-long H&S top chart patterns as a bullish continuation after an uptrend.
Within these patterns, the horizontal boundary at 13 levels acts as strong resistance.
A daily close above 13.4 levels would validate the breakout from both chart patterns.
The potential price target, based on this chart pattern, is respectively 20 and 14.58 levels.
ENLC, classified under the "energy" sector, falls under the “Mid Cap - Income” stock category.
Follow-ups
Broadcom-(AVGO/NASDAQ)-Long Idea
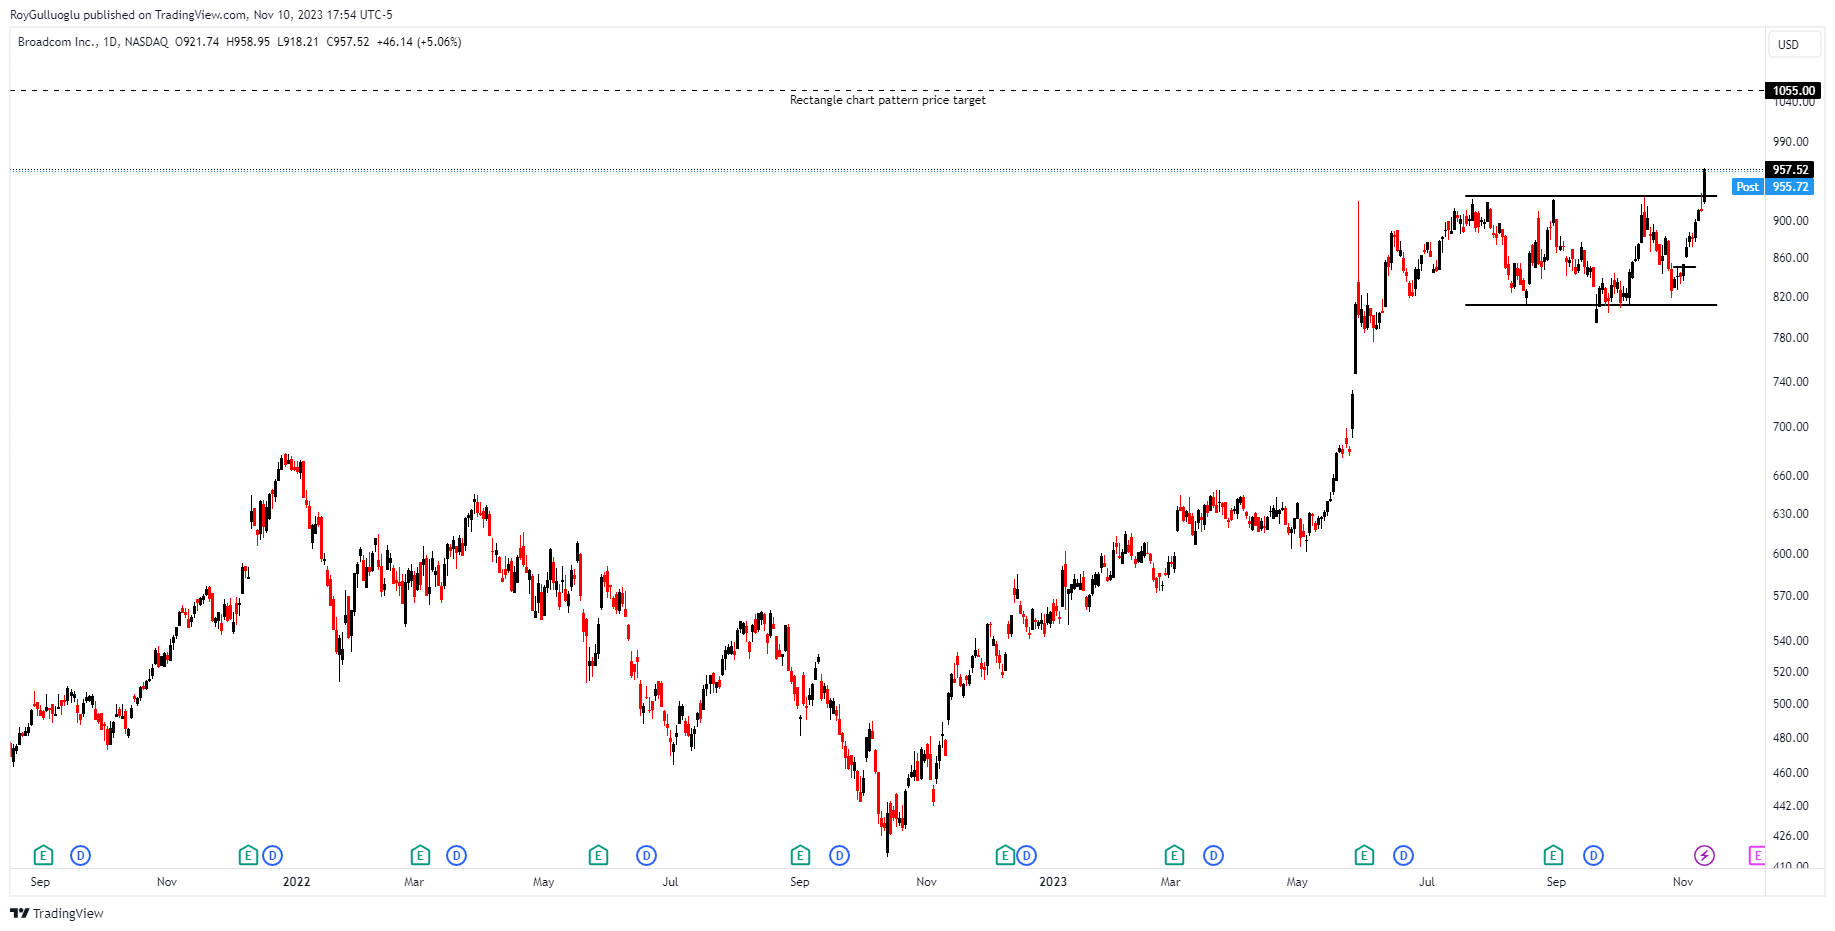
You can click the AVGO ticker above to access the first report explaining the RATIONALE behind the trade idea.
Hilton Worldwide Holdings-(HLT/NYSE)-Long/Short Idea
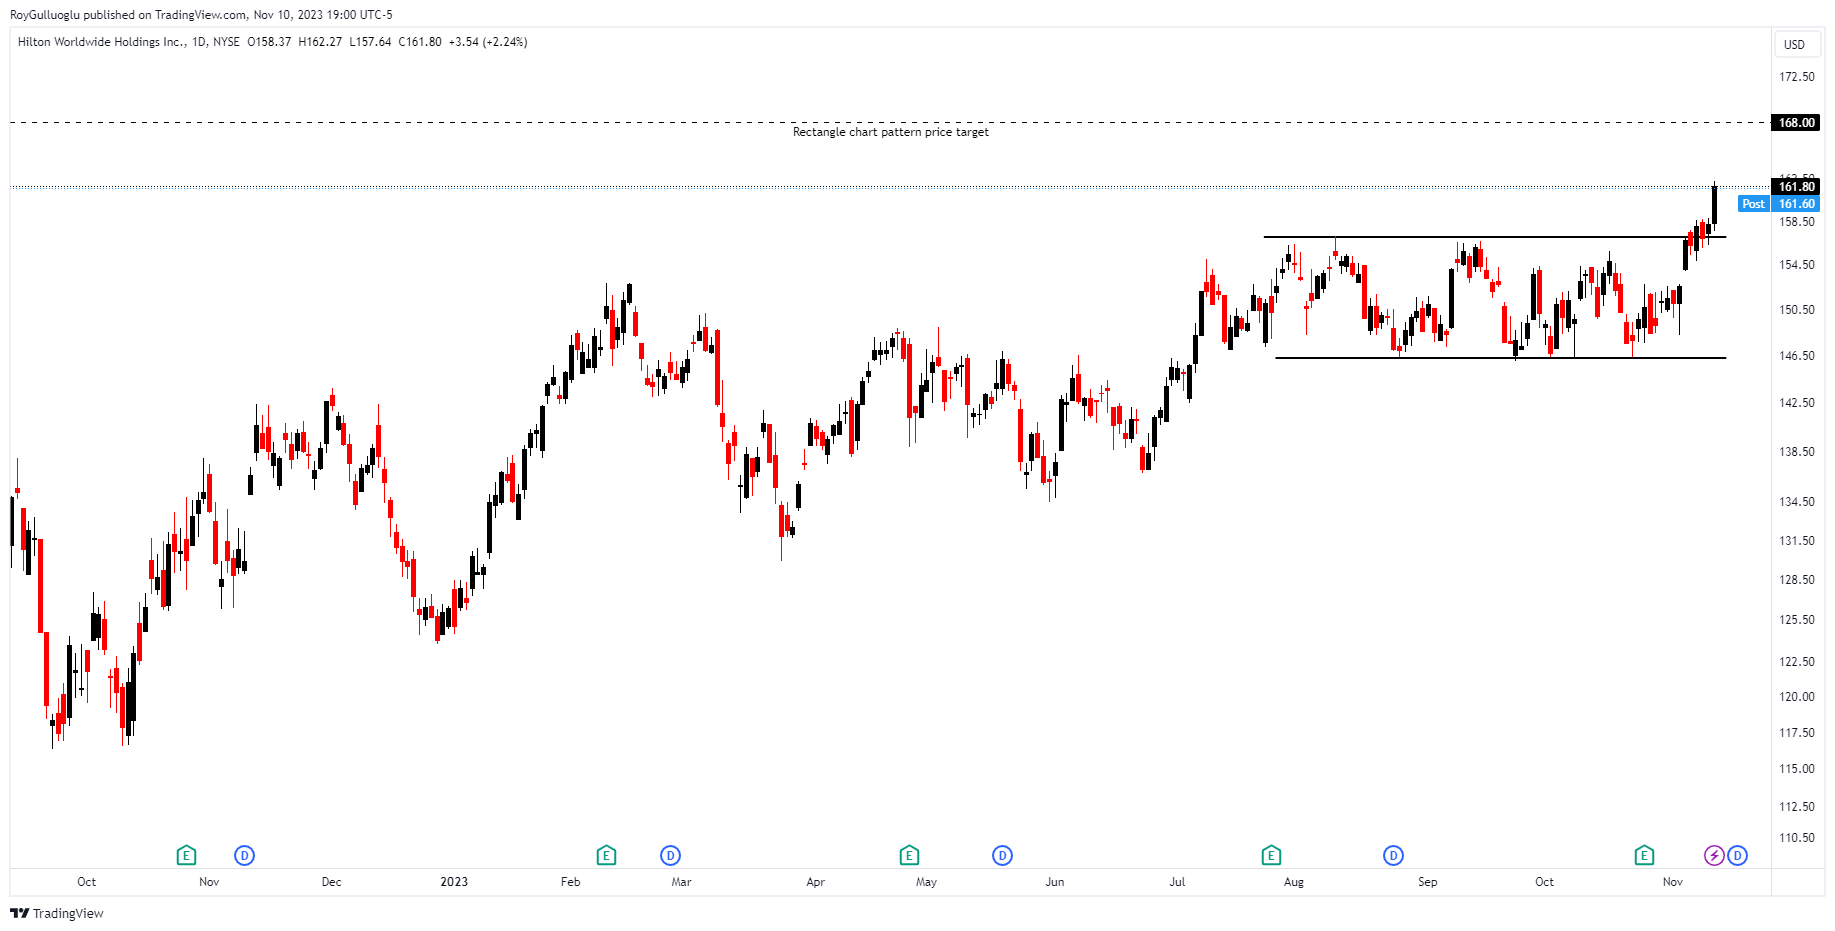
You can click the HLT ticker above to access the first report explaining the RATIONALE behind the trade idea.
Motorola Solutions Inc-(MSI/NYSE)-Long Idea
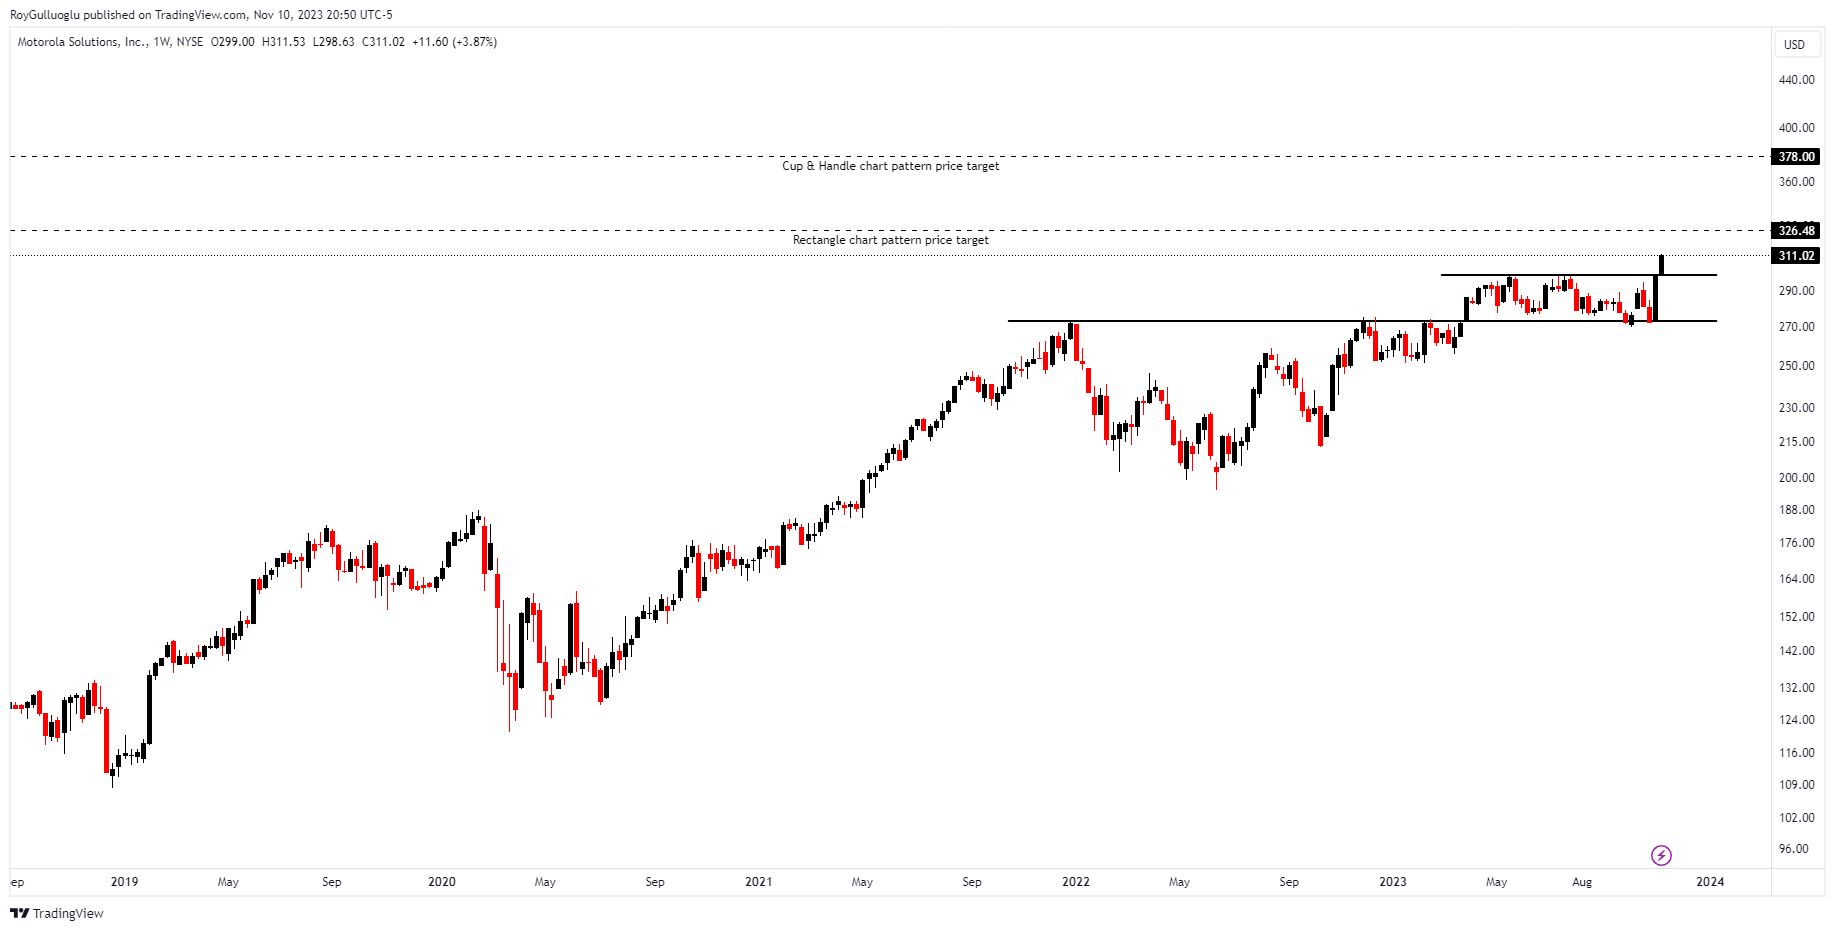
You can click the MSI ticker above to access the first report explaining the RATIONALE behind the trade idea.
Empire Co Ltd-(EMP.A/TSX) - Long Idea
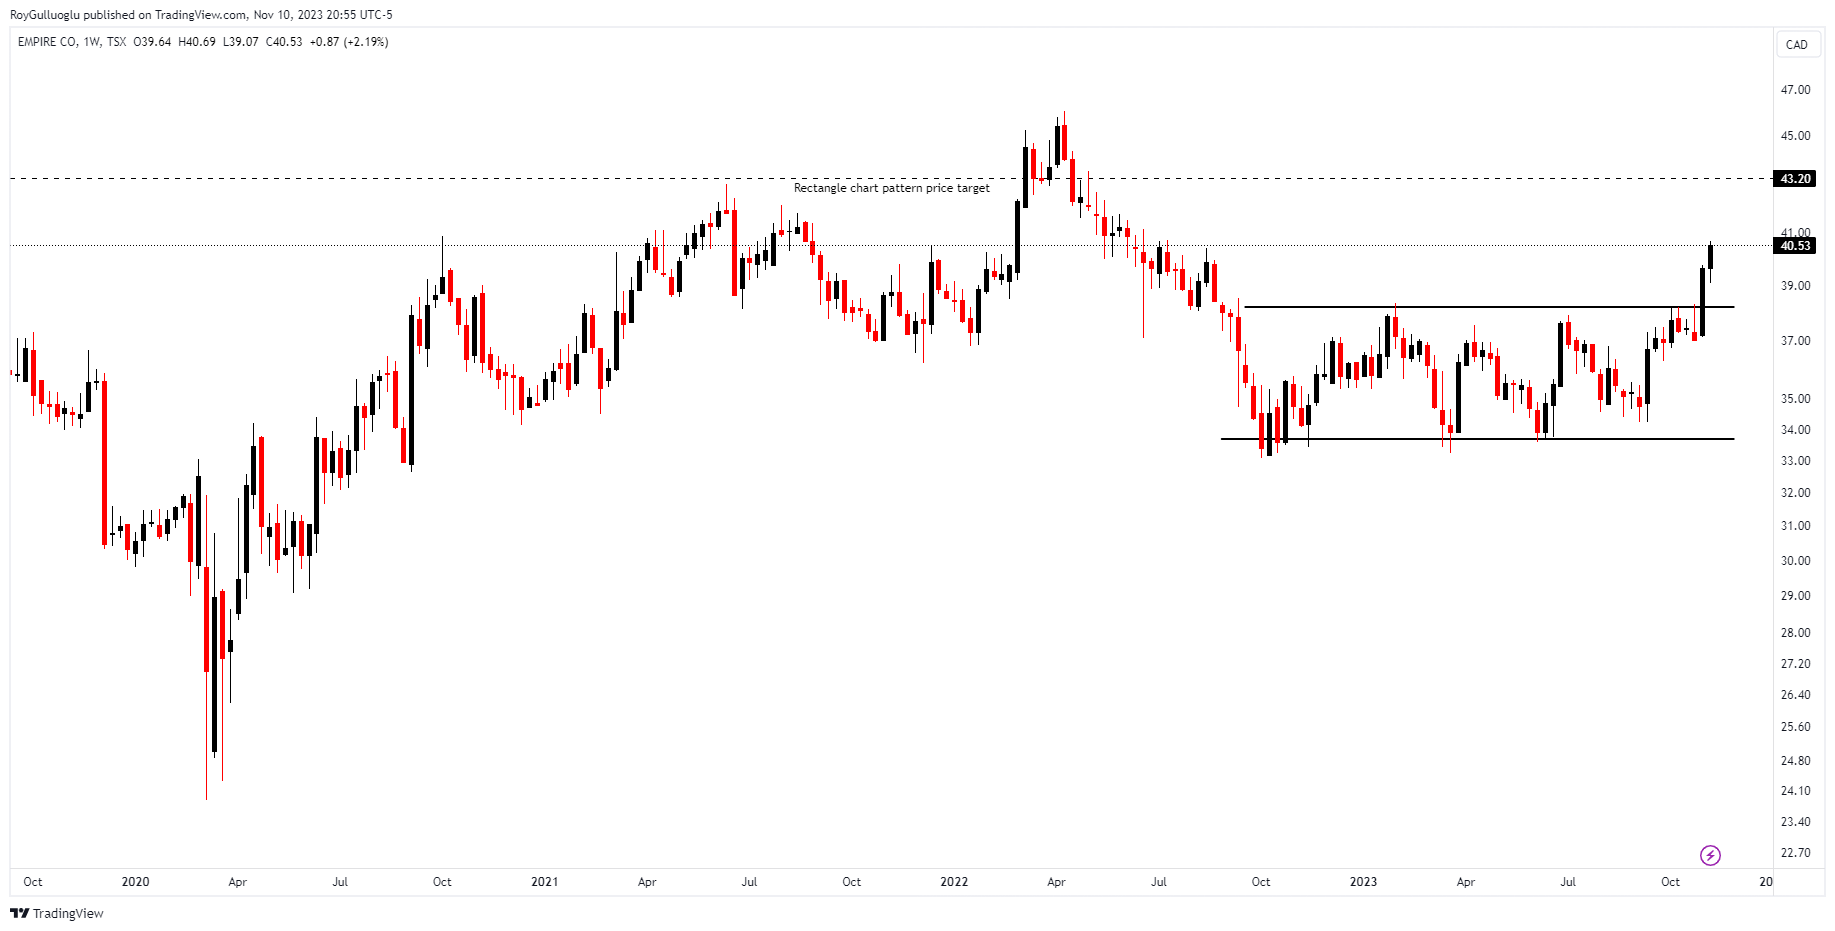
You can click the EMP. A ticker above to access the first report explaining the RATIONALE behind the trade idea.