


Bread Financial Holdings, Inc.-(BFH/NYSE)-Long Idea
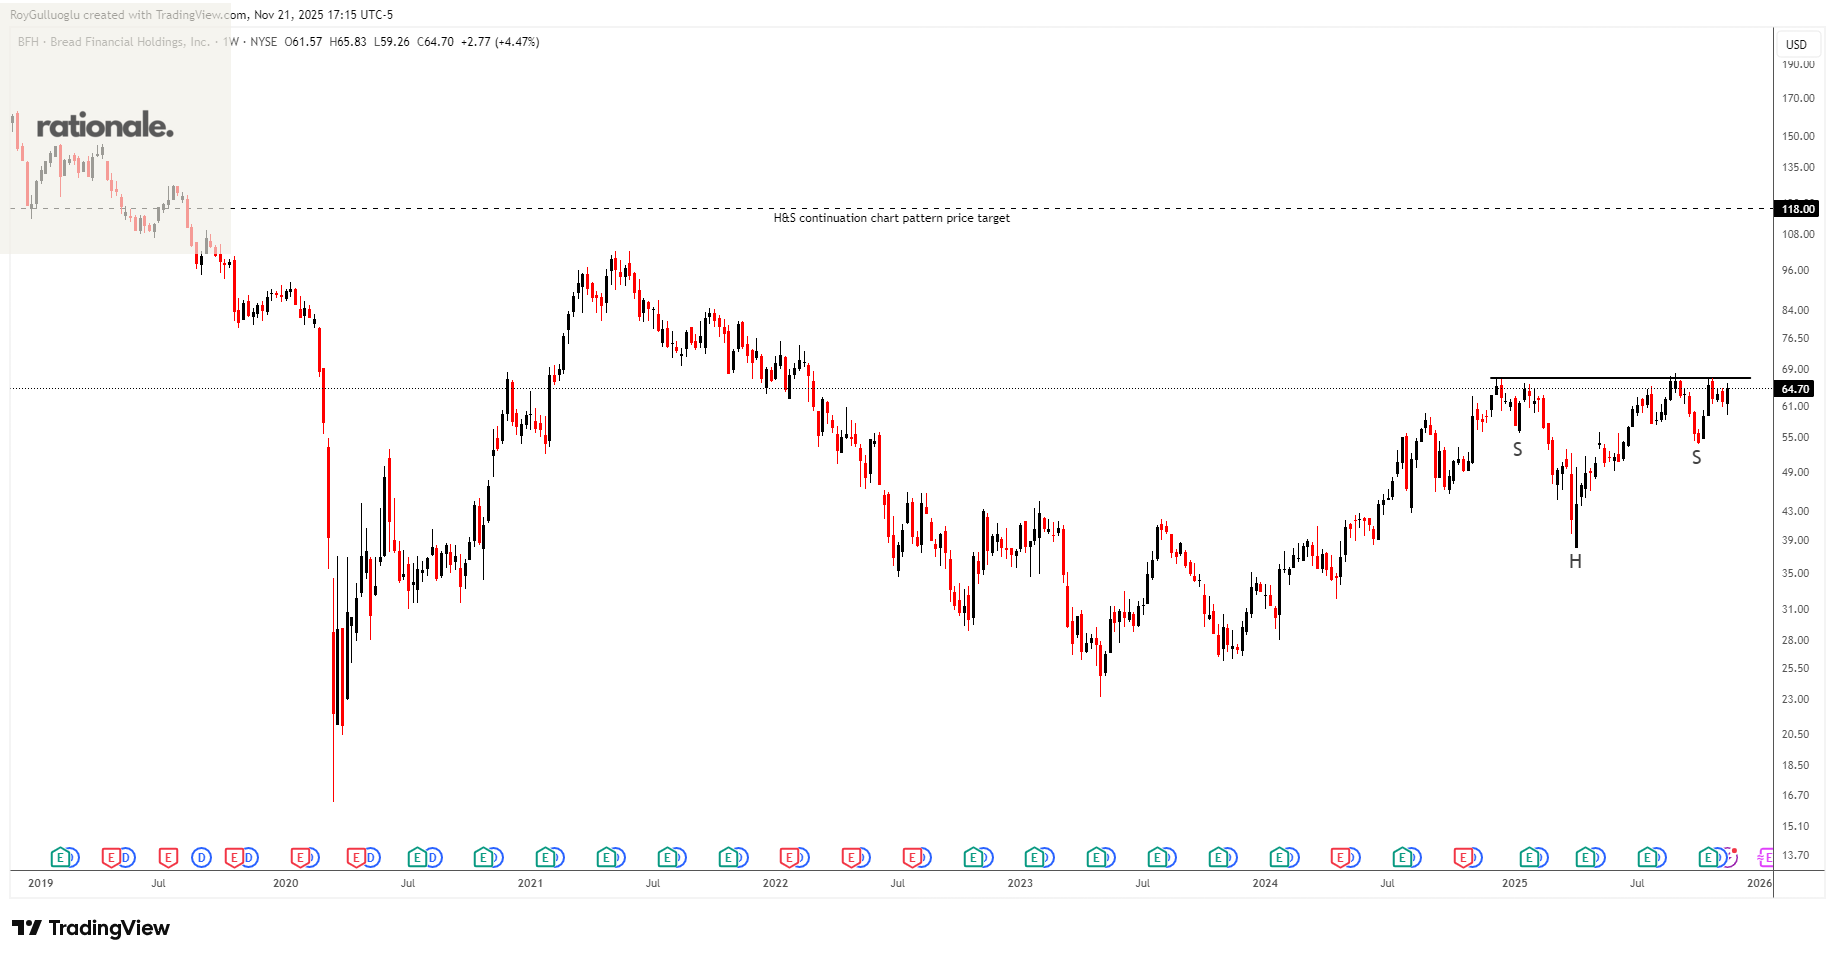
Bread Financial Holdings, Inc. provides tech-forward payment and lending solutions to customers and consumer-based industries in North America.
The above weekly chart formed an approximately 12-month-long H&S continuation chart pattern as a bullish continuation after an uptrend.
The horizontal boundary at 67.04 levels acts as a resistance within this pattern.
A daily close above 69.05levels would validate the breakout from the 12-month-long H&S continuation chart pattern.
Based on this chart pattern, the potential price target is 118 levels.
Suncor Energy Inc.-(SU/NYSE)-Long Idea
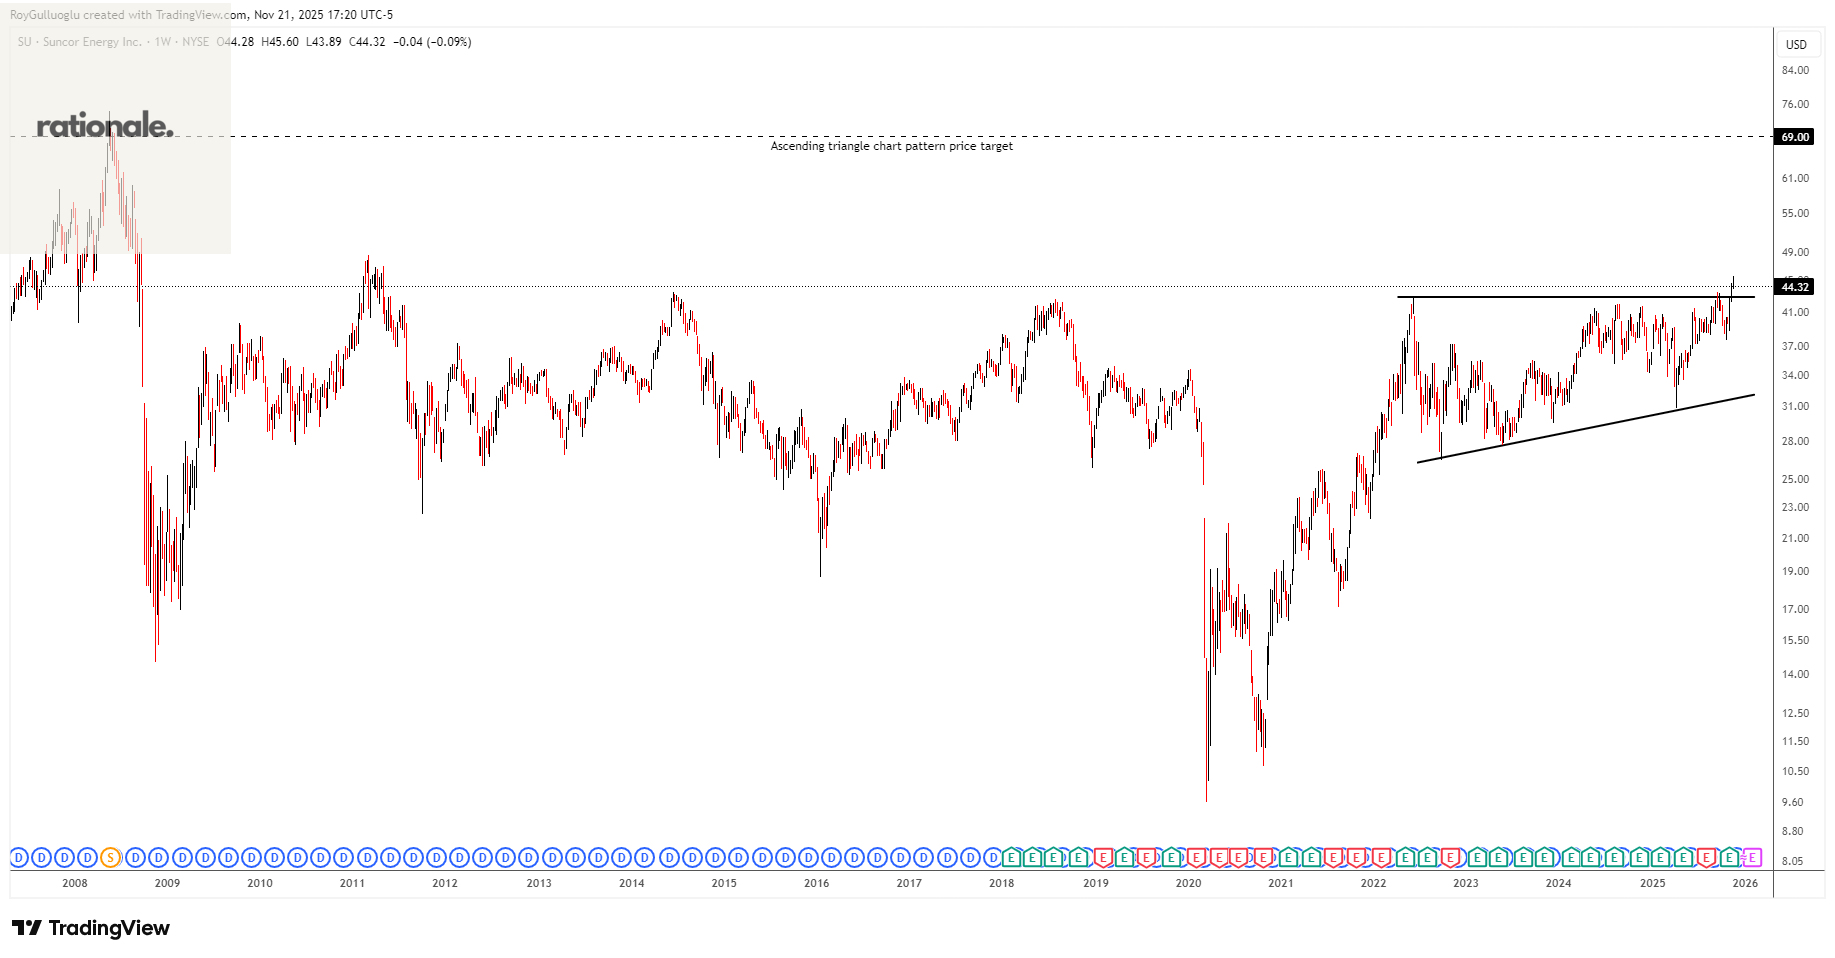
Suncor Energy Inc. operates as an integrated energy company in Canada, the United States, and internationally.
The above weekly chart formed an approximately 44-month-long ascending triangle chart pattern as a bullish continuation after an uptrend.
The horizontal boundary at 42.89 levels acted as a resistance within this pattern.
A daily close above 44.17 levels validated the breakout from the 44-month-long ascending triangle chart pattern.
Based on this chart pattern, the potential price target is 69 levels.
Hilton Worldwide Holdings Inc.-(HLT/NYSE)-Long Idea
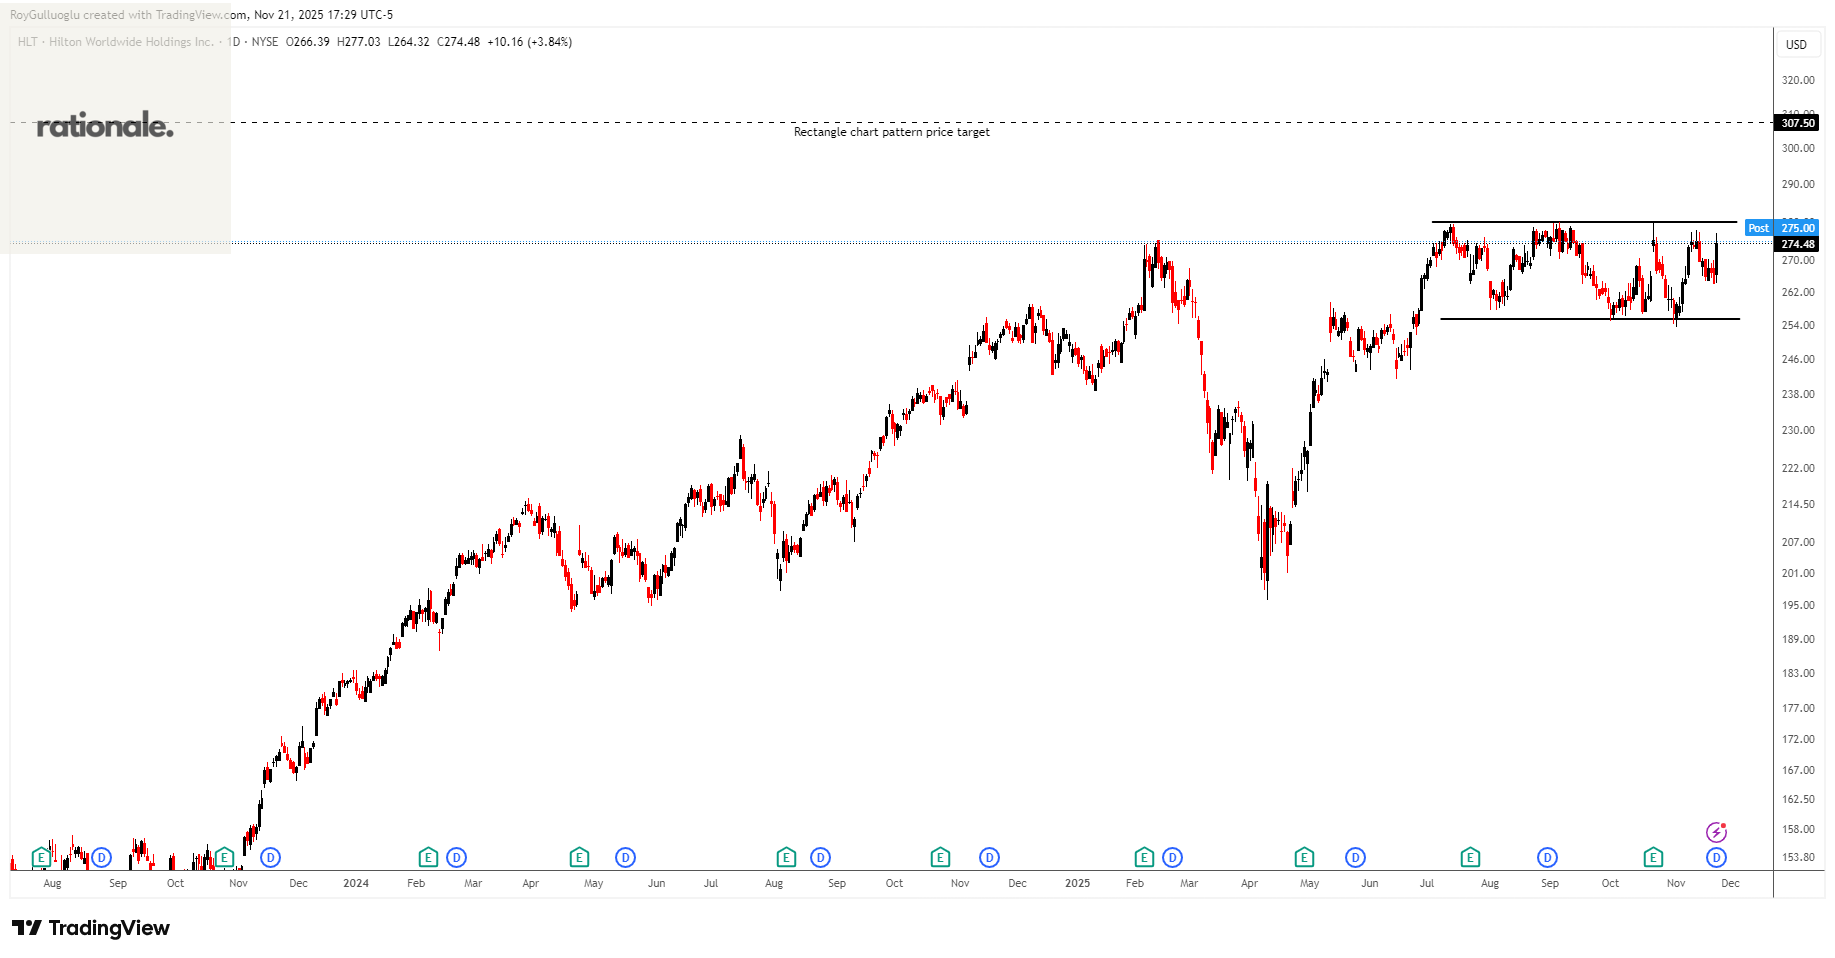
Hilton Worldwide Holdings Inc., a hospitality company, engages in managing, franchising, owning, and leasing hotels and resorts.
The above daily chart formed an approximately 3-month-long rectangle chart pattern as a bullish continuation after an uptrend.
The horizontal boundary at 279.78 levels acts as a resistance within this pattern.
A daily close above 288.17 levels would validate the breakout from the 3-month-long rectangle chart pattern.
Based on this chart pattern, the potential price target is 307.5 levels.
STERIS plc-(STE/NYSE)-Long Idea
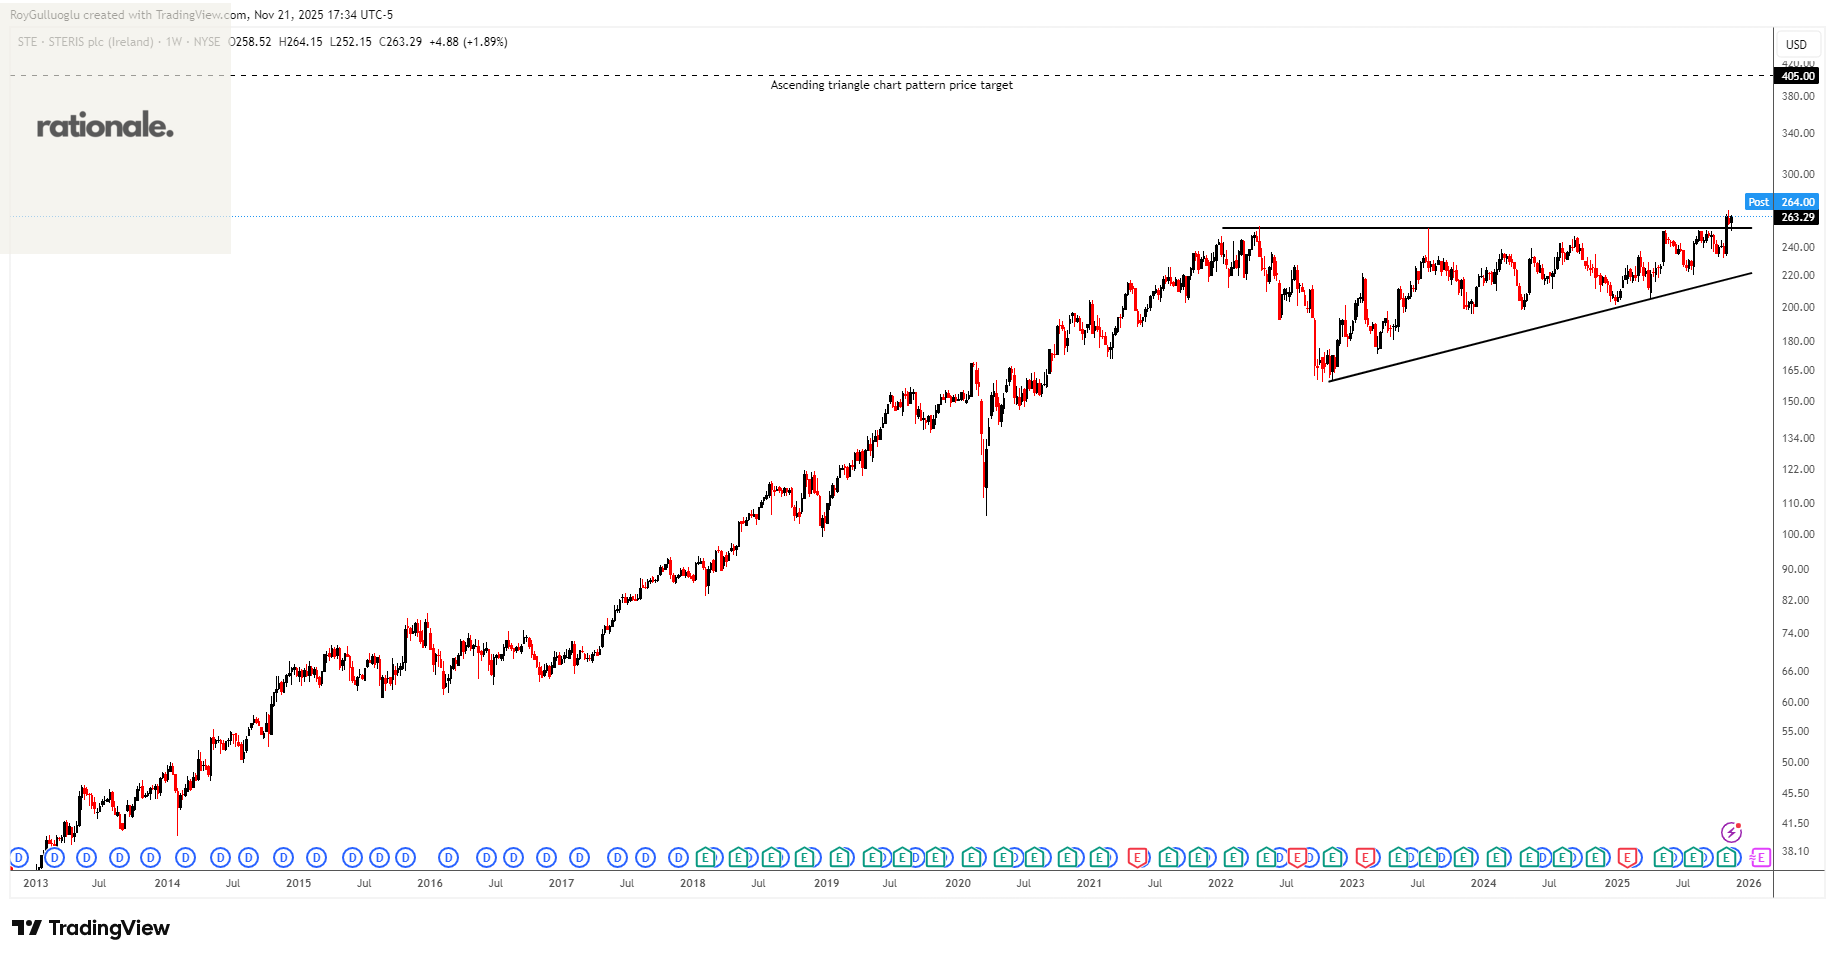
STERIS plc provides infection prevention products and services worldwide.
The above daily chart formed an approximately 45-month-long ascending triangle chart pattern as a bullish continuation after an uptrend.
The horizontal boundary at 253.98 levels acted as a resistance within this pattern.
A daily close below 261.6 levels validated the breakout from the 45-month-long ascending triangle chart pattern.
Based on this chart pattern, the potential price target is 405 levels.
Hilltop Holdings Inc.-(HTH/NYSE)-Long Idea
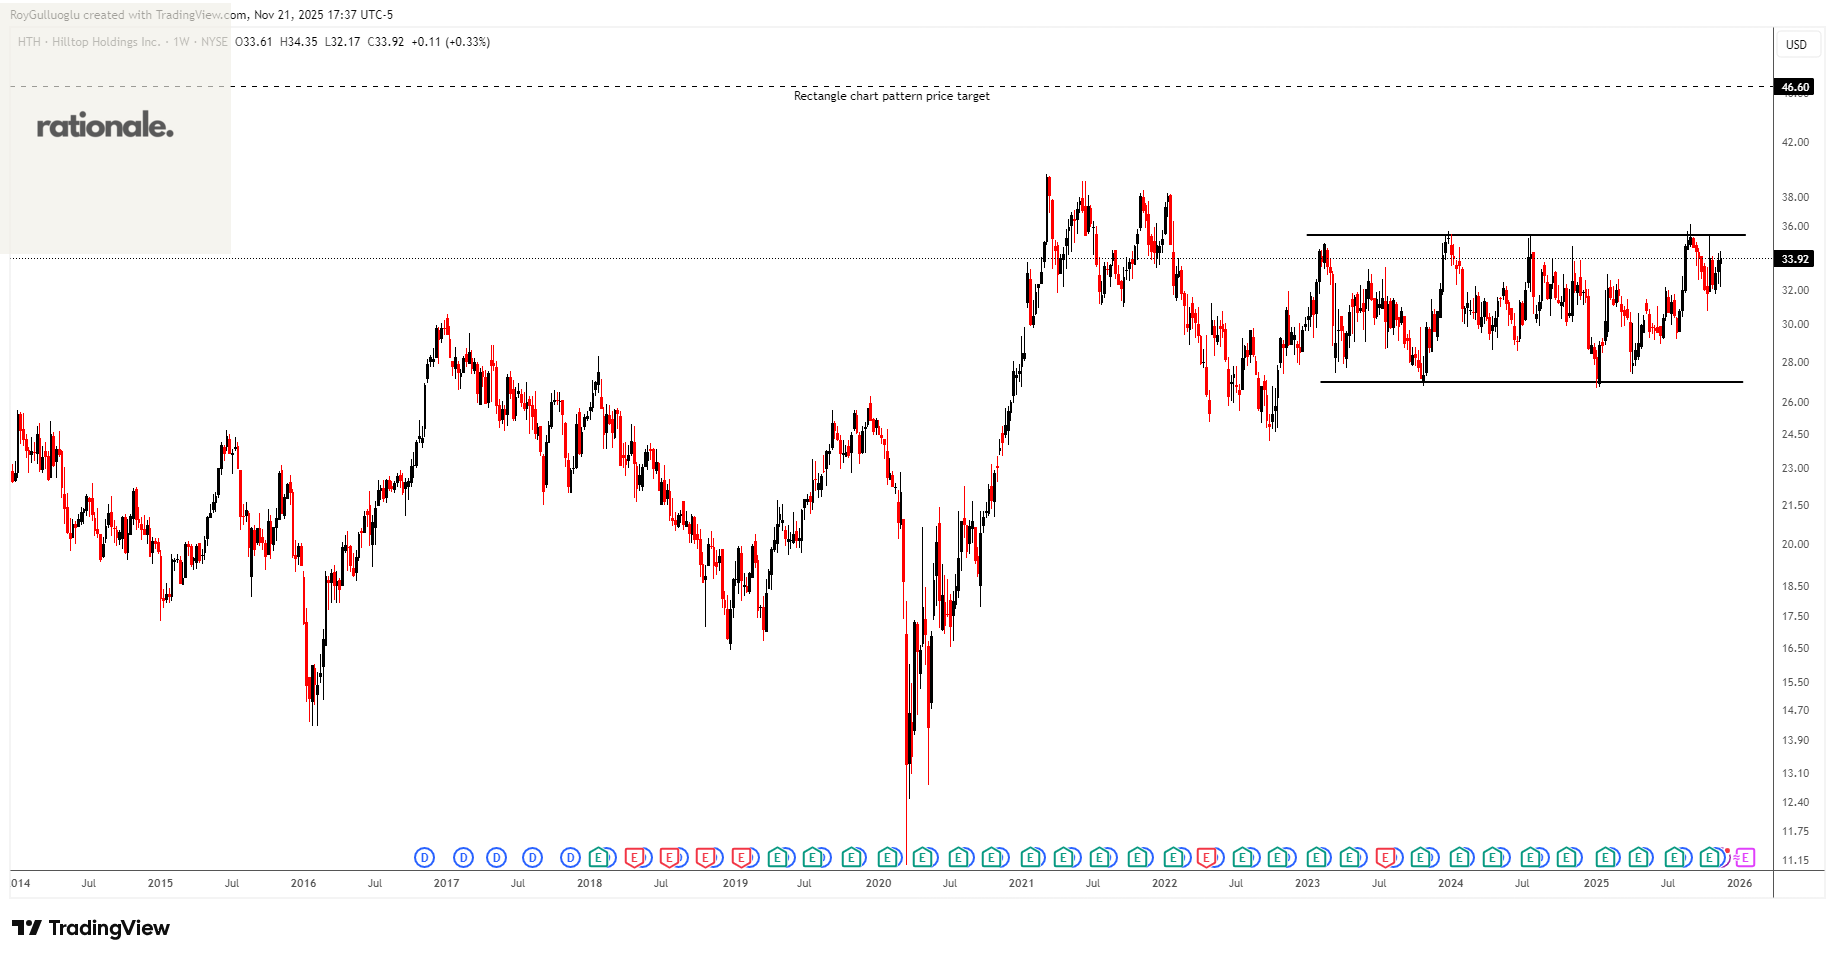
Hilltop Holdings Inc. provides business and consumer banking services.
The above daily chart formed an approximately 5-month-long rectangle chart pattern as a bullish continuation after an uptrend.
The horizontal boundary at 35.38 levels acts as a resistance within this pattern.
A daily close above 36.44 levels would validate the breakout from the 5-month-long rectangle chart pattern.
Based on this chart pattern, the potential price target is 46.6 levels.