

Trade Ideas Equities
TBBB(NYSE), BROS(NYSE), INTC(NASDAQ), AMT(NYSE), AKSA(BIST), MTY(TSX), MAU(TSX), 8316(TSE)

BBB Foods Inc.-(TBBB/NYSE)-Long Idea
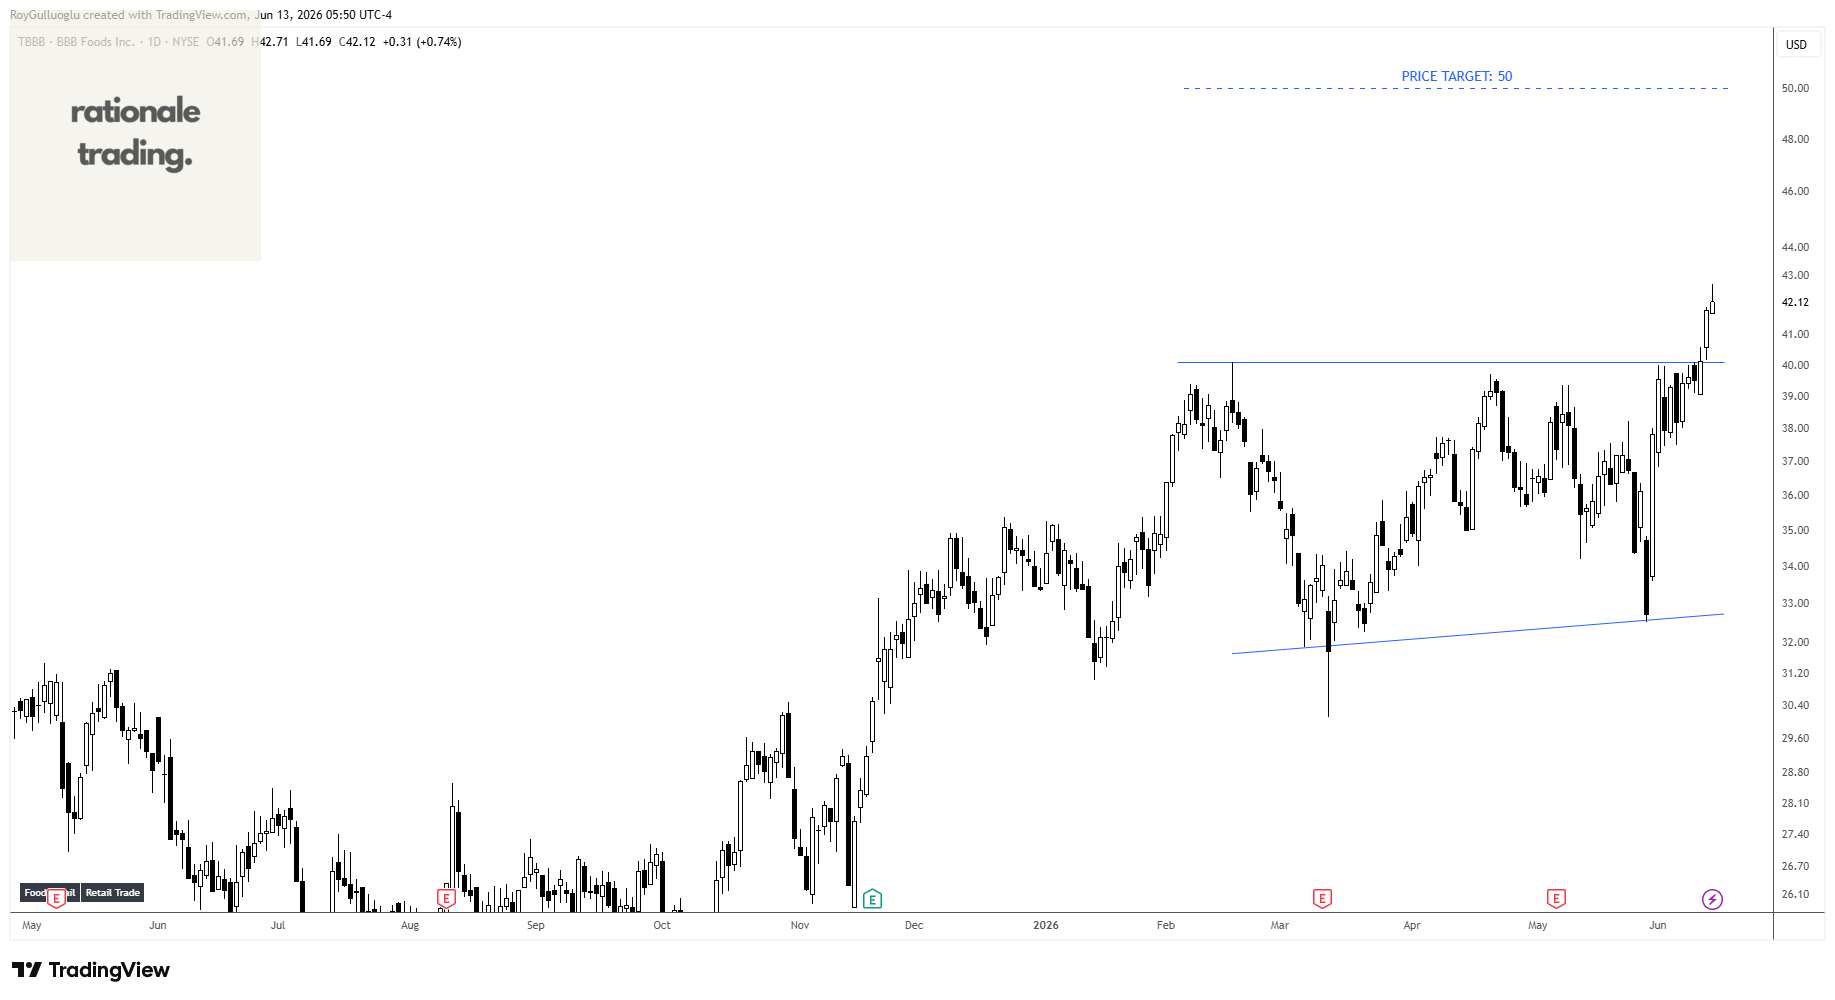
BBB Foods Inc., through its subsidiaries, operates a chain of grocery retail stores in Mexico.
The above daily chart formed an approximately 3-month-long ascending triangle chart pattern as a bullish continuation after an uptrend.
The horizontal boundary at 40 levels acted as a resistance within this pattern.
A daily close above 41.2 levels validated the breakout from the 3-month-long ascending triangle chart pattern.
Based on this chart pattern, the potential price target is 50 levels.
Dutch Bros Inc.-(BROS/NYSE)-Long Idea
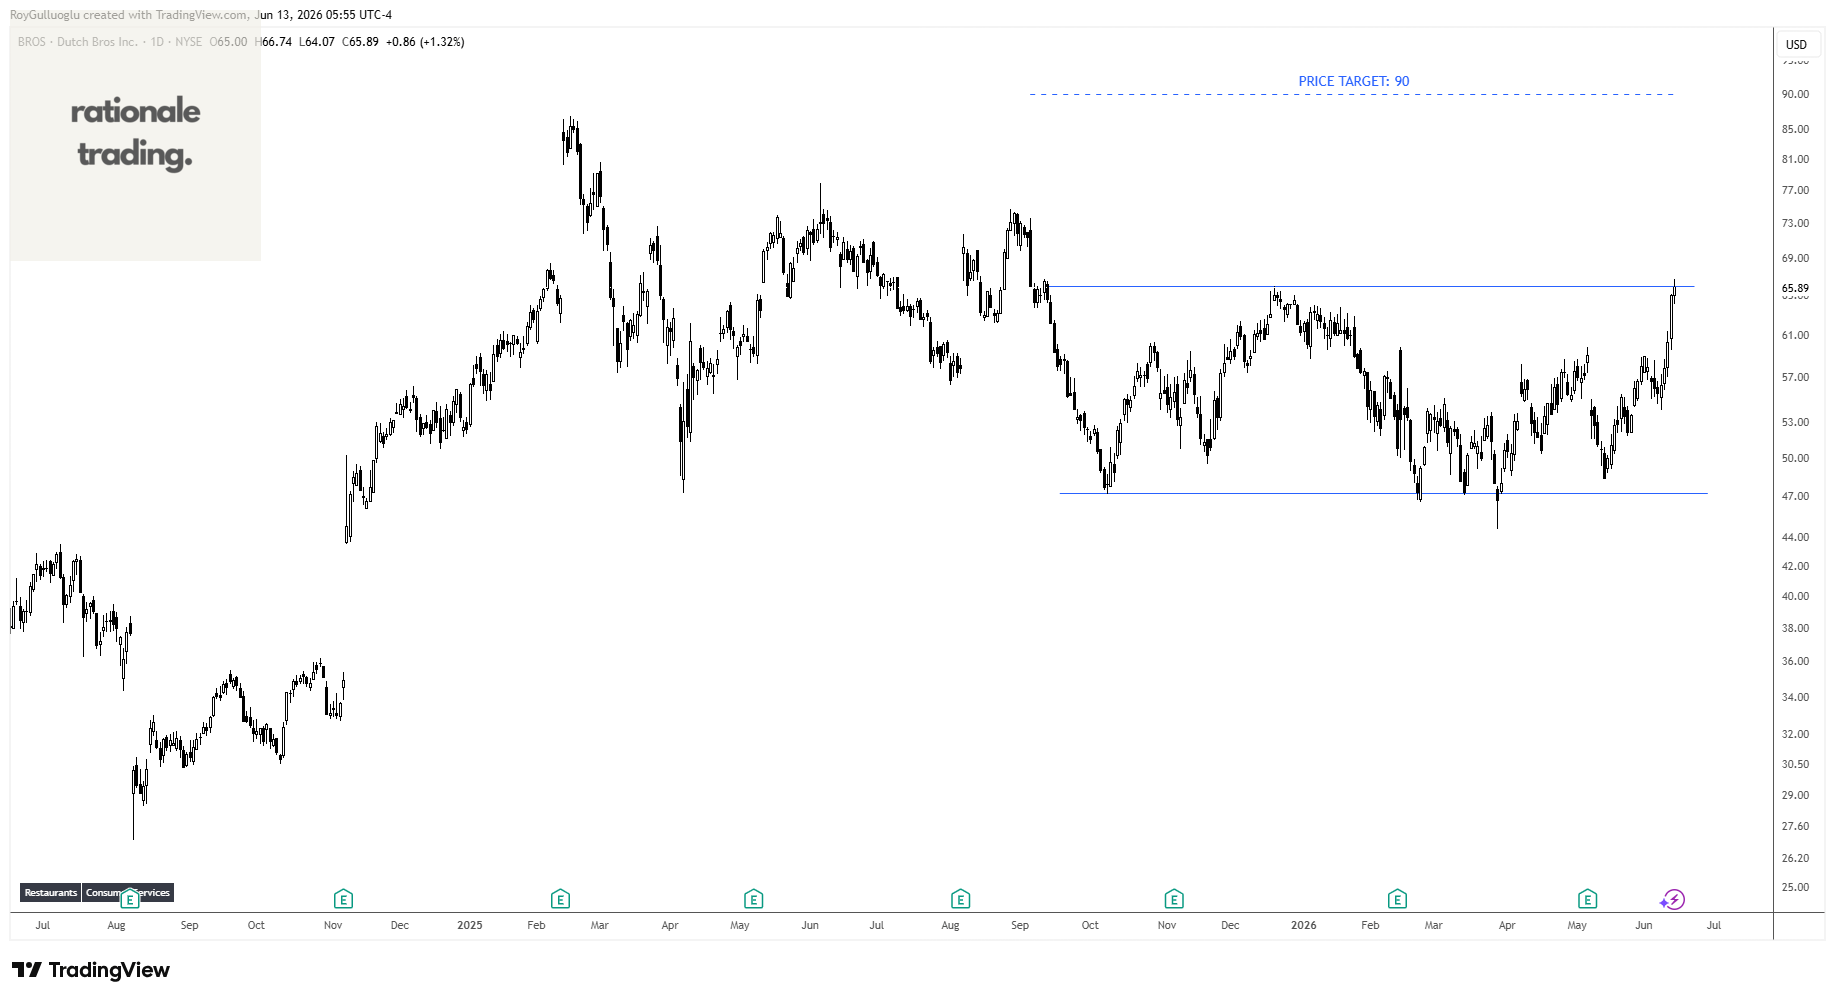
Dutch Bros Inc., together with its subsidiaries, operates and franchises drive-thru shops in the United States.
The above daily chart formed an approximately 6-month-long rectangle chart pattern as a bullish reversal after a downtrend.
The horizontal boundary at 65.93 levels acts as a resistance within this pattern.
A daily close above 67.9 levels would validate the breakout from the 6-month-long rectangle chart pattern.
Based on this chart pattern, the potential price target is 90 levels.
Intel Corporation-(INTC/NASDAQ)-Long Idea
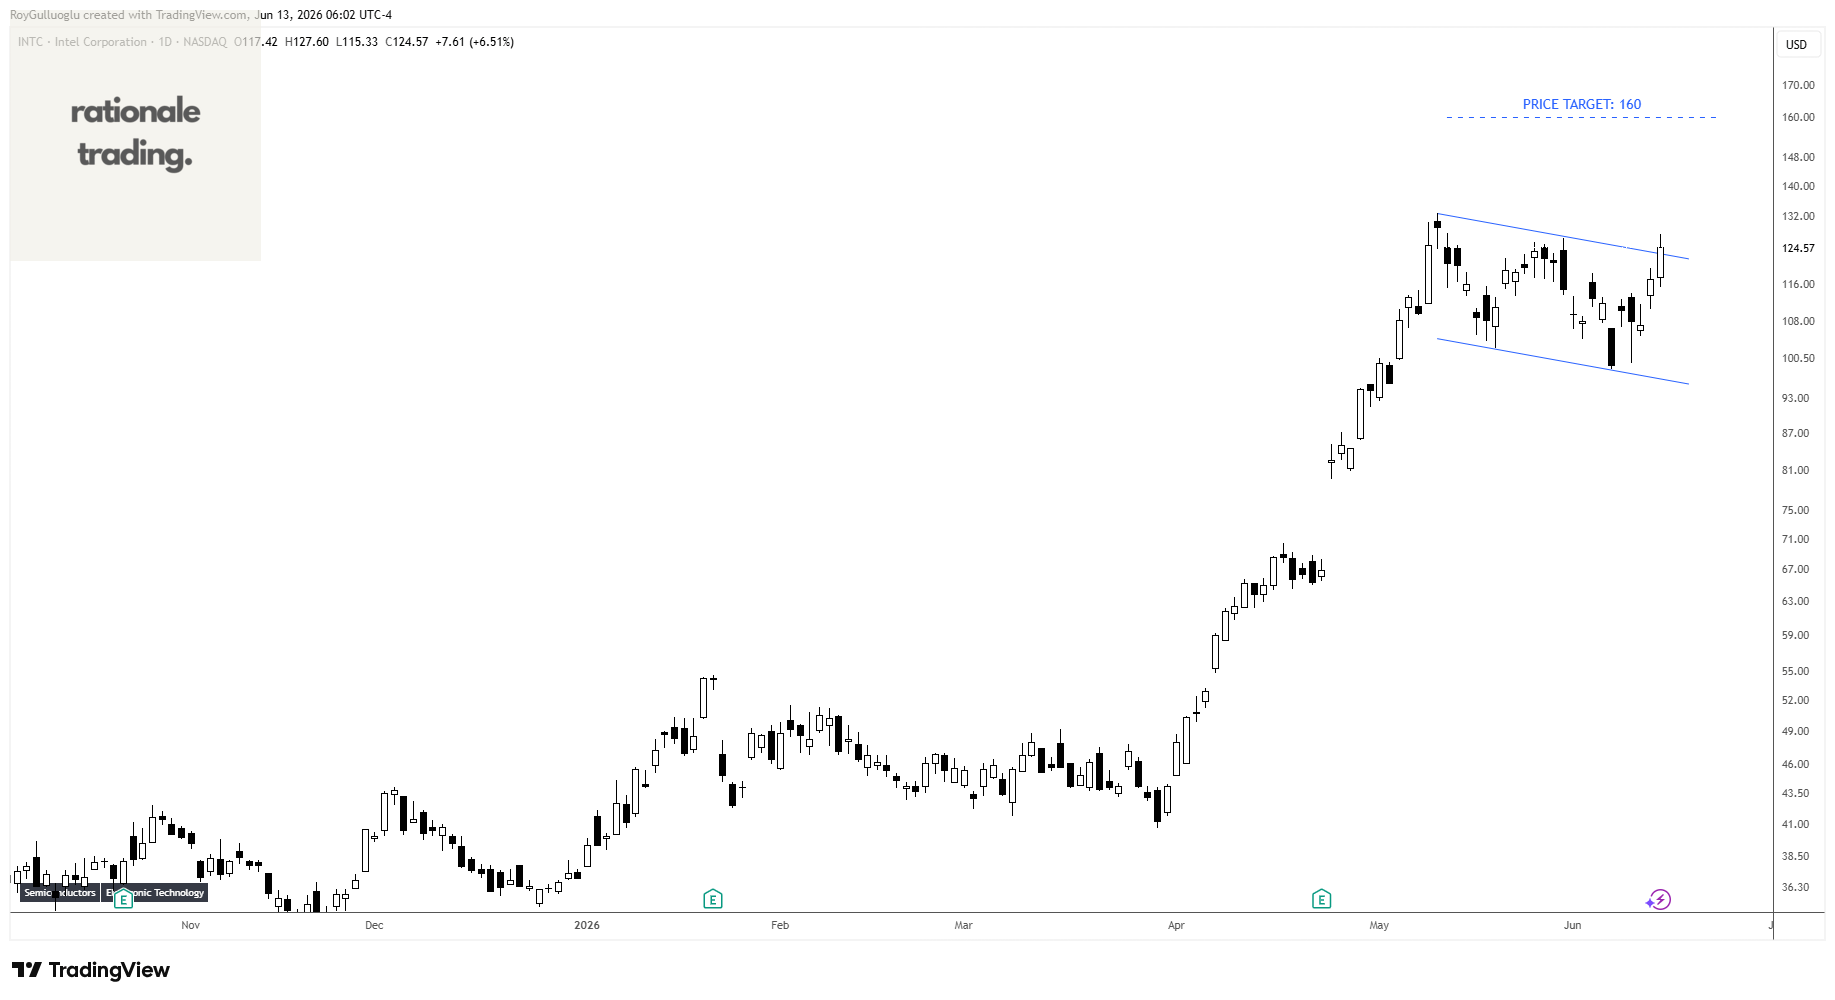
Intel Corporation designs, develops, manufactures, markets, sells, and services computing and related end products and services in the United States, Ireland, Israel, and internationally.
The above daily chart formed an approximately 1-month-long bull flag chart pattern as a bullish continuation after an uptrend.
A daily close above 128 levels would validate the breakout from the 1-month-long bull flag chart pattern.
Based on this chart pattern, the potential price target is 160 levels.
American Tower Corporation-(AMT/NYSE)-Long Idea
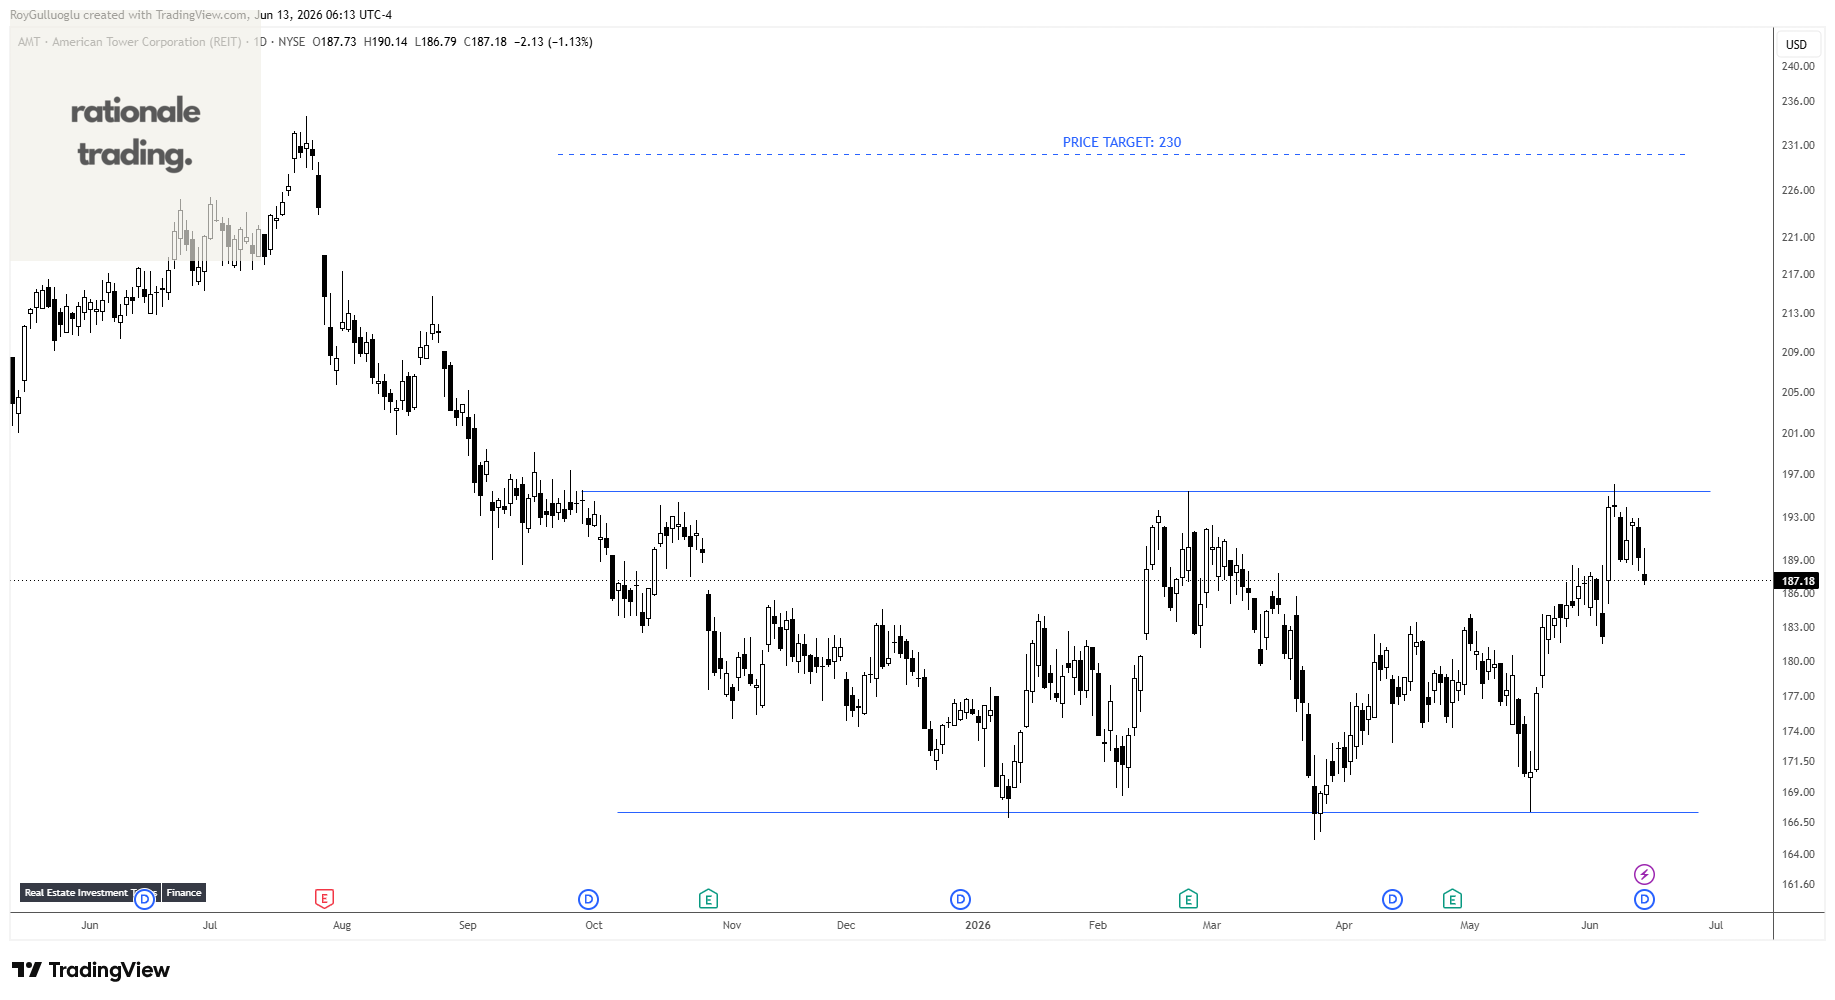
American Tower Corporation is one of the largest global real estate investment trusts. It is a leading independent owner, operator and developer of multitenant communications real estate.
The above daily chart formed an approximately 6-month-long rectangle chart pattern as a bullish reversal after a downtrend.
The horizontal boundary at 195.45 levels acts as a resistance within this pattern.
A daily close above 201.3 levels would validate the breakout from the 6-month-long rectangle chart pattern.
Based on this chart pattern, the potential price target is 230 levels.
Aksa Akrilik Kimya Sanayii A.S.-(AKSA/BIST)-Long Idea
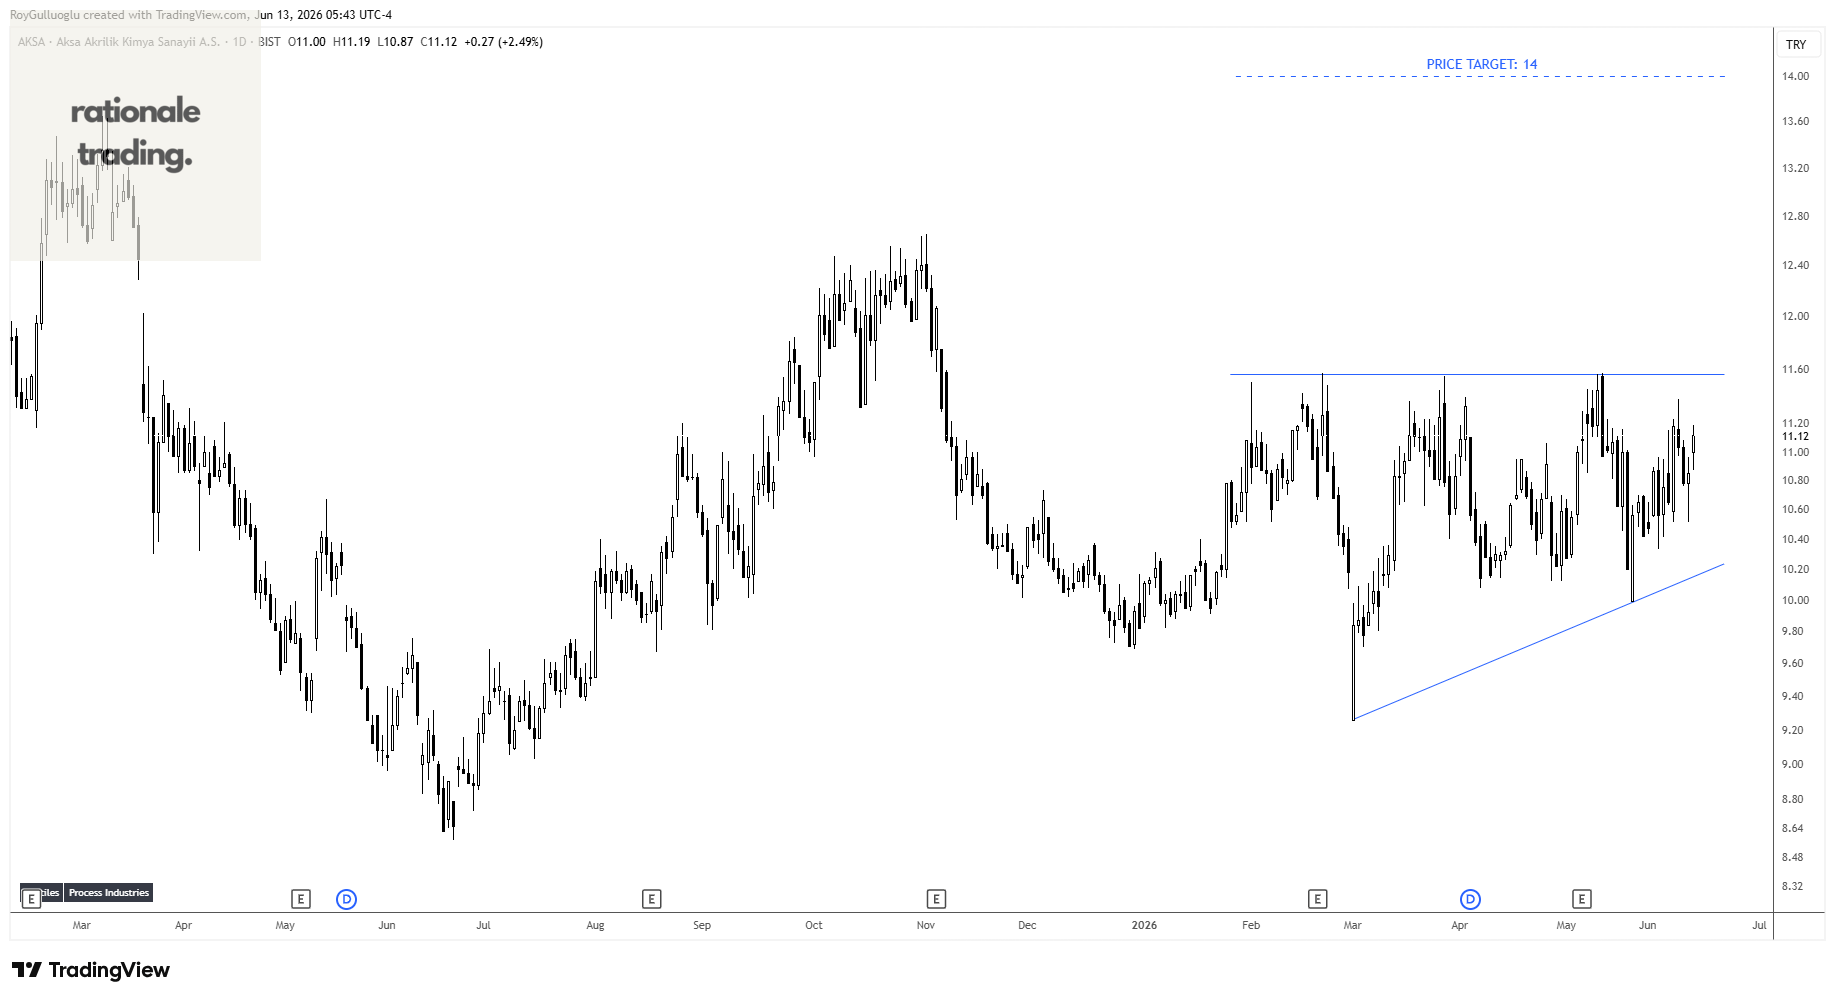
Aksa Akrilik Kimya Sanayii A.S., together with its subsidiaries, manufactures and sells textiles, chemicals, and other industrial products in Turkey and internationally.
The above daily chart formed an approximately 3-month-long ascending triangle chart pattern as a bullish reversal after a downtrend.
The horizontal boundary at 11.56 levels acts as a resistance within this pattern.
A daily close above 11.9 levels would validate the breakout from the 3-month-long ascending triangle chart pattern.
Based on this chart pattern, the potential price target is 14 levels.
MTY Food Group Inc.-(MTY/TSX)-Long Idea
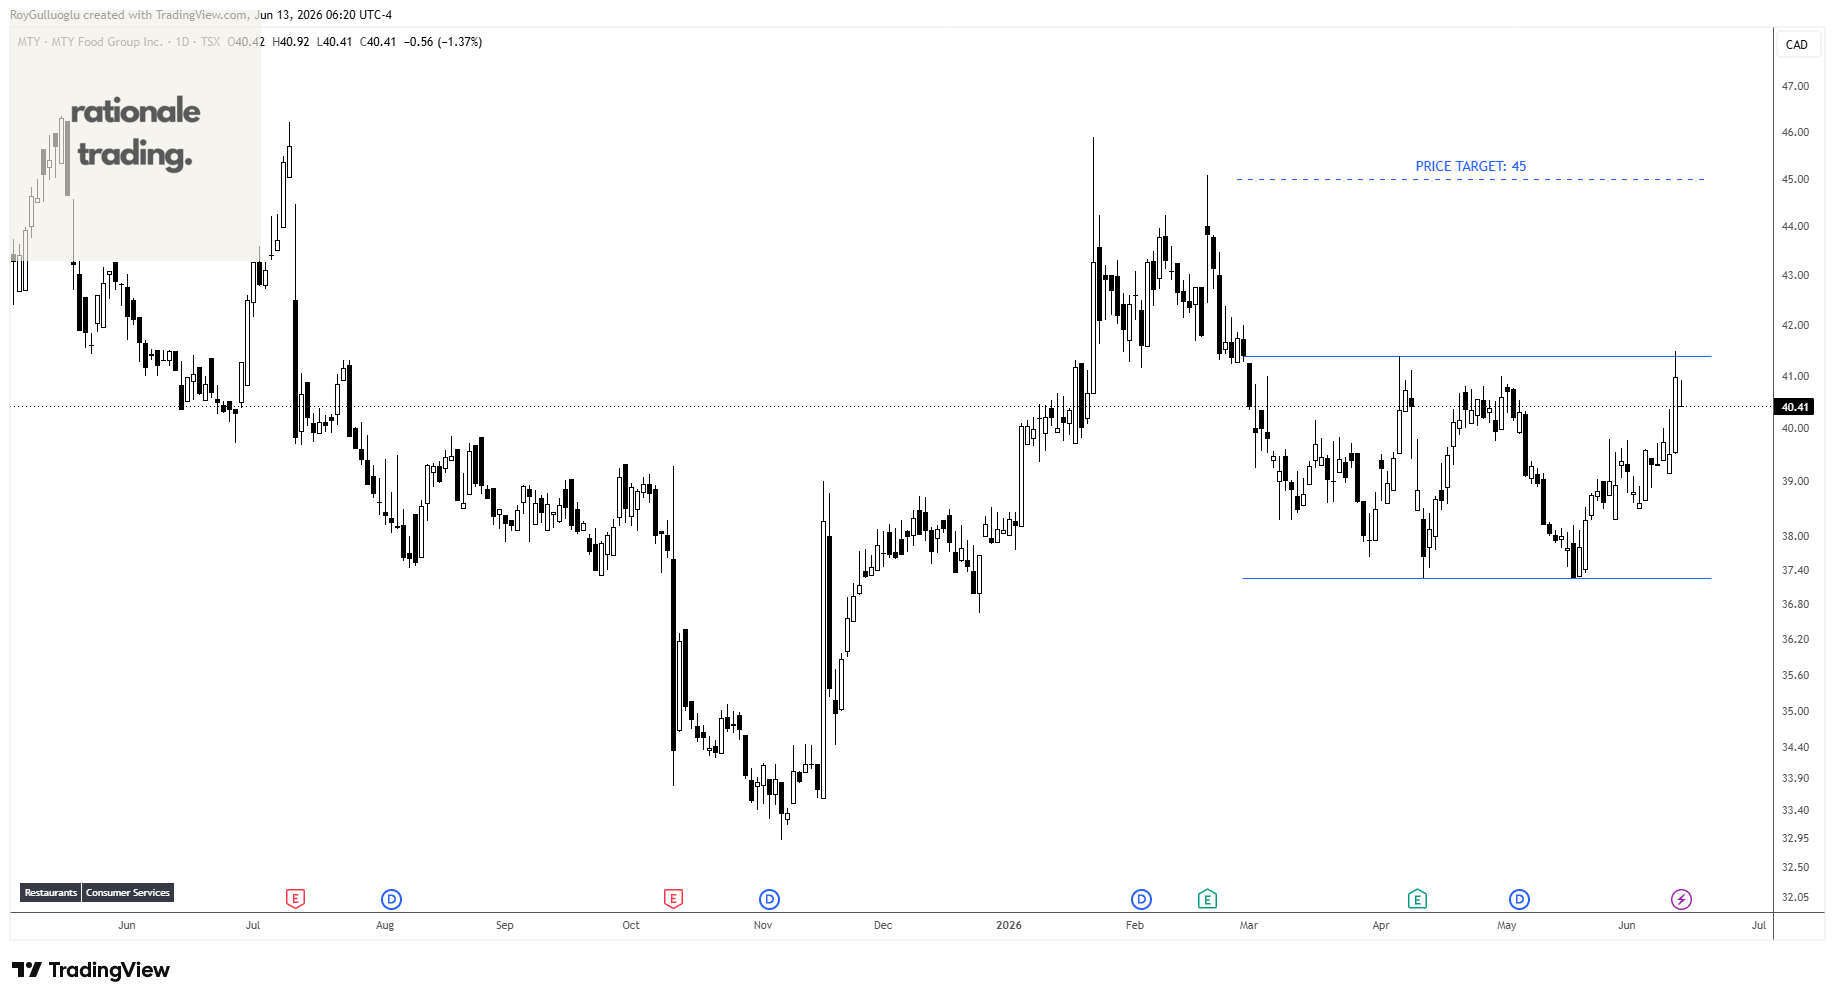
MTY Food Group Inc., together with its subsidiaries, franchises and operates quick-service, fast-casual, and casual dining restaurants in Canada, the United States, and internationally.
The above daily chart formed an approximately 2-month-long rectangle chart pattern as a bullish reversal after a downtrend.
The horizontal boundary at 41.39 levels acts as a resistance within this pattern.
A daily close above 42 levels would validate the breakout from the 2-month-long rectangle chart pattern.
Based on this chart pattern, the potential price target is 45 levels.
Montage Gold Corp.-(MAU/TSX)-Long Idea
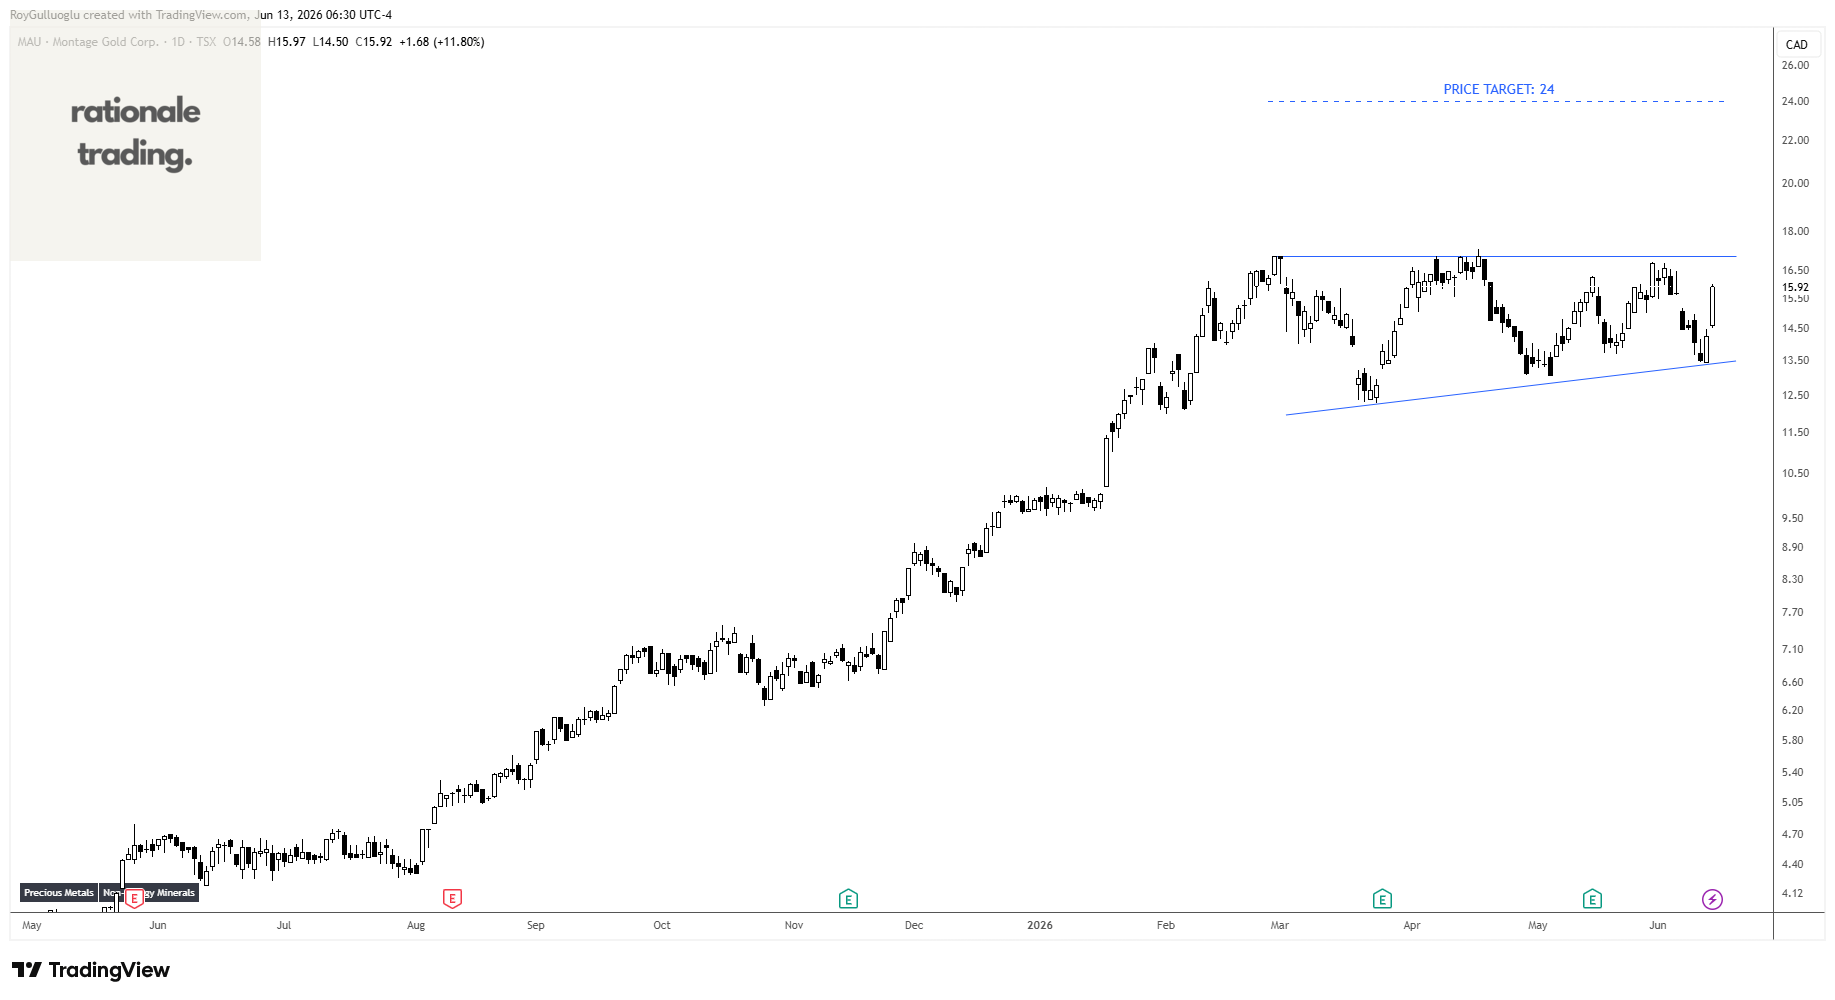
Montage Gold Corp. engages in the acquisition, exploration, and development of mineral properties in Africa.
The above daily chart formed an approximately 2-month-long ascending triangle chart pattern as a bullish continuation after an uptrend.
The horizontal boundary at 17 levels acts as a resistance within this pattern.
A daily close above 17.5 levels would validate the breakout from the 2-month-long ascending triangle chart pattern.
Based on this chart pattern, the potential price target is 24 levels.
Sumitomo Mitsui Financial Group, Inc.-(8316/TSE)-Long Idea
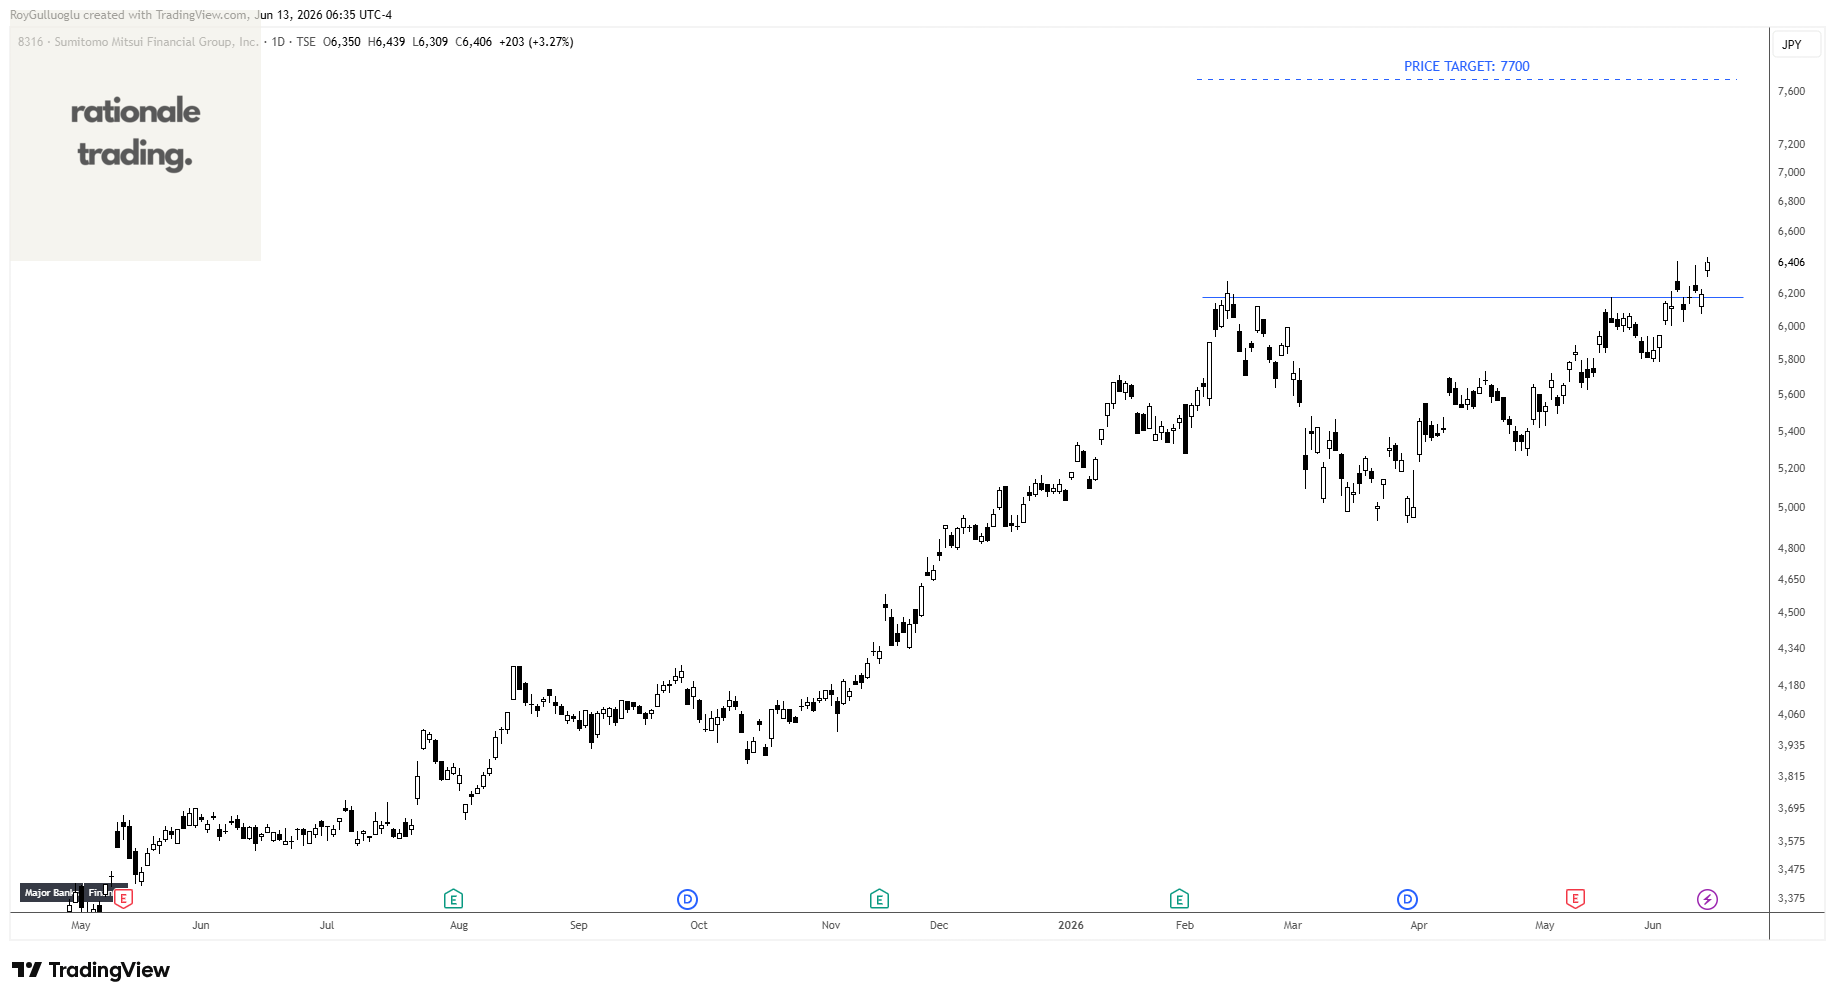
Sumitomo Mitsui Financial Group, Inc., together with its subsidiaries, provides banking, leasing, securities, consumer finance, and other services in Japan, the Americas, Europe, the Middle East, Asia, and Oceania.
The above daily chart formed an approximately 2-month-long cup & handle chart pattern as a bullish continuation after an uptrend.
The horizontal boundary at 6183 levels acted as a resistance within this pattern.
A daily close above 6370 levels validated the breakout from the 2-month-long cup & handle chart pattern.
Based on this chart pattern, the potential price target is 7700 levels.