


New setups
TICKERS: RGCO(NASDAQ), AFL(NYSE), DHI(NYSE), APO(NYSE), SYM(NASDAQ), CNA(NYSE), NBIX(NASDAQ), 7543(TSE)
RGC Resources, Inc.-(RGCO/NASDAQ)-Long Idea
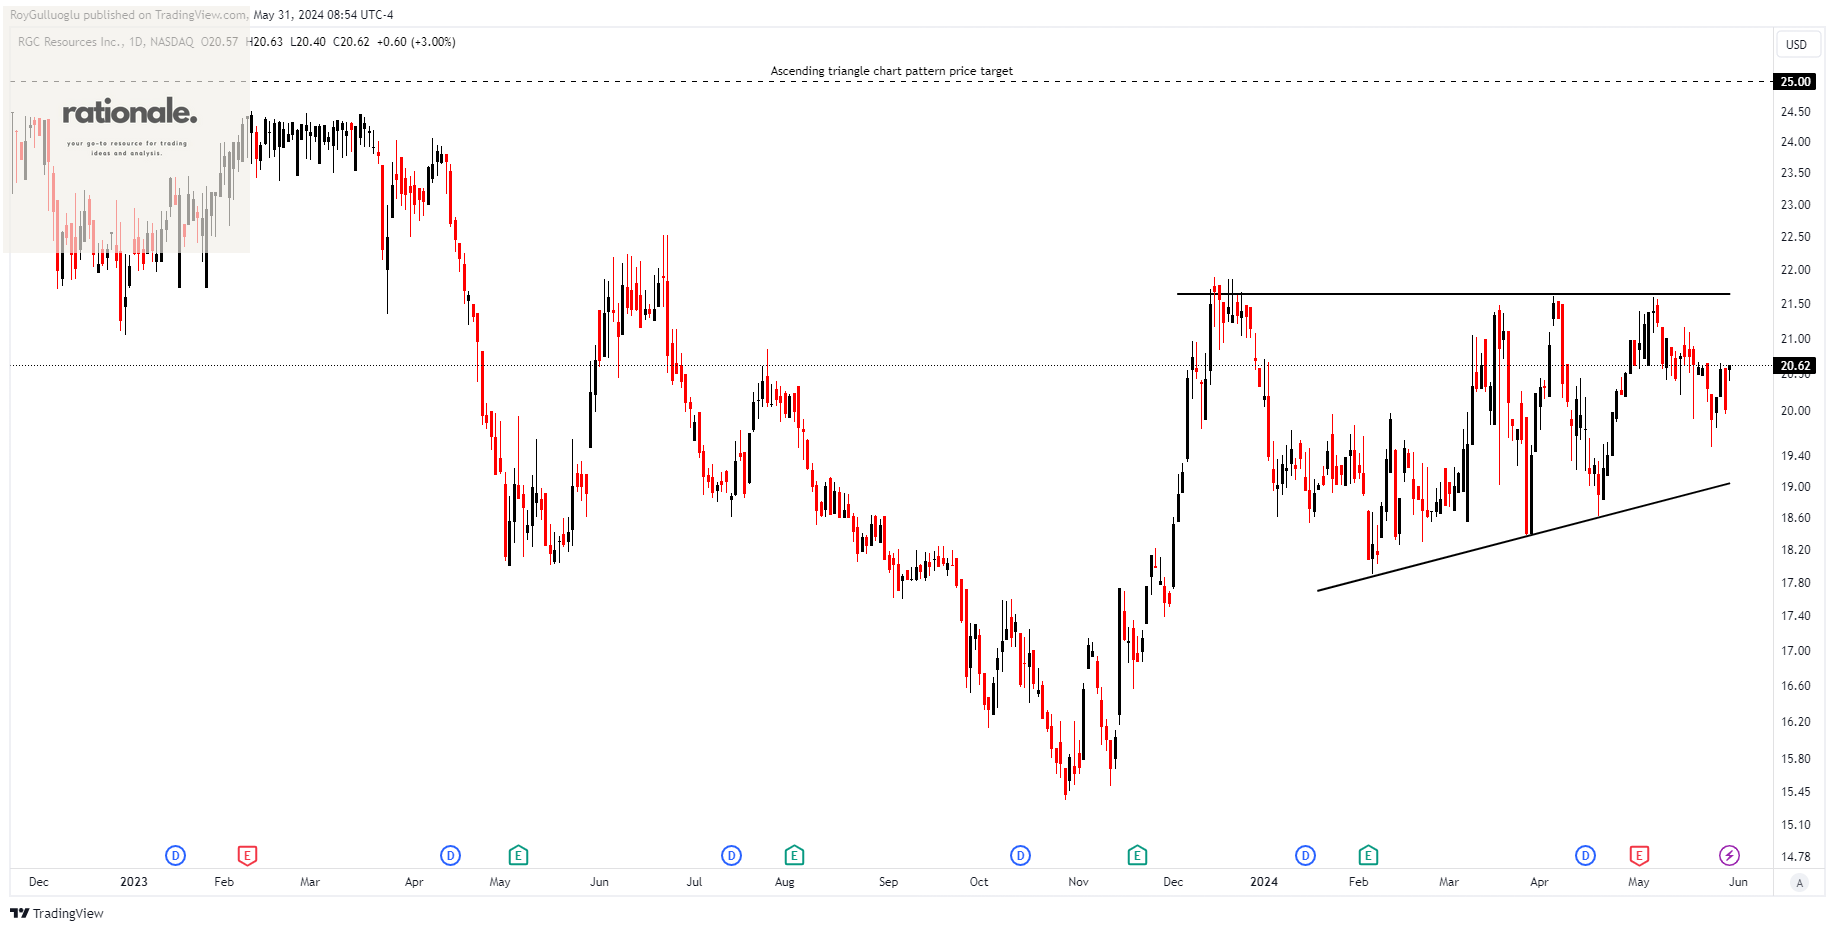
RGC Resources, Inc., along with its subsidiaries, functions as an energy services company. It provides and delivers natural gas to residential, commercial, and industrial customers in Roanoke, Virginia, and the neighboring areas.
The above daily chart formed an approximately 4-month-long ascending triangle chart pattern as a bullish continuation after an uptrend.
The horizontal boundary at 21.65 levels acts as a resistance within this pattern.
A daily close above 22.3 levels would validate the breakout from the 4-month-long ascending triangle chart pattern.
Based on this chart pattern, the potential price target is 25 levels.
RGCO, classified under the "utilities" sector, falls under the “Small Cap - Income” stock category.
Aflac Incorporated-(AFL/NYSE)-Long Idea
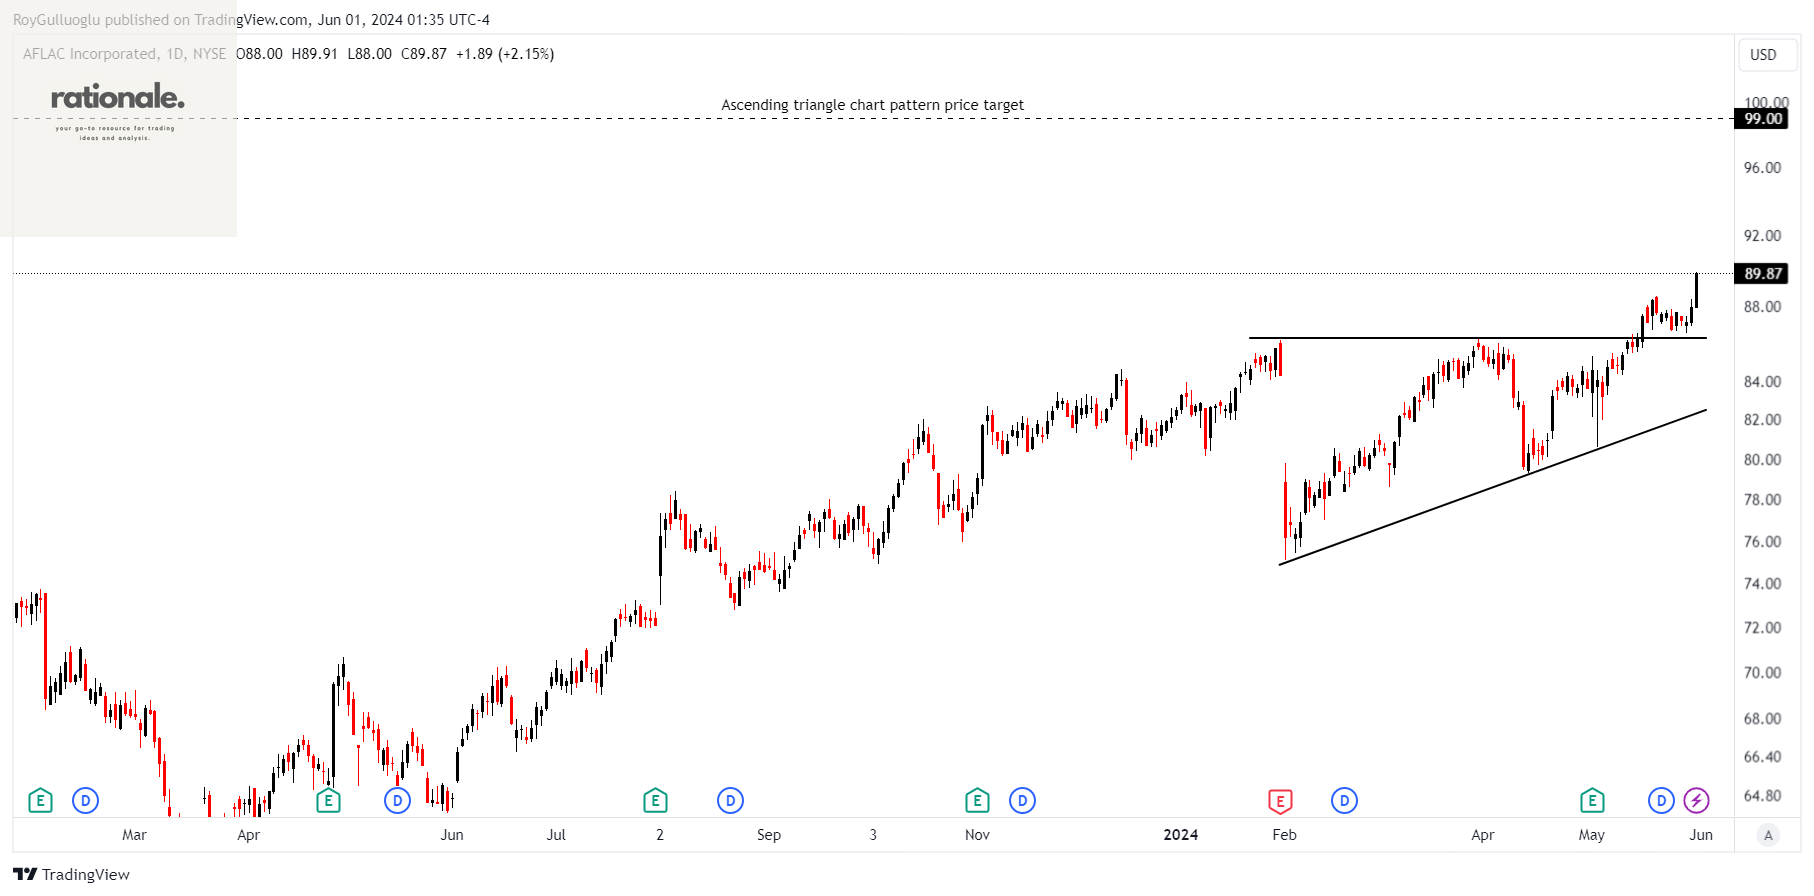
Aflac Incorporated, via its subsidiaries, offers supplemental health and life insurance products. The company functions through two segments: Aflac Japan and Aflac U.S.
The above daily chart formed an approximately 3-month-long ascending triangle chart pattern as a bullish continuation after an uptrend.
The horizontal boundary at 86.28 levels acted as a resistance within this pattern.
A daily close above 88.86 levels validated the breakout from the 3-month-long ascending triangle chart pattern.
Based on this chart pattern, the potential price target is 99 levels.
AFL, classified under the "financial services" sector, falls under the “Large Cap - Income” stock category.
D.R. Horton, Inc.-(DHI/NYSE)-Long Idea
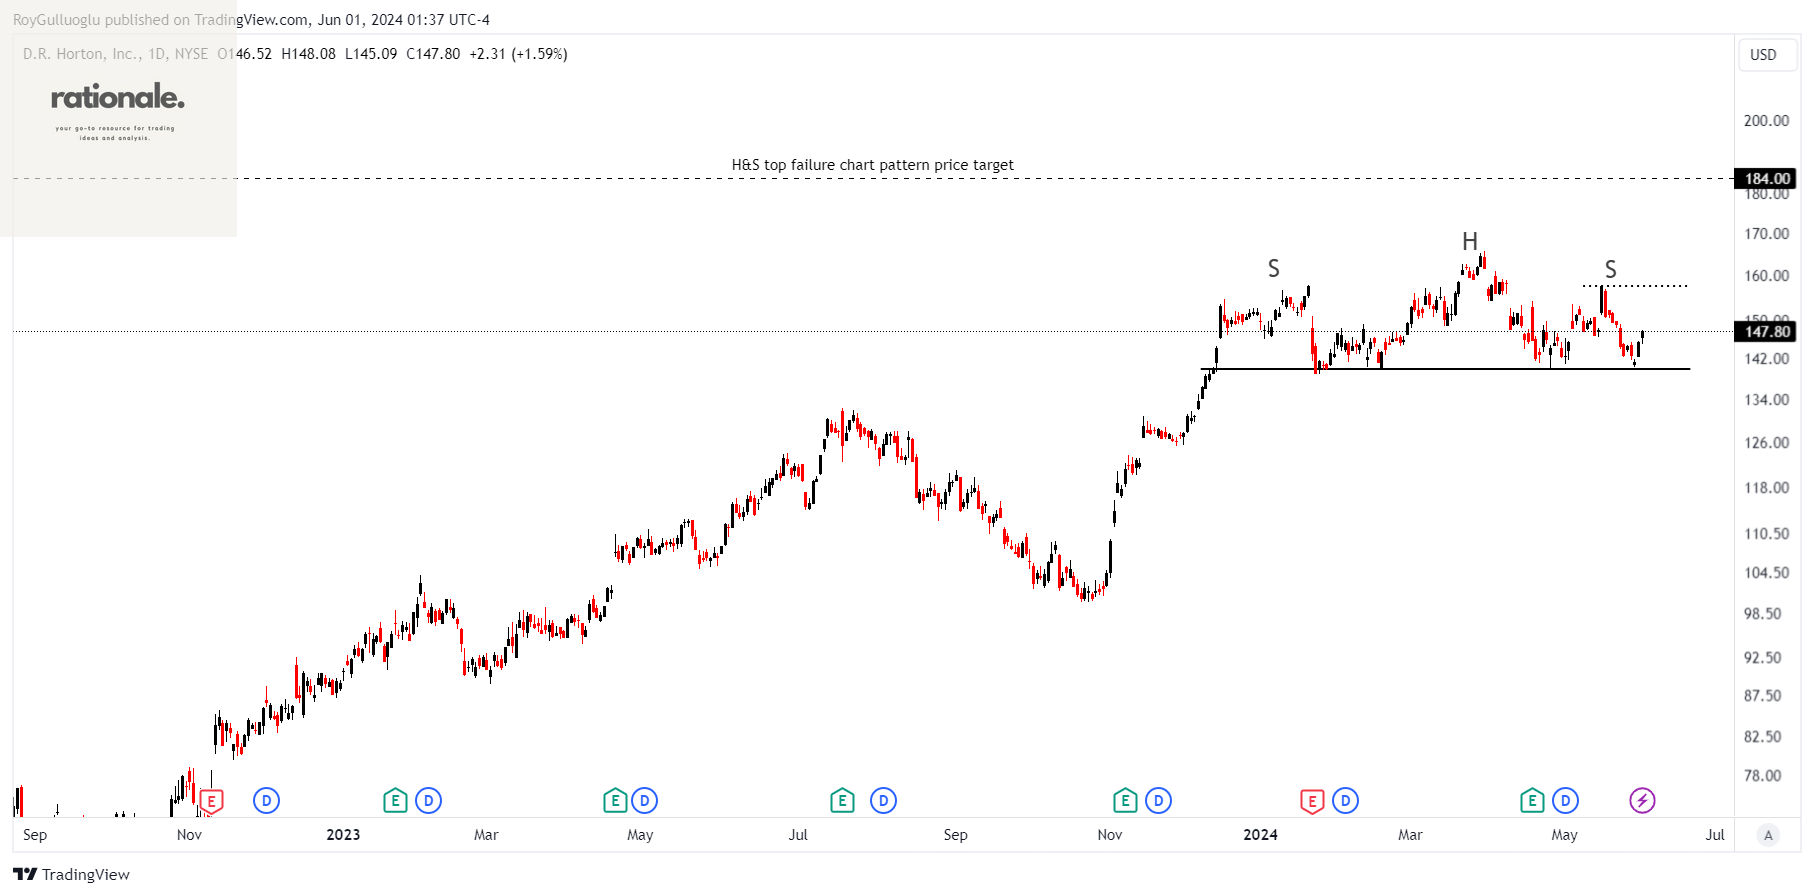
D.R. Horton, Inc. operates as a homebuilding company in East, North, Southeast, South Central, Southwest, and Northwest regions in the United States.
The above weekly chart formed an approximately 4-month-long H&S top failure chart pattern as a bullish continuation after an uptrend.
The horizontal boundary at 157.73 levels acts as a resistance within this pattern.
A daily close above 162.46 levels would validate the breakout from the 4-month-long H&S top failure chart pattern.
Based on this chart pattern, the potential price target is 184 levels.
DHI, classified under the "consumer cyclicals" sector, falls under the “Large Cap - Growth” stock category.
Apollo Global Management, Inc.-(APO/NYSE)-Long Idea
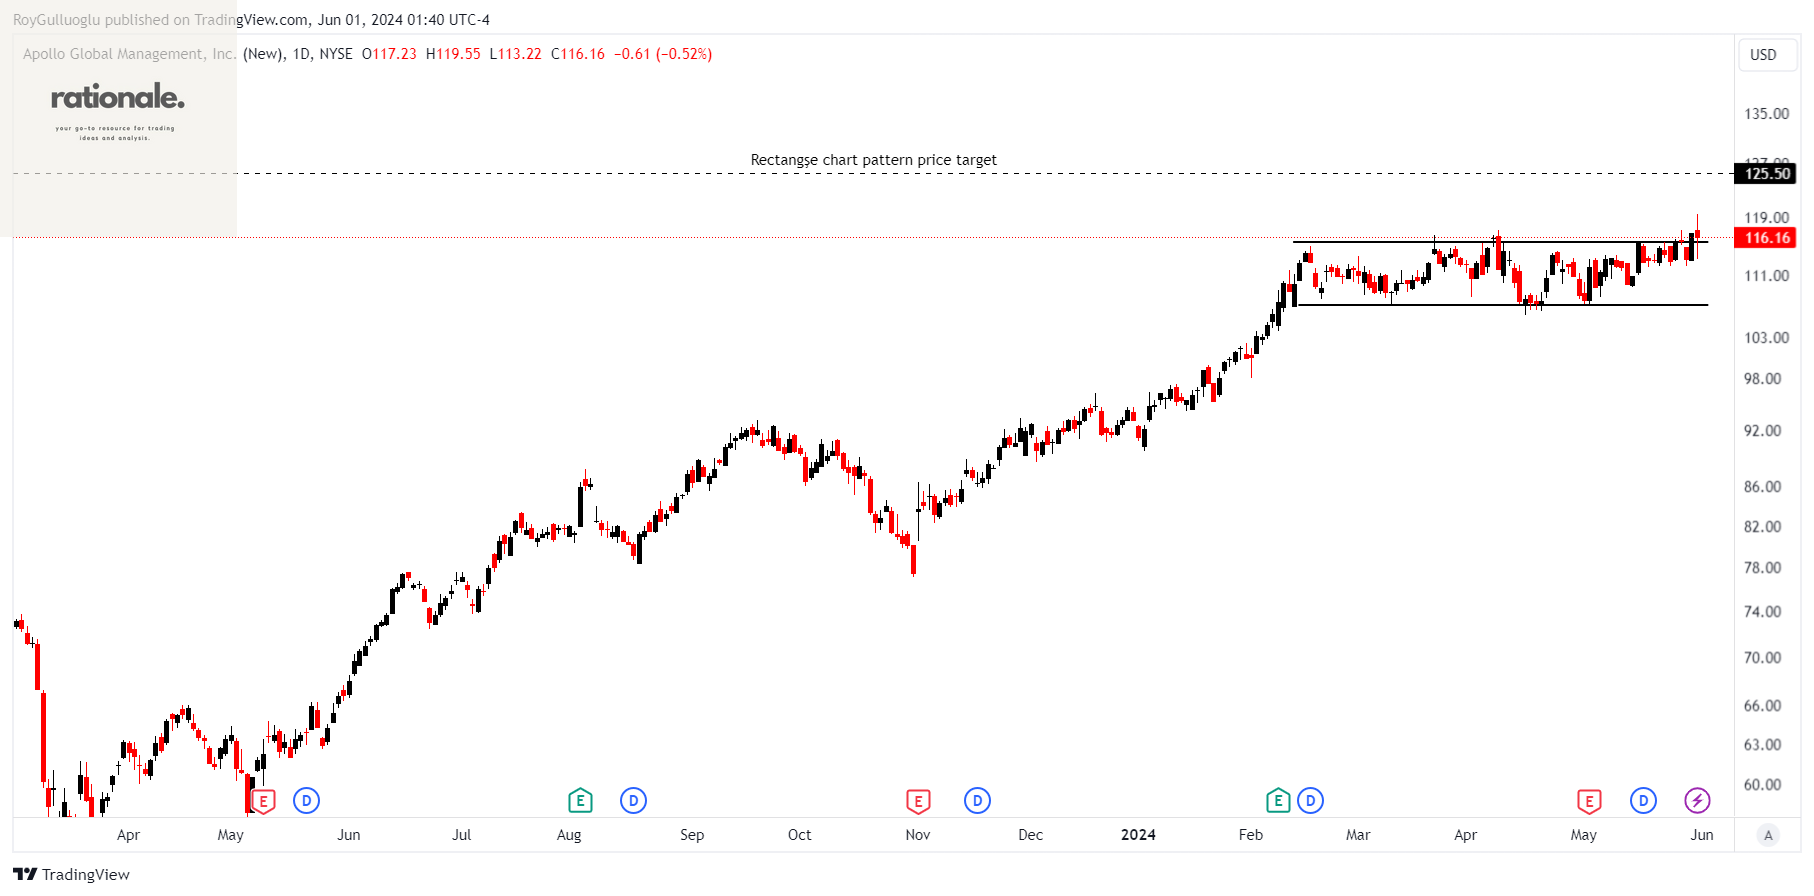
Apollo Global Management, Inc. is a private equity firm specializing in investments in credit, private equity and real estate markets.
The above daily chart formed an approximately 2-month-long rectangle chart pattern as a bullish continuation after an uptrend.
The horizontal boundary at 115.58 levels acts as a resistance within this pattern.
A daily close above 119 levels would validate the breakout from the 2-month-long rectangle chart pattern.
Based on this chart pattern, the potential price target is 125.5 levels.
APO, classified under the "financial services" sector, falls under the “Mid Cap - Income” stock category.
Symbotic Inc.-(SYM/NASDAQ)-Short Idea
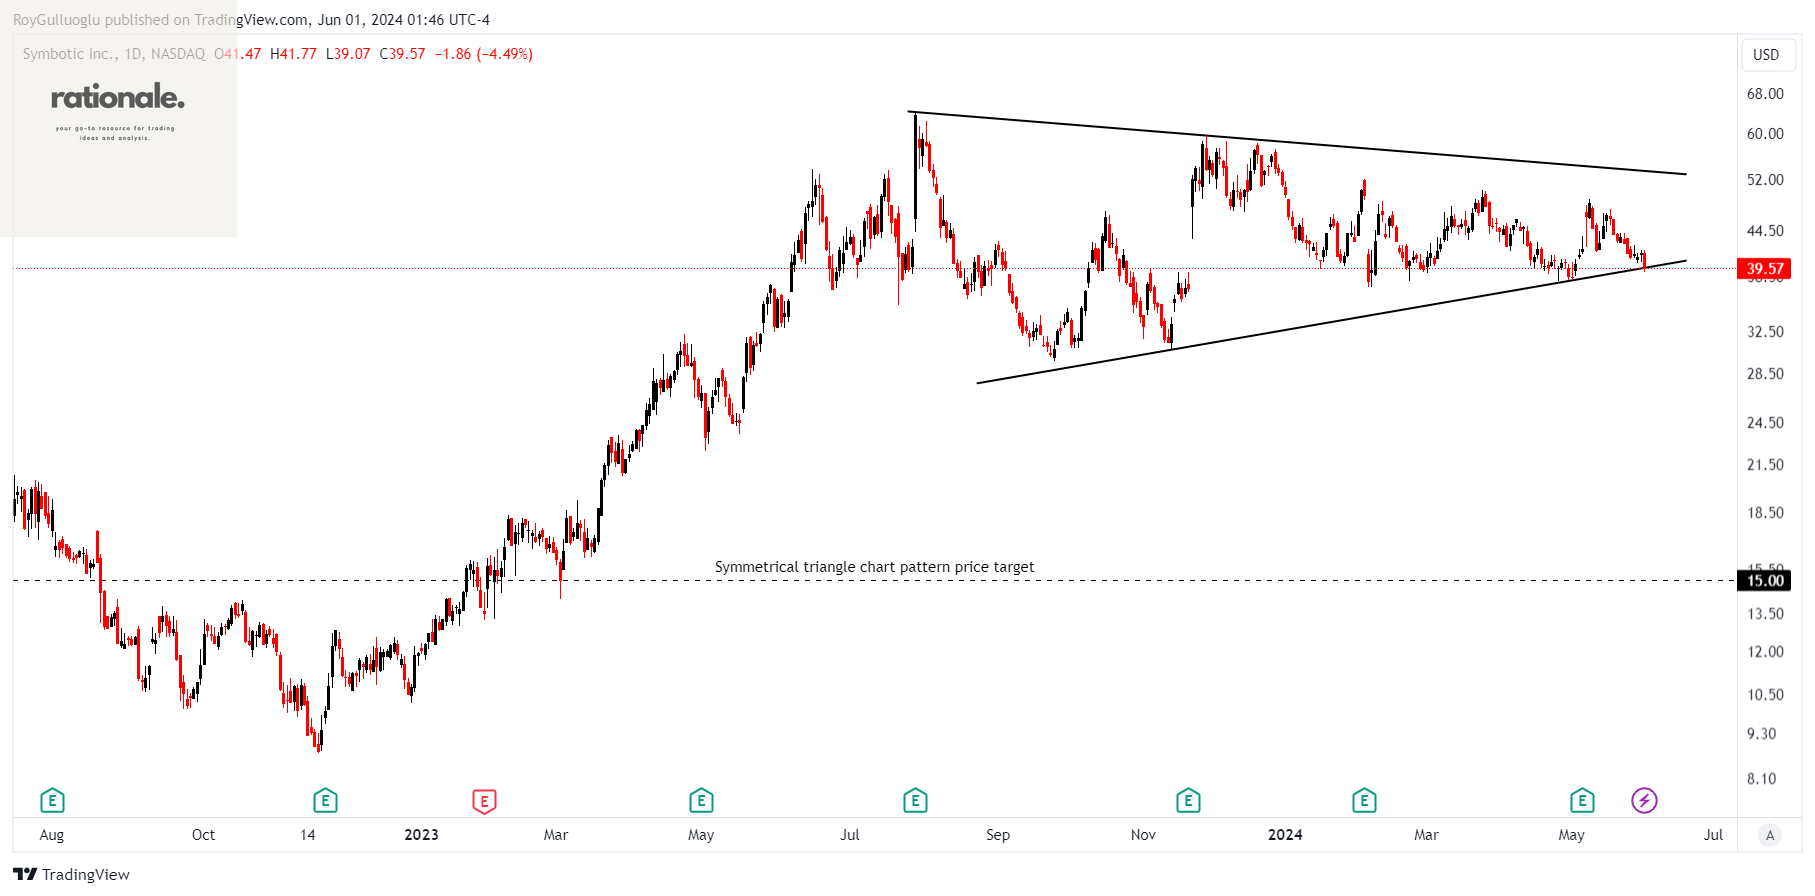
Symbotic Inc., an automation technology company, focuses on developing technologies to enhance operational efficiency in modern warehouses. The company automates the handling of pallets and cases in large warehouses and distribution centers for retail businesses.
The above daily chart formed an approximately 7-month-long symmetrical triangle chart pattern as a bullish reversal after an uptrend.
The uptrend line acts as a support within this pattern.
A daily close below 38.05 levels would validate the breakout from the 7-month-long symmetrical triangle chart pattern.
Based on this chart pattern, the potential price target is 15 levels.
SYM, classified under the "industrials" sector, falls under the “Mid Cap - Value” stock category.
CNA Financial Corporation-(CNA/NYSE)-Long Idea
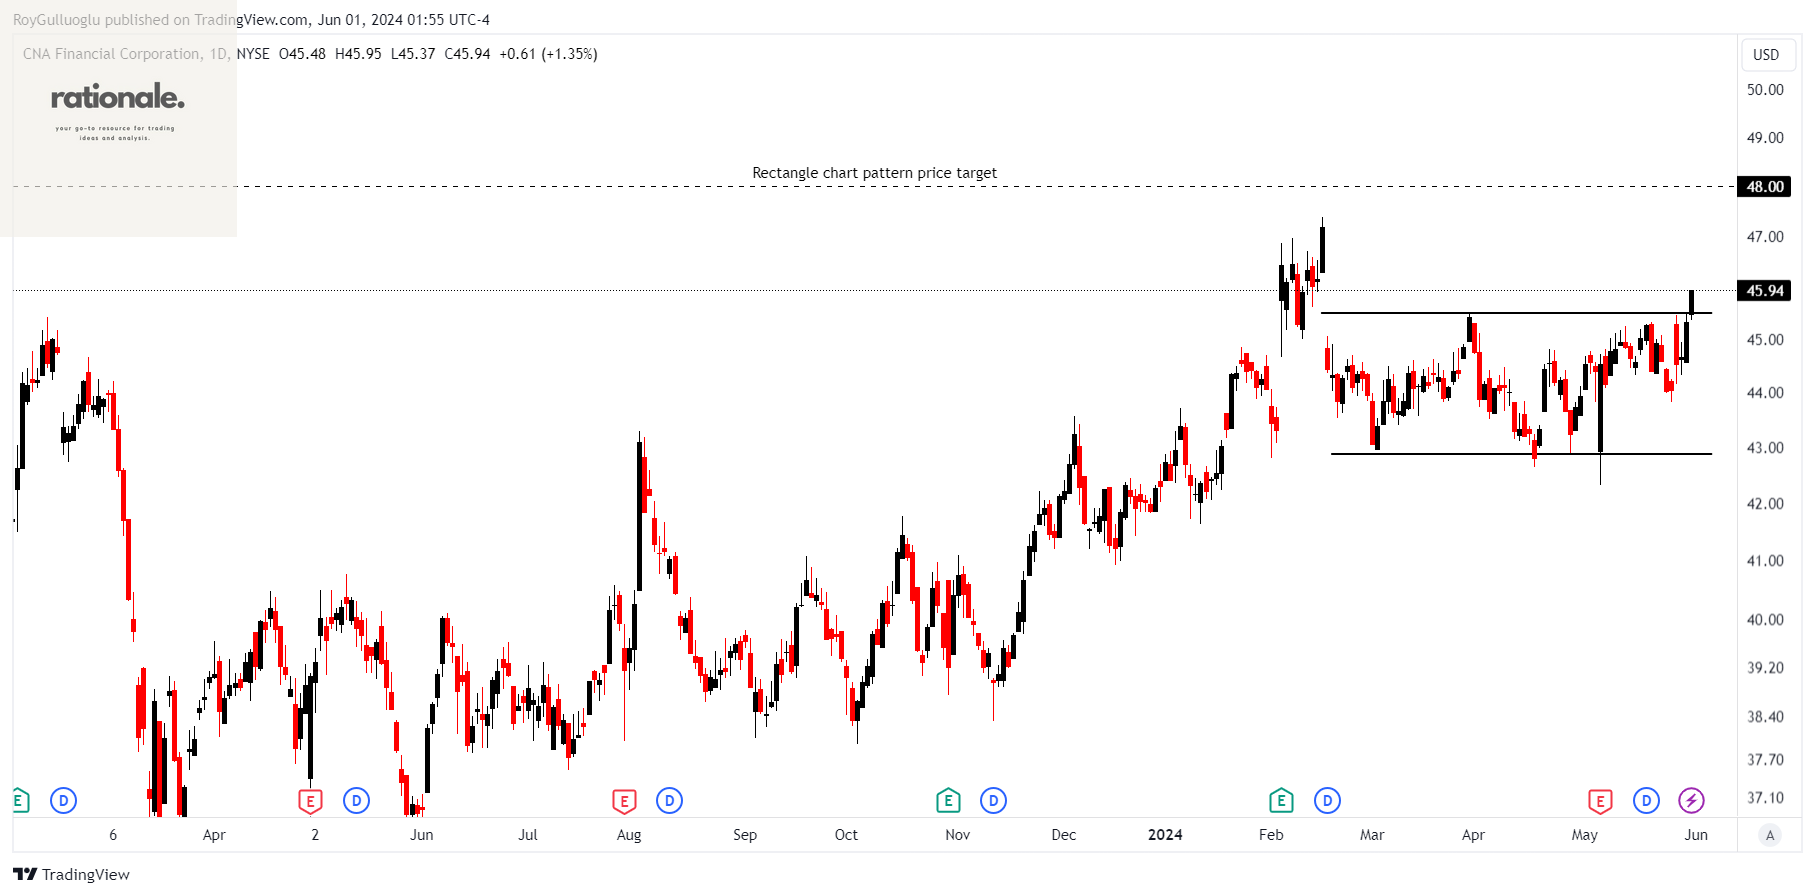
CNA Financial Corporation offers commercial property and casualty insurance products both within the United States and internationally.
The above weekly chart formed an approximately 2-month-long rectangle chart pattern as a bullish continuation after an uptrend.
The horizontal boundary at 45.5 levels acts as a resistance within this pattern.
A daily close above 46.86 levels would validate the breakout from the 2-month-long rectangle chart pattern.
Based on this chart pattern, the potential price target is 48 levels.
CNA, classified under the "utilities" sector, falls under the “Mid Cap - Income” stock category.
Neurocrine Biosciences, Inc.-(NBIX/NASDAQ)-Long Idea
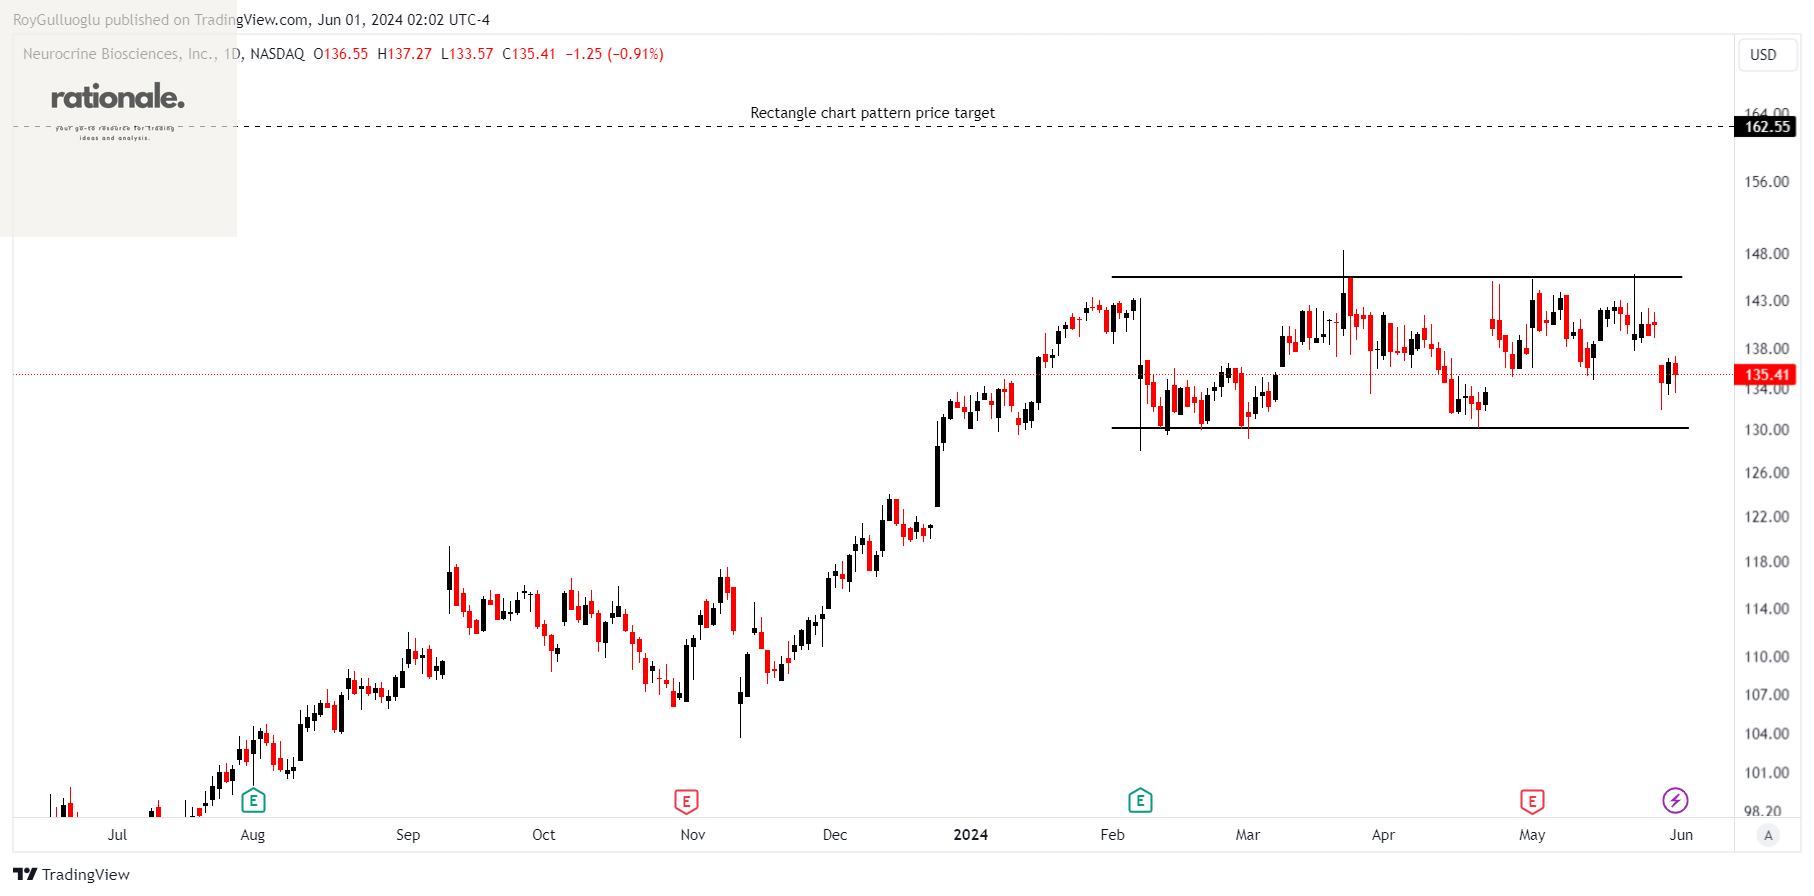
Neurocrine Biosciences, Inc. discovers, develops, and markets pharmaceuticals for treating neurological, neuroendocrine, and neuropsychiatric disorders both in the United States and internationally.
The above daily chart formed an approximately 3-month-long rectangle chart pattern as a bullish continuation after an uptrend.
The horizontal boundary at 145.44 levels acts as a resistance within this pattern.
A daily close below 149.8 levels would validate the breakdown from the 9-month-long rectangle chart pattern.
Based on this chart pattern, the potential price target is 162.55 levels.
NBIX, classified under the "healthcare" sector, falls under the “Large Cap - Value” stock category.
Ryohin Keikaku Co., Ltd.-(7543/TSE)-Long Idea
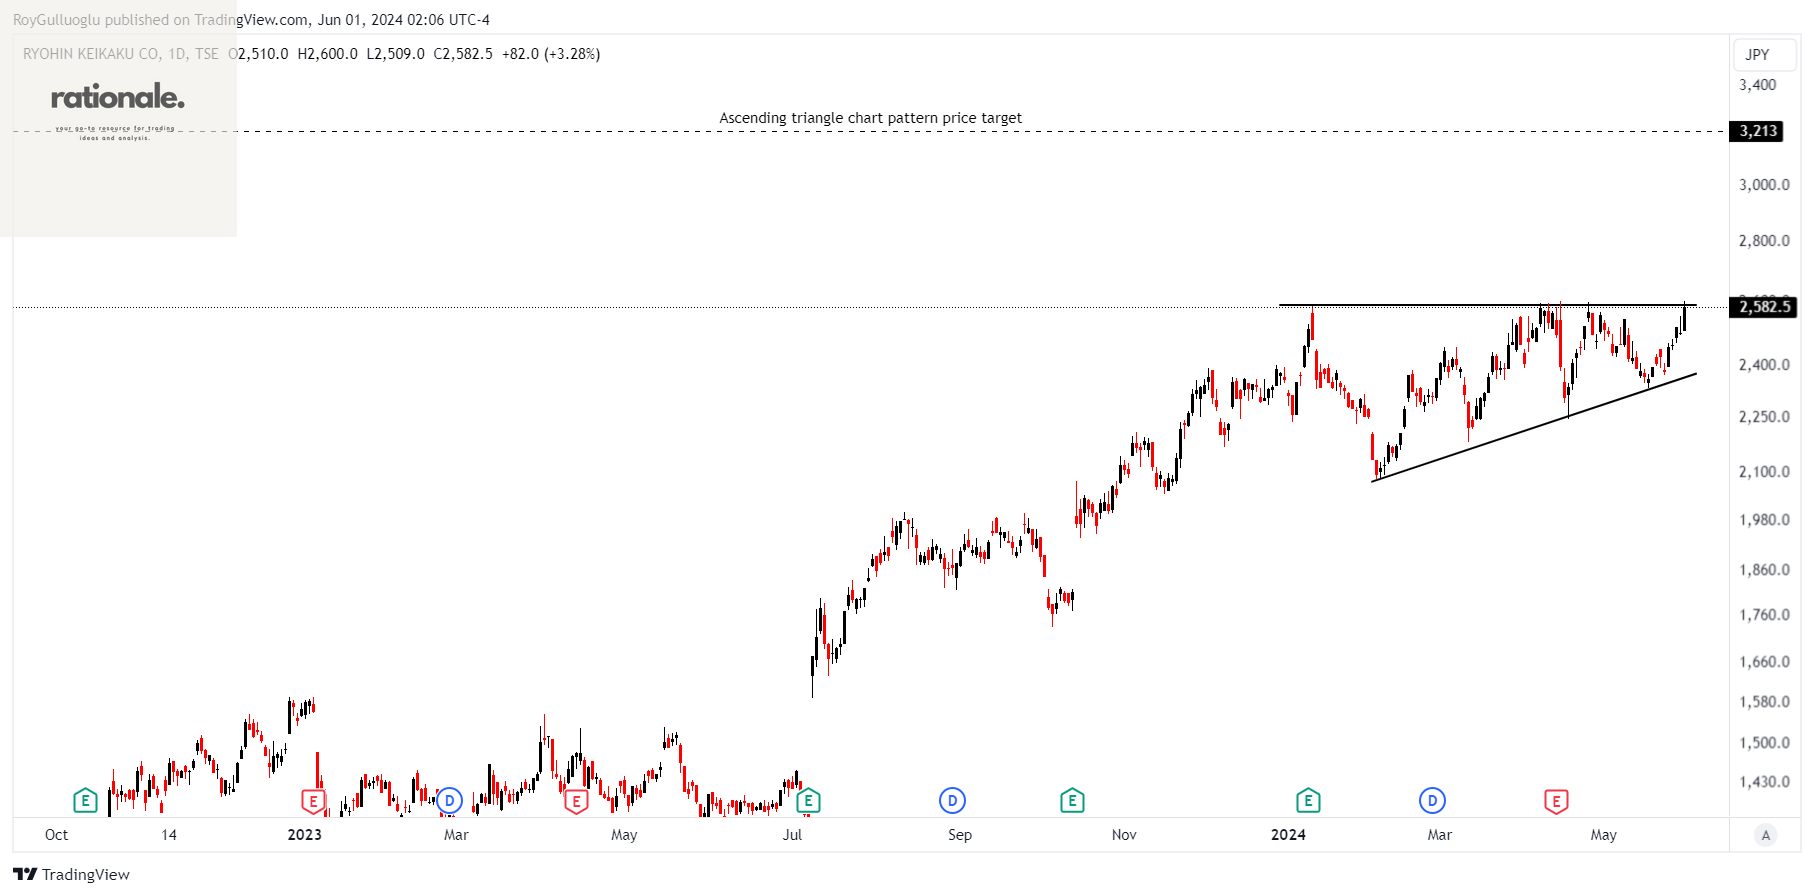
Ryohin Keikaku Co., Ltd. develops, manufactures, distributes, and sells apparel, household goods, and food products both in Japan and internationally.
The above daily chart formed an approximately 3-month-long ascending triangle chart pattern as a bullish continuation after an uptrend.
The horizontal boundary at 2586.5 levels acts as a resistance within this pattern.
A daily close above 2664 levels would validate the breakout from the 3-month-long ascending triangle chart pattern.
Based on this chart pattern, the potential price target is 3213 levels.
7543, classified under the "consumer cyclicals" sector, falls under the “Mid Cap - Growth” stock category.
Teşekkürler