


Pfizer Inc.-(PFE/NYSE)-Long Idea
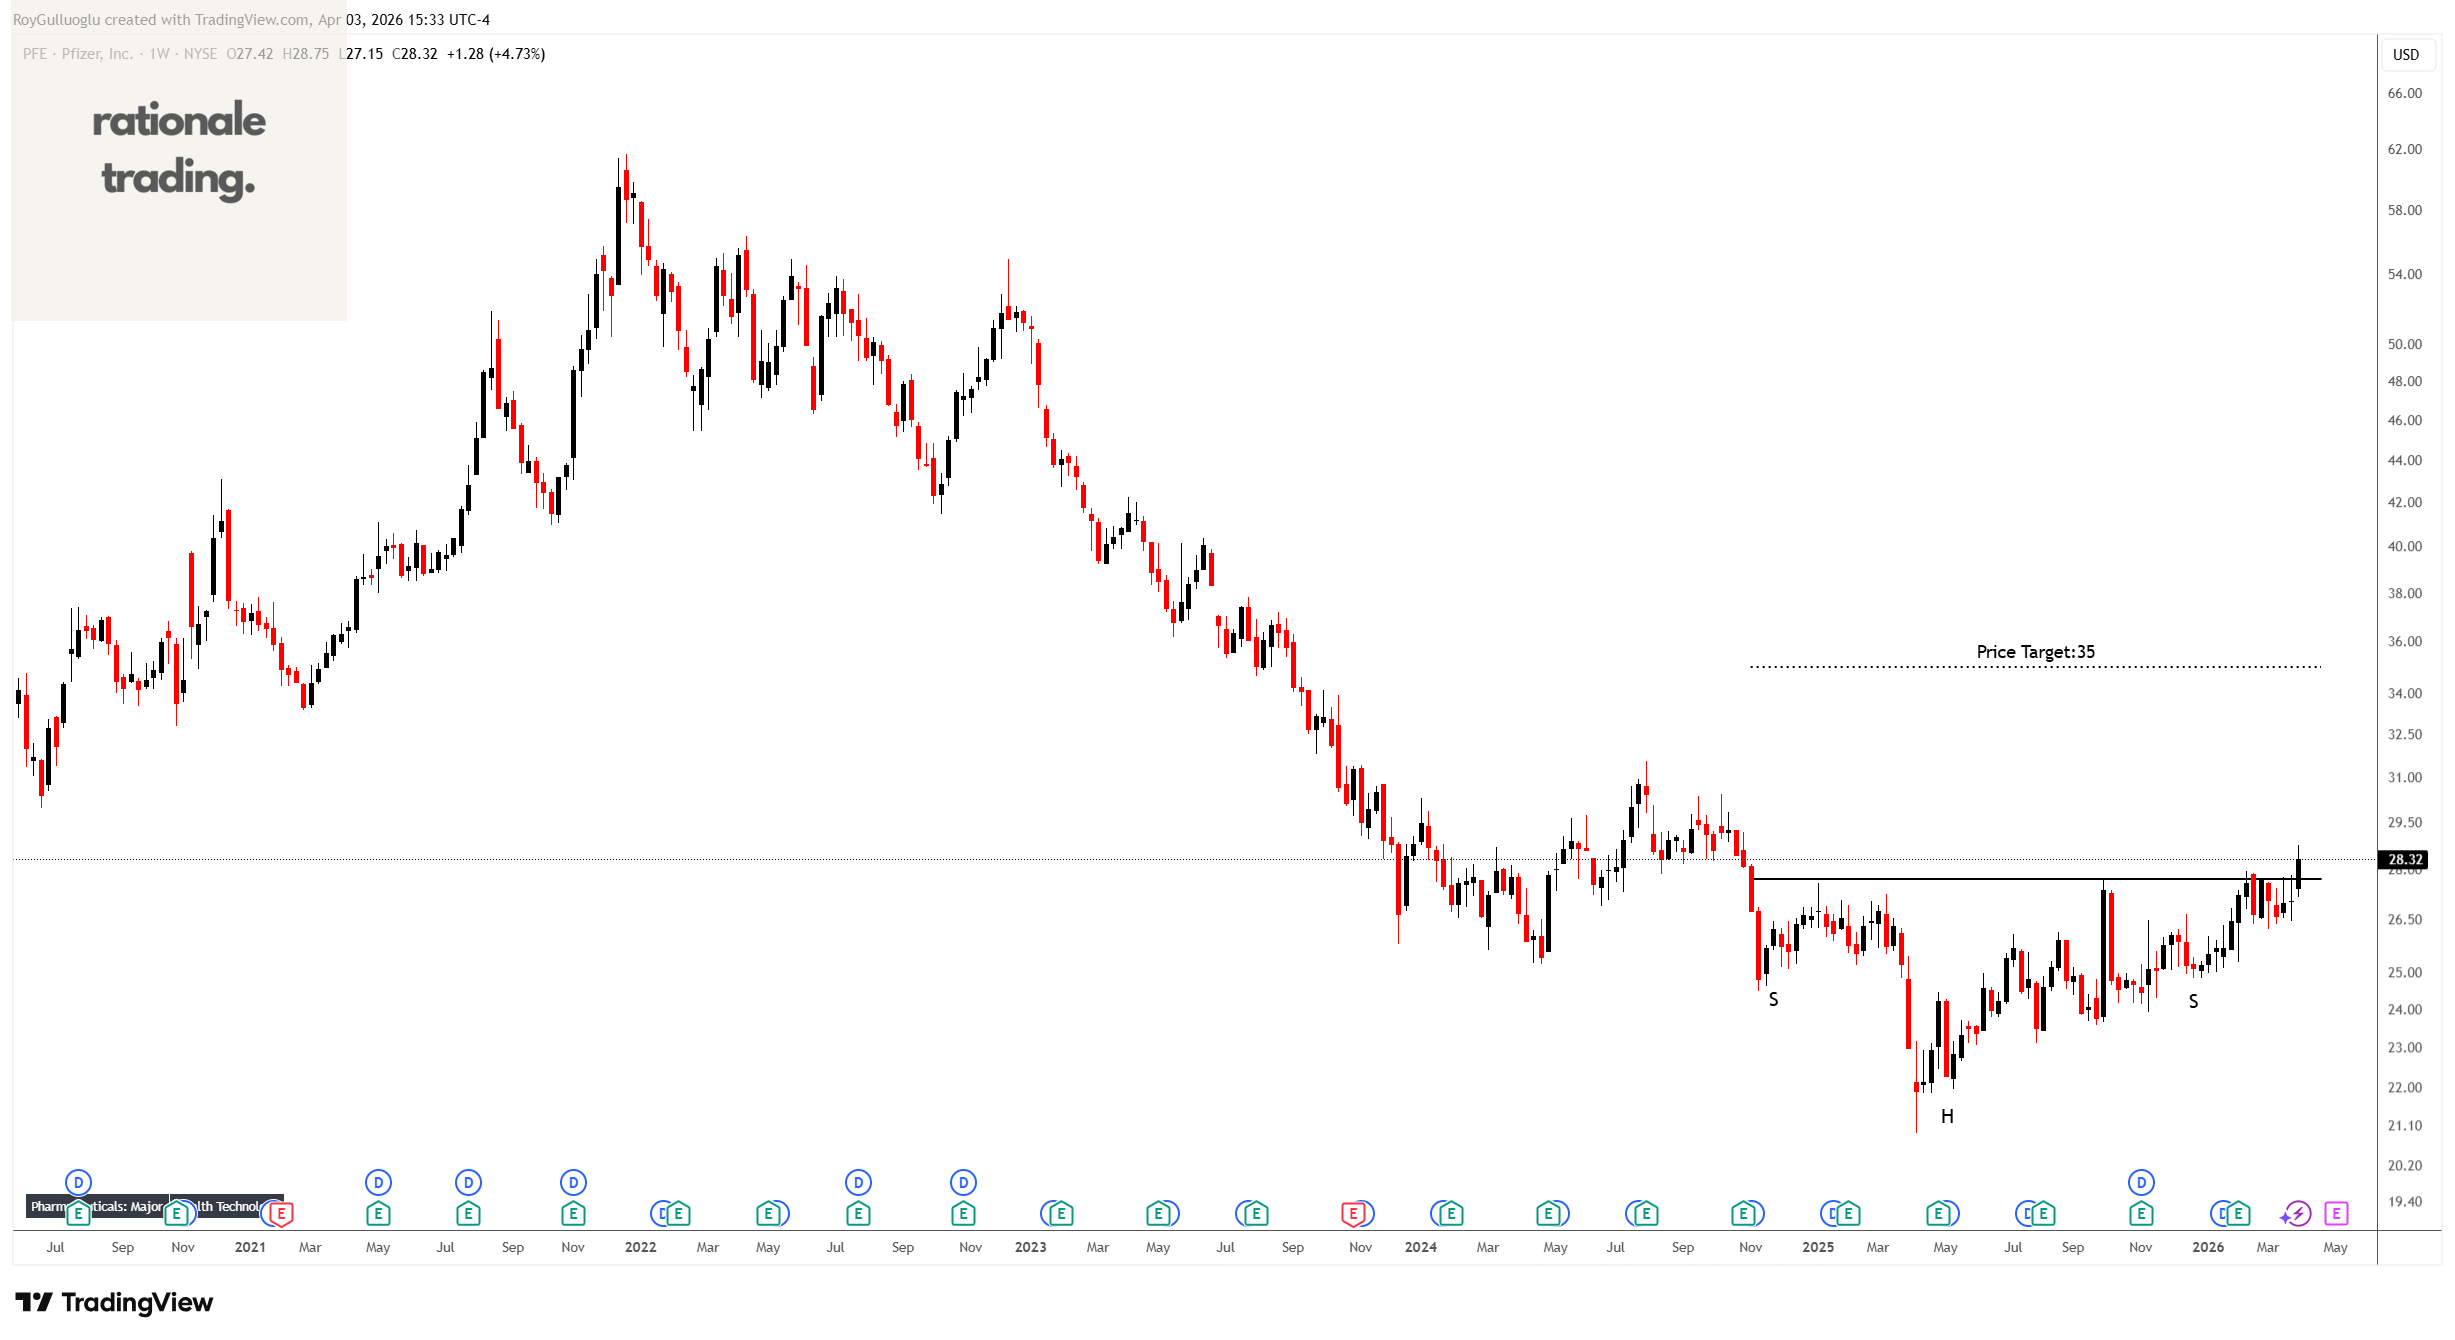
Pfizer Inc. discovers, develops, manufactures, markets, distributes, and sells biopharmaceutical products in the United States and internationally
The above weekly chart formed an approximately 17-month-long H&S bottom chart pattern as a bullish reversal after a downtrend.
The horizontal boundary at 27.69 levels acts as a resistance within this pattern.
A daily close above 28.5 levels would validate the breakout from the 17-month-long H&S bottom chart pattern.
Based on this chart pattern, the potential price target is 35 levels.
PFE, classified under the “healthcare” sector, falls under the “Large Cap - Value” stock category.
Arista Networks, Inc.-(ANET/NYSE)-Short Idea
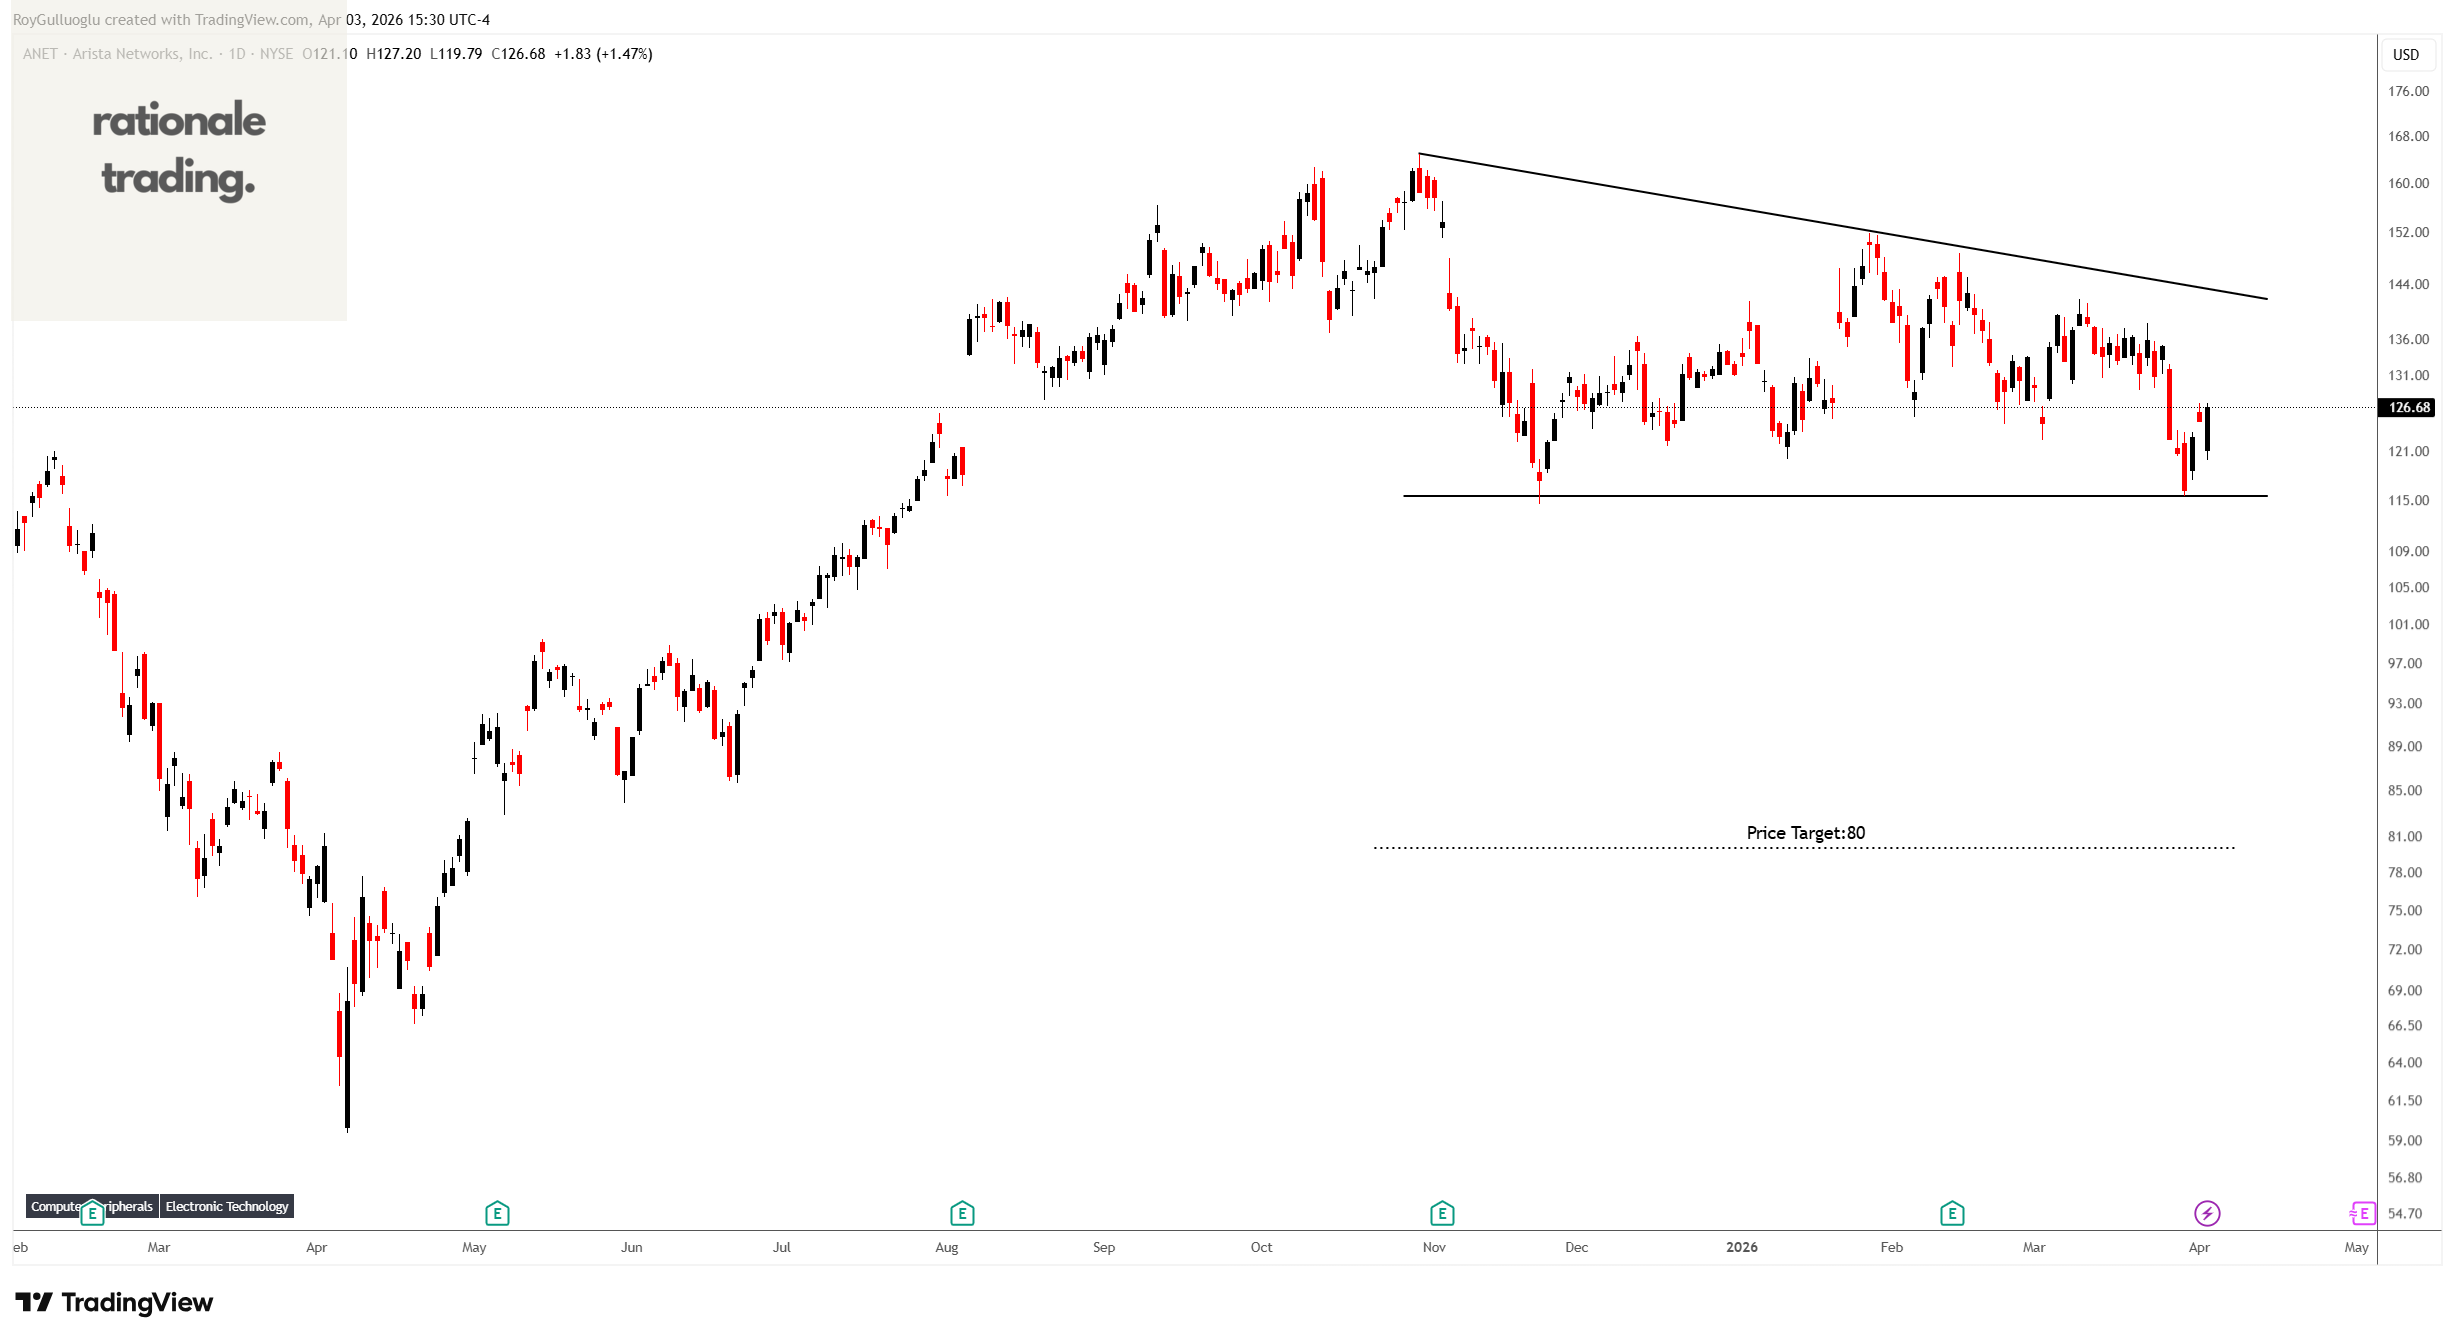
Arista Networks, Inc. engages in the development, marketing, and sale of data-driven, client to cloud networking solutions for AI, data center, campus, and routing environments in the Americas, Europe, the Middle East, Africa, and the Asia-Pacific.
The above daily chart formed an approximately 3-month-long descending triangle chart pattern as a bearish reversal after an uptrend.
The horizontal boundary at 115.4 levels acts as a support within this pattern.
A daily close below 111.9 levels would validate the breakdown from the 3-month-long descending triangle chart pattern.
Based on this chart pattern, the potential price target is 80 levels.
ANET, classified under the “technology” sector, falls under the “Large Cap - Growth” stock category.
Iskenderun Demir ve Çelik A.S.-(ISDMR/BIST)-Long Idea
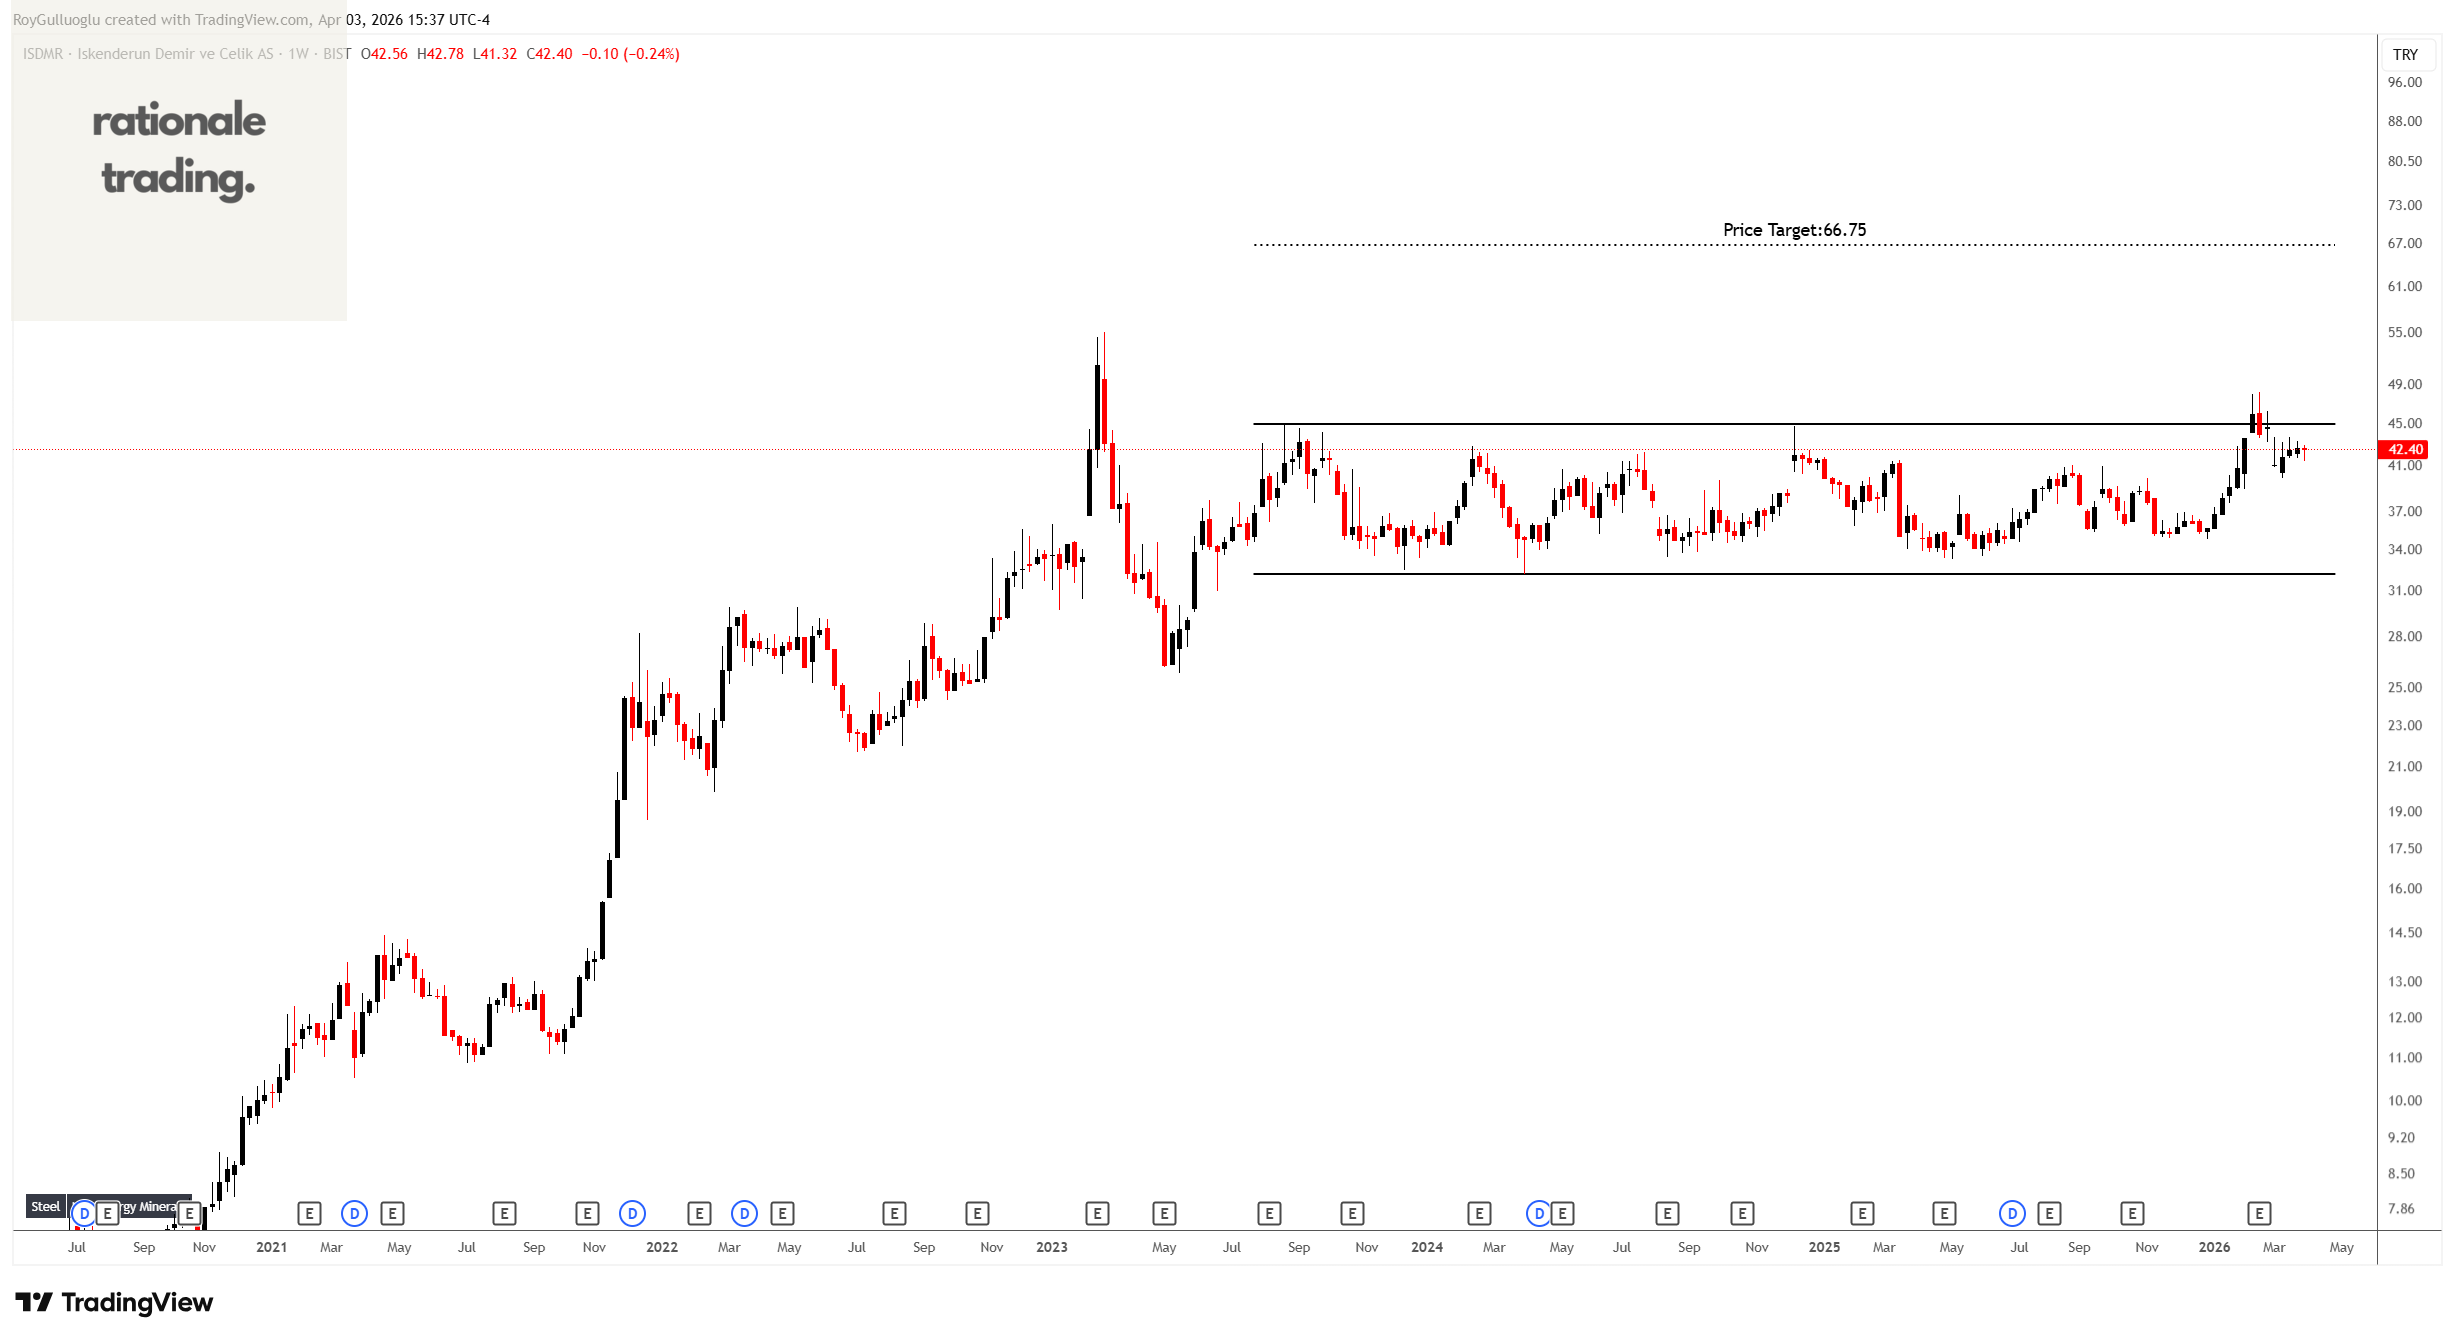
Iskenderun Demir ve Çelik A.S. produces and sells flat steel products in Turkey.
The above weekly chart formed an approximately 32-month-long rectangle chart pattern as a bullish continuation after an uptrend.
The horizontal boundary at 44.9 levels acts as a resistance within this pattern.
A daily close above 46.25 levels would validate the breakout from the 32-month-long rectangle chart pattern.
Based on this chart pattern, the potential price target is 66.75 levels.
ISDMR, classified under the “non-energy mineral” sector.
DFDS A/S-(DFDS/OMXCOP)-Long Idea
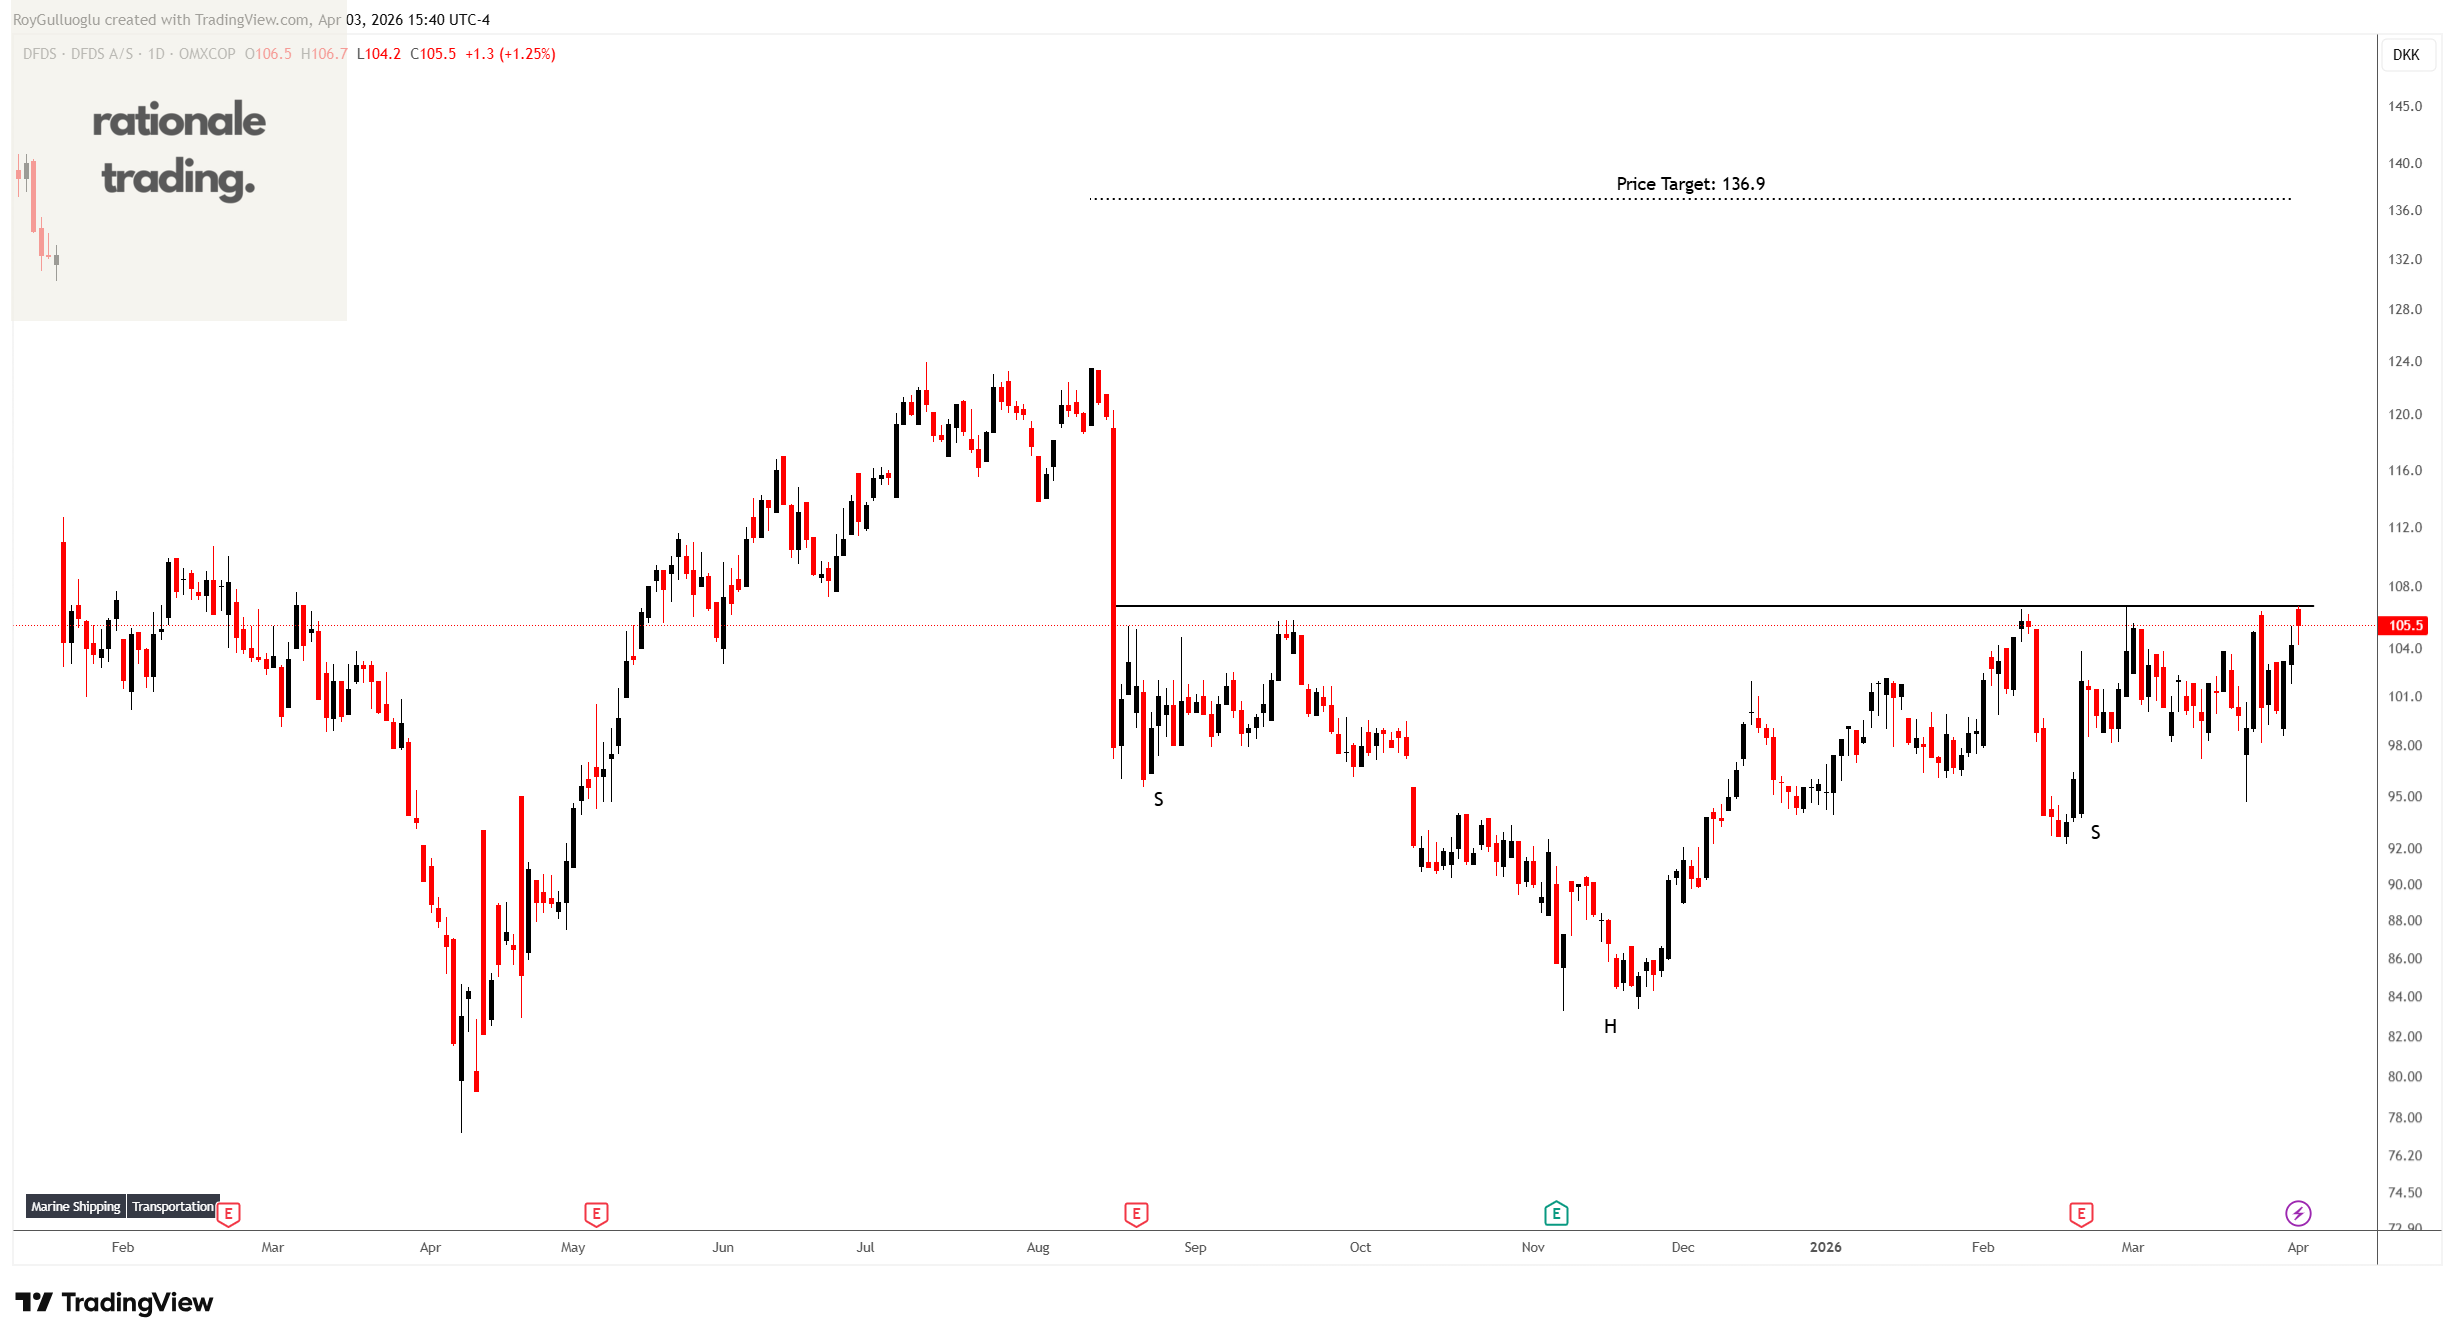
DFDS A/S provides freight and passenger transport services in Europe, Türkiye, North Africa, and internationally.
The above daily chart formed an approximately 5-month-long H&S chart pattern as a bullish reversal after a downtrend.
The horizontal boundary at 106.7 levels acts as a support within this pattern.
A daily close above 109.9 levels would validate the breakout from the 5-month-long H&S chart pattern.
Based on this chart pattern, the potential price target is 136.9 levels.
DFDS, classified under the “industrials” sector, falls under the “Small Cap - Value” stock category.
Raia Drogasil S.A. -(RADL3/BOVESPA)-Short Idea
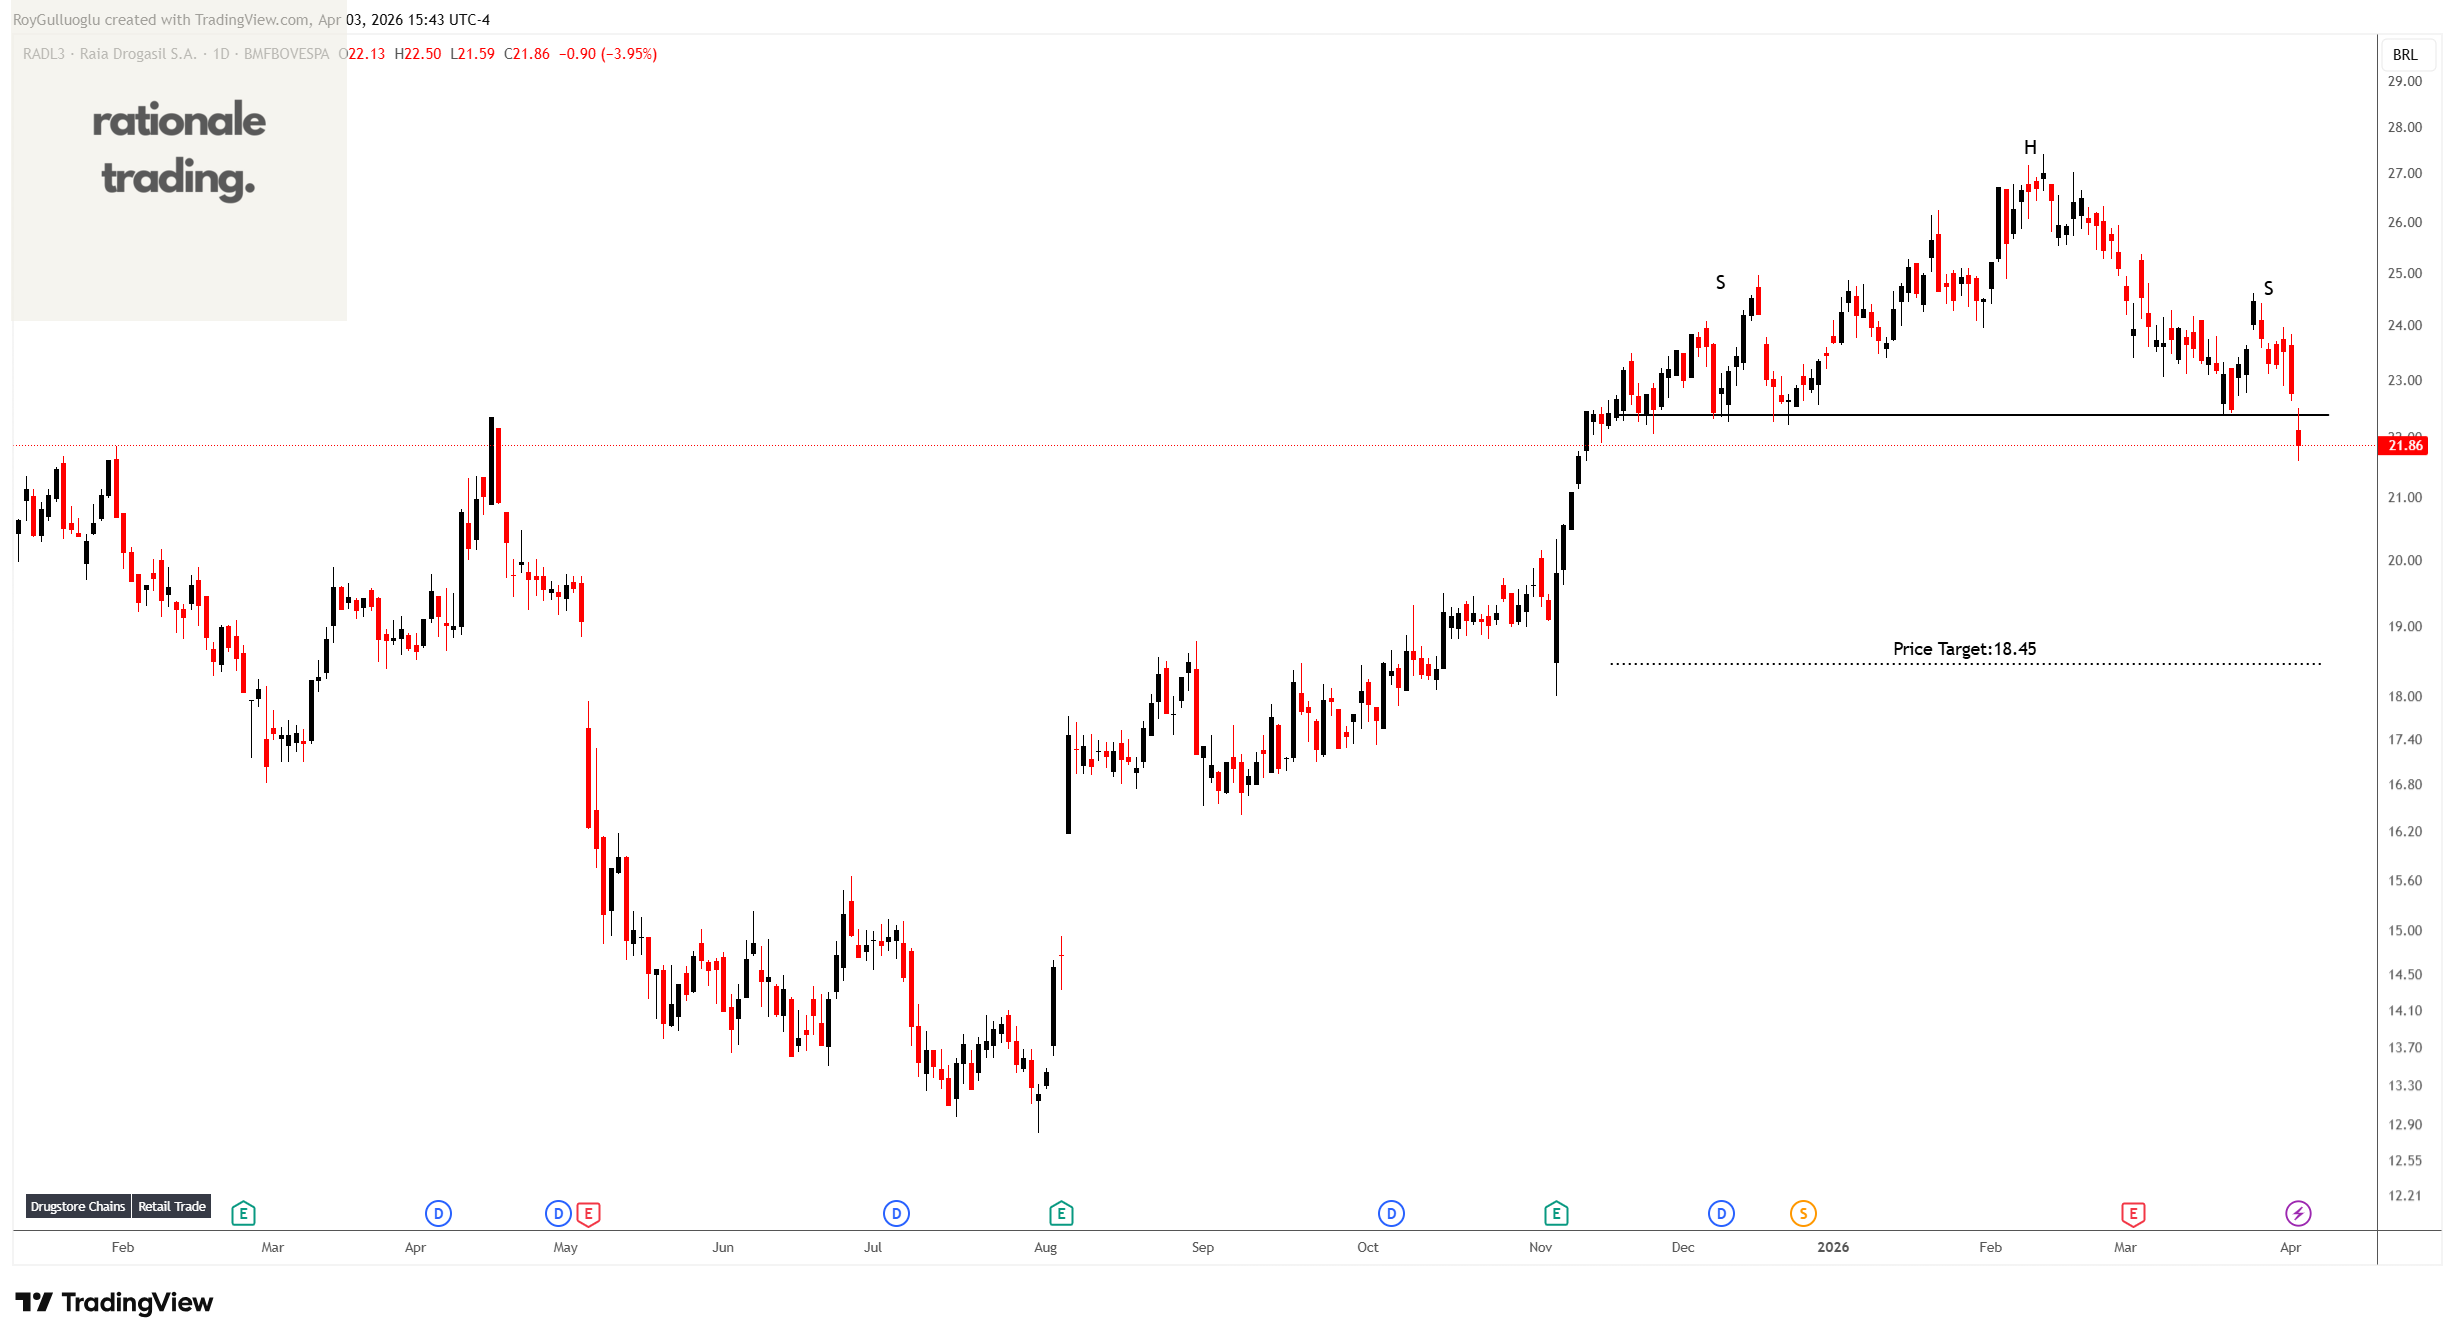
Raia Drogasil S.A. engages in the retail sale of medicines, perfumery, personal care and beauty products, cosmetics and dermocosmetics and specialty medicines in Brazil.
The above daily chart formed an approximately 3-month-long H&S top chart pattern as a bearish reversal after an uptrend.
The horizontal boundary at 22.38 levels acts as a support within this pattern.
A daily close below 21.7 levels would validate the breakdown from the 3-month-long H&S top chart pattern.
Based on this chart pattern, the potential price target is 18.45 levels.
RADL3, classified under the “retail trade” sector.
Teşekkürler Roy