


New setups
TICKERS: LNG(NYSE), VSH(NYSE), GCT(NASDAQ), AMRK(NASDAQ), MLKN(NASDAQ), CYBR(NASDAQ), SLNO(NASDAQ), ML(EURONEXT), ELECTCAST(NSE), SUPRIYA(NSE)
Cheniere Energy, Inc.-(LNG/NYSE)-Long Ide
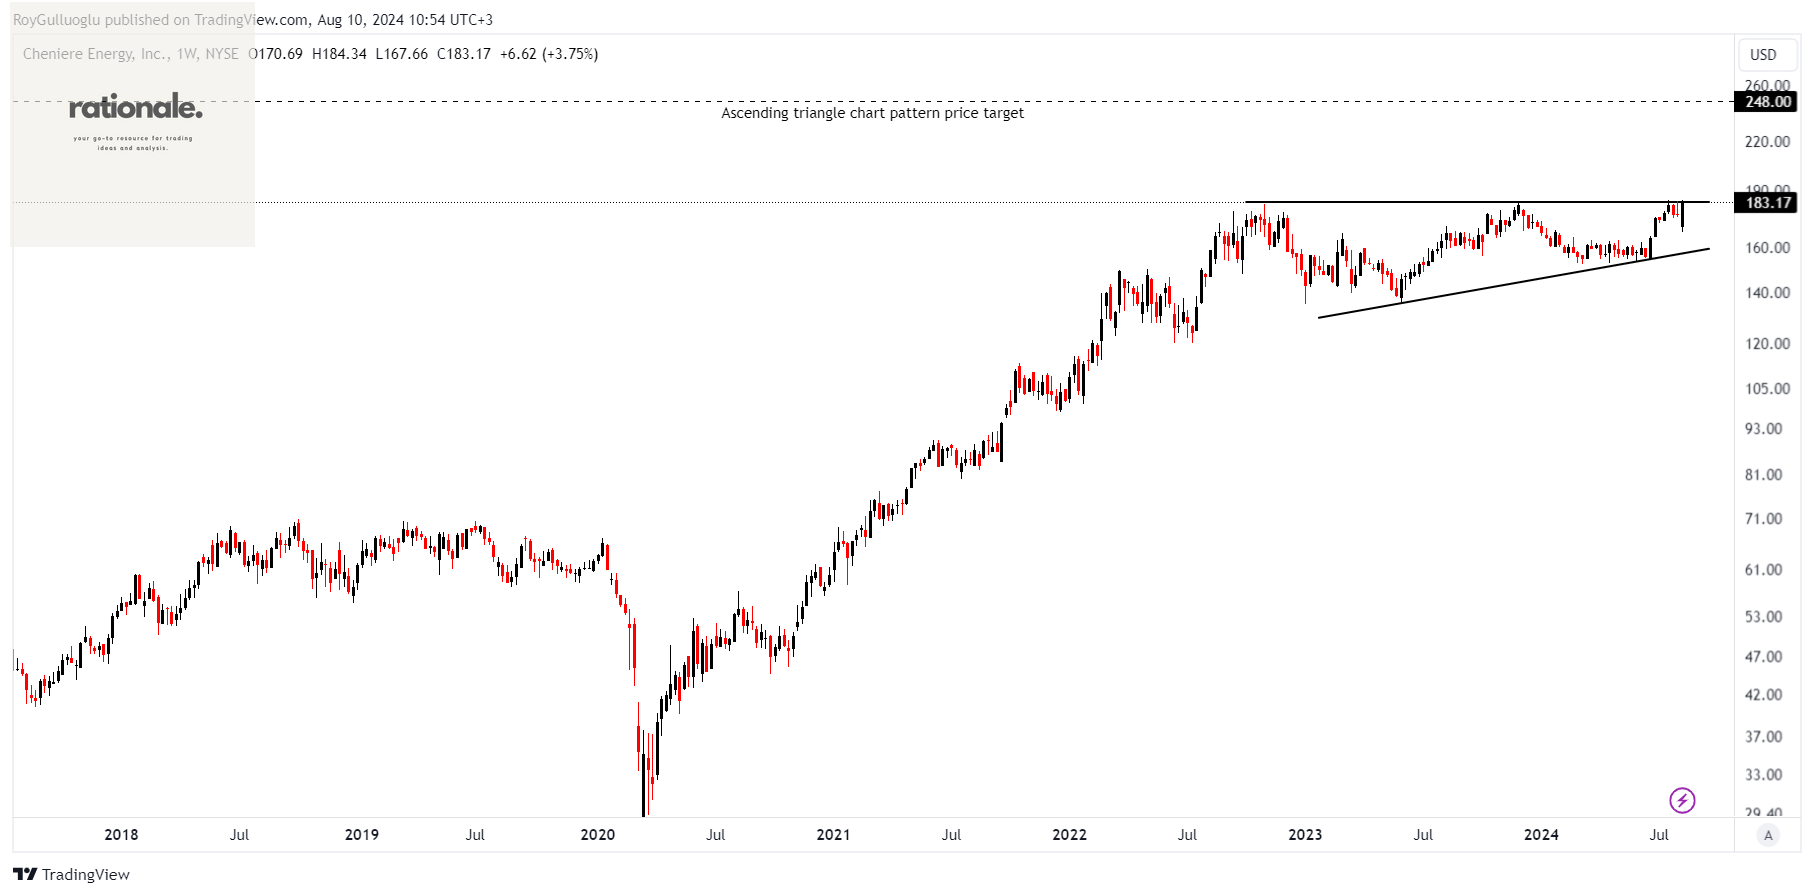
Cheniere Energy, Inc., an energy infrastructure company, primarily focuses on liquefied natural gas (LNG) operations within the United States.
The above weekly chart formed an approximately 24-month-long ascending triangle chart pattern as a bullish continuation after an uptrend.
The horizontal boundary at 183.17 levels acts as a resistance within this pattern.
A daily close above 188.66 levels would validate the breakout from the 24-month-long ascending triangle chart pattern.
Based on this chart pattern, the potential price target is 248 levels.
LNG, classified under the "energy" sector, falls under the “Small Cap - Income” stock category.
Vishay Intertechnology, Inc.-(VSH/NYSE)-Short Idea
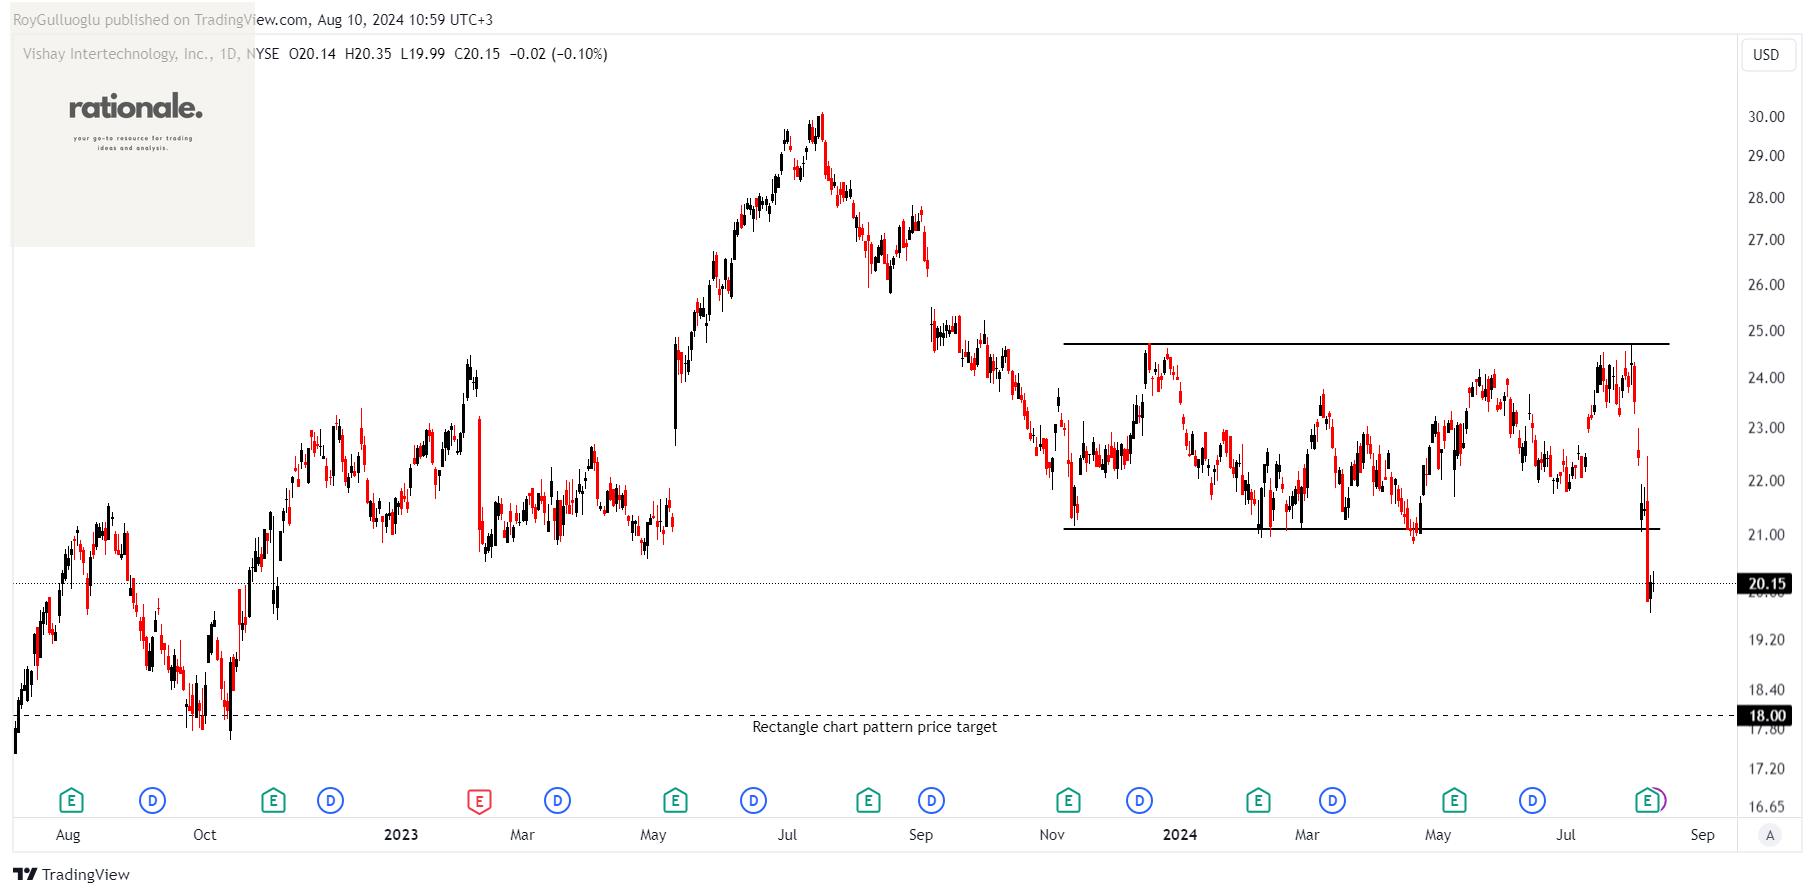
Vishay Intertechnology, Inc. produces and distributes discrete semiconductors and passive electronic components across Asia, Europe, and the Americas.
The above daily chart formed an approximately 6-month-long rectangle chart pattern as a bullish continuation after a downtrend.
The horizontal boundary at 21.04 levels acted as a support within this pattern.
A daily close below 20.41 levels validated the breakdown from the 6-month-long rectangle chart pattern.
Based on this chart pattern, the potential price target is 18 levels.
VSH, classified under the "technology" sector, falls under the “Mid Cap - Growth” stock category.
GigaCloud Technology Inc.-(GCT/NASDAQ)-Short Idea
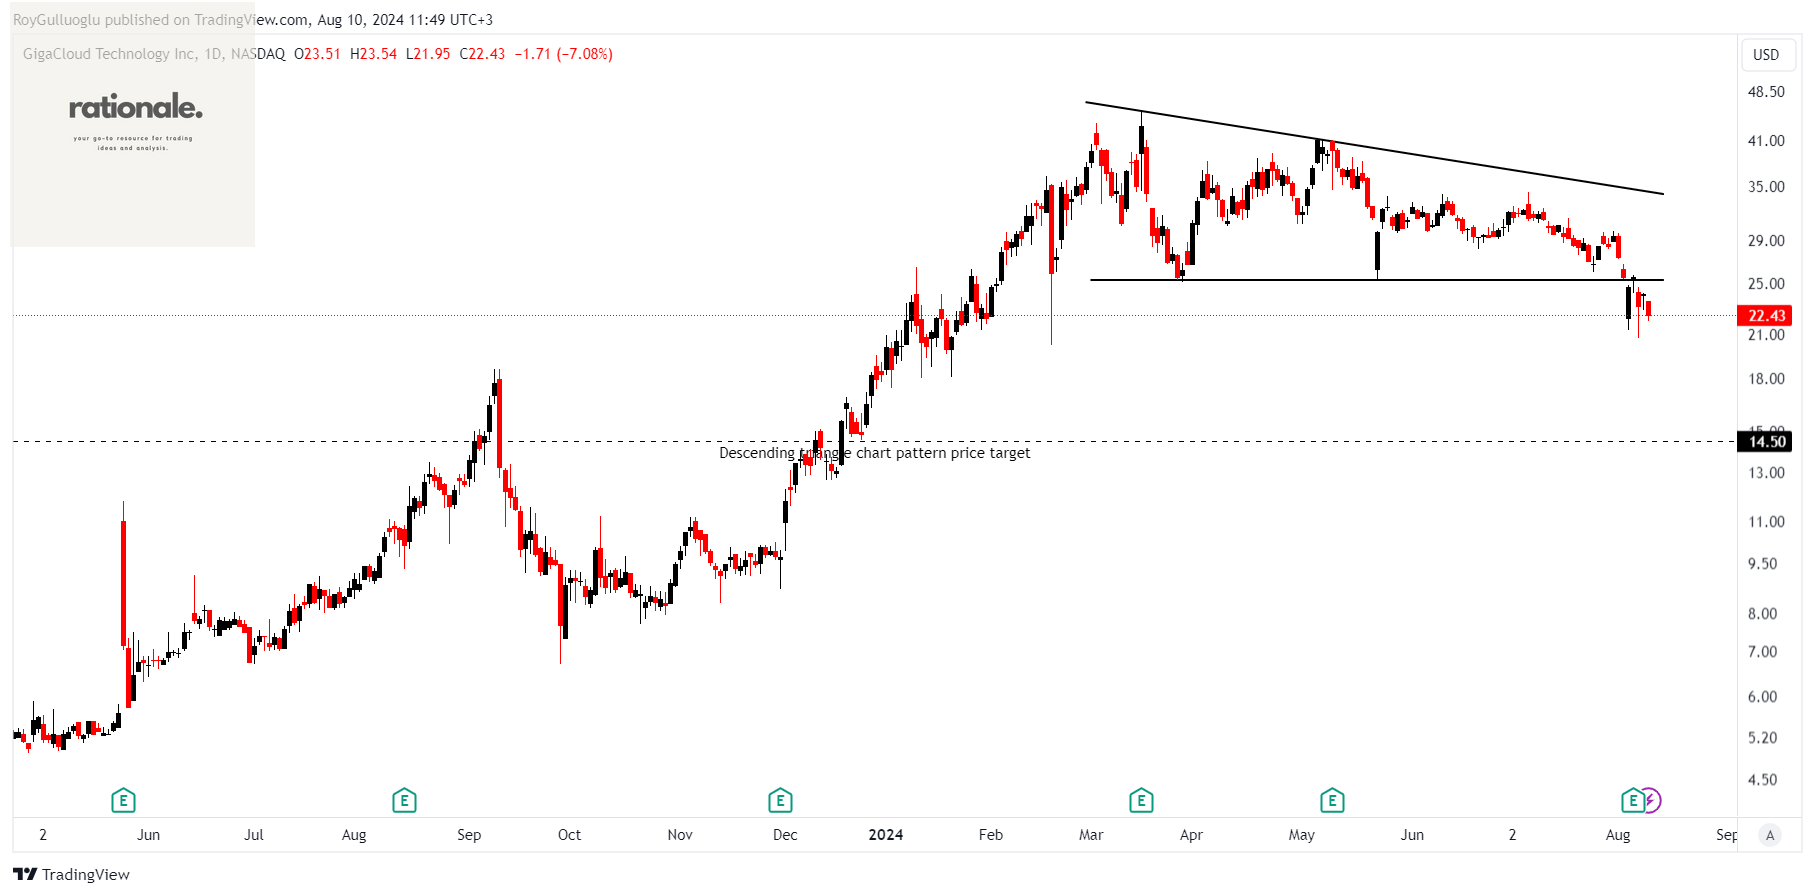
GigaCloud Technology Inc. offers end-to-end B2B e-commerce solutions for large parcel merchandise, serving customers in the United States and internationally.
The above daily chart formed an approximately 4-month-long descending triangle chart pattern as a bearish reversal after an uptrend.
The horizontal boundary at 25.34 levels acted as a support within this pattern.
A daily close below 24.28 levels validated the breakdown from the 6-month-long rectangle chart pattern.
Based on this chart pattern, the potential price target is 14.5 levels.
GCT, classified under the "technology" sector, falls under the “Small Cap - Growth” stock category.
A-Mark Precious Metals, Inc.-(AMRK/NASDQ)-Long Idea
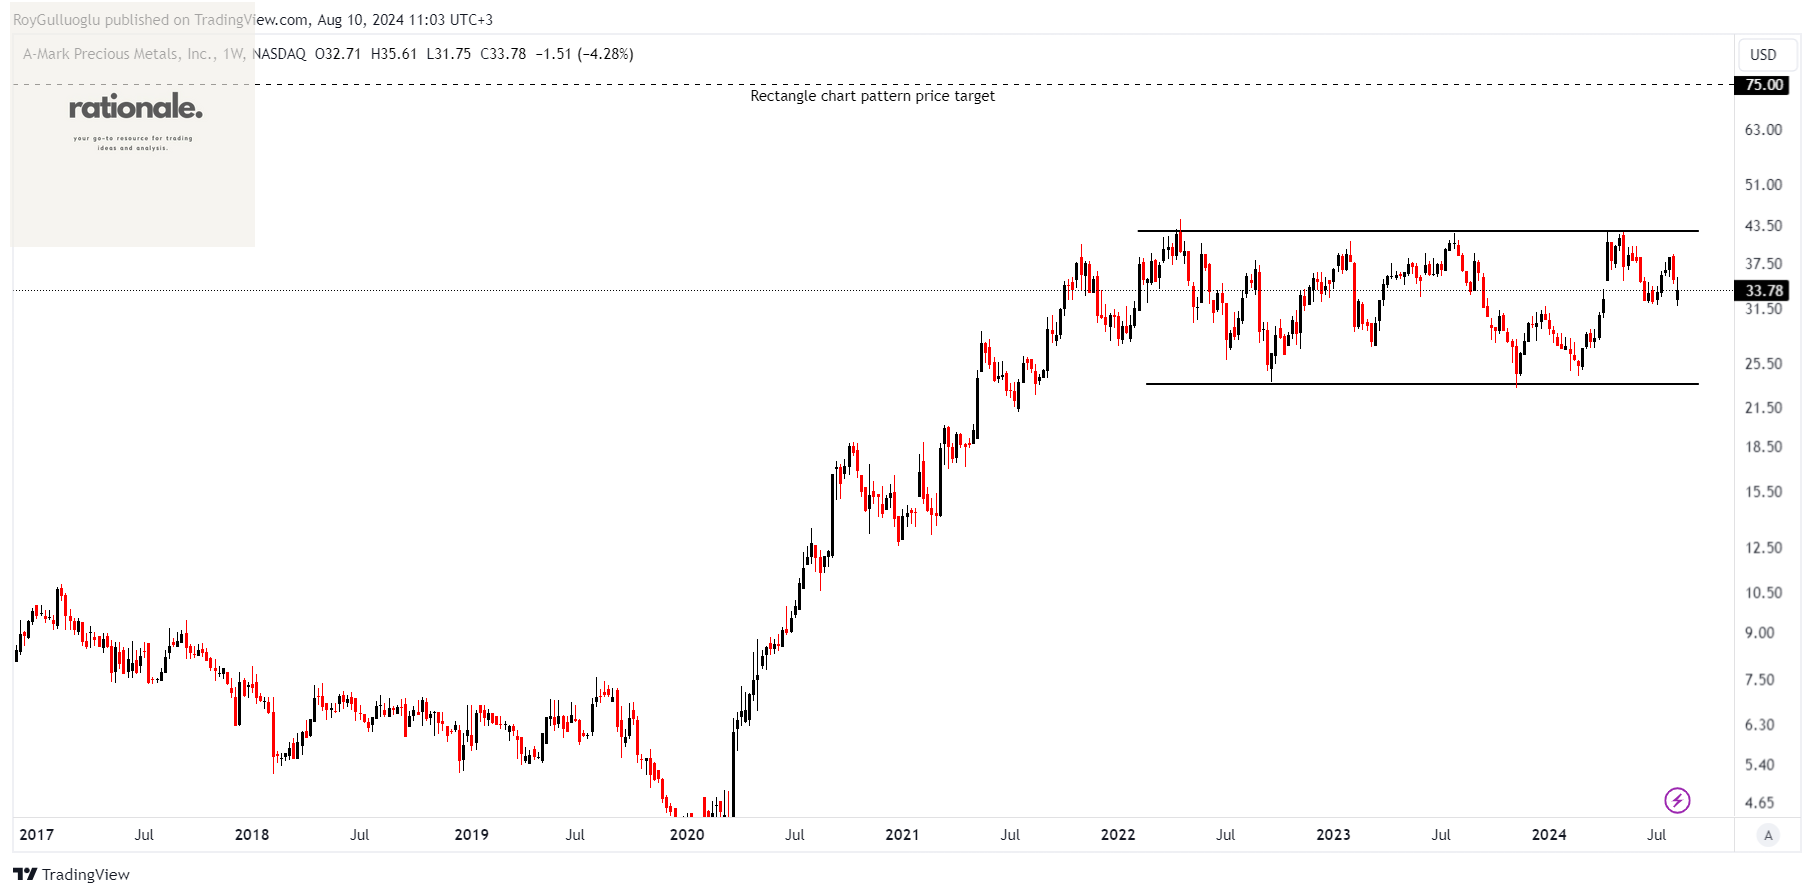
A-Mark Precious Metals, Inc., along with its subsidiaries, operates as a precious metals trading company.
The above weekly chart formed an approximately 4-month-long rectangle chart pattern as a bullish continuation after an uptrend.
The horizontal boundary at 42.5 levels acts as a resistance within this pattern.
A daily close above 43.77 levels would validate the breakout from the 4-month-long rectangle chart pattern.
Based on this chart pattern, the potential price target is 75 levels.
AMRK, classified under the "financial services" sector, falls under the “Small Cap - Income” stock category.
MillerKnoll, Inc.-(MLKN/NASDAQ)-Long Idea
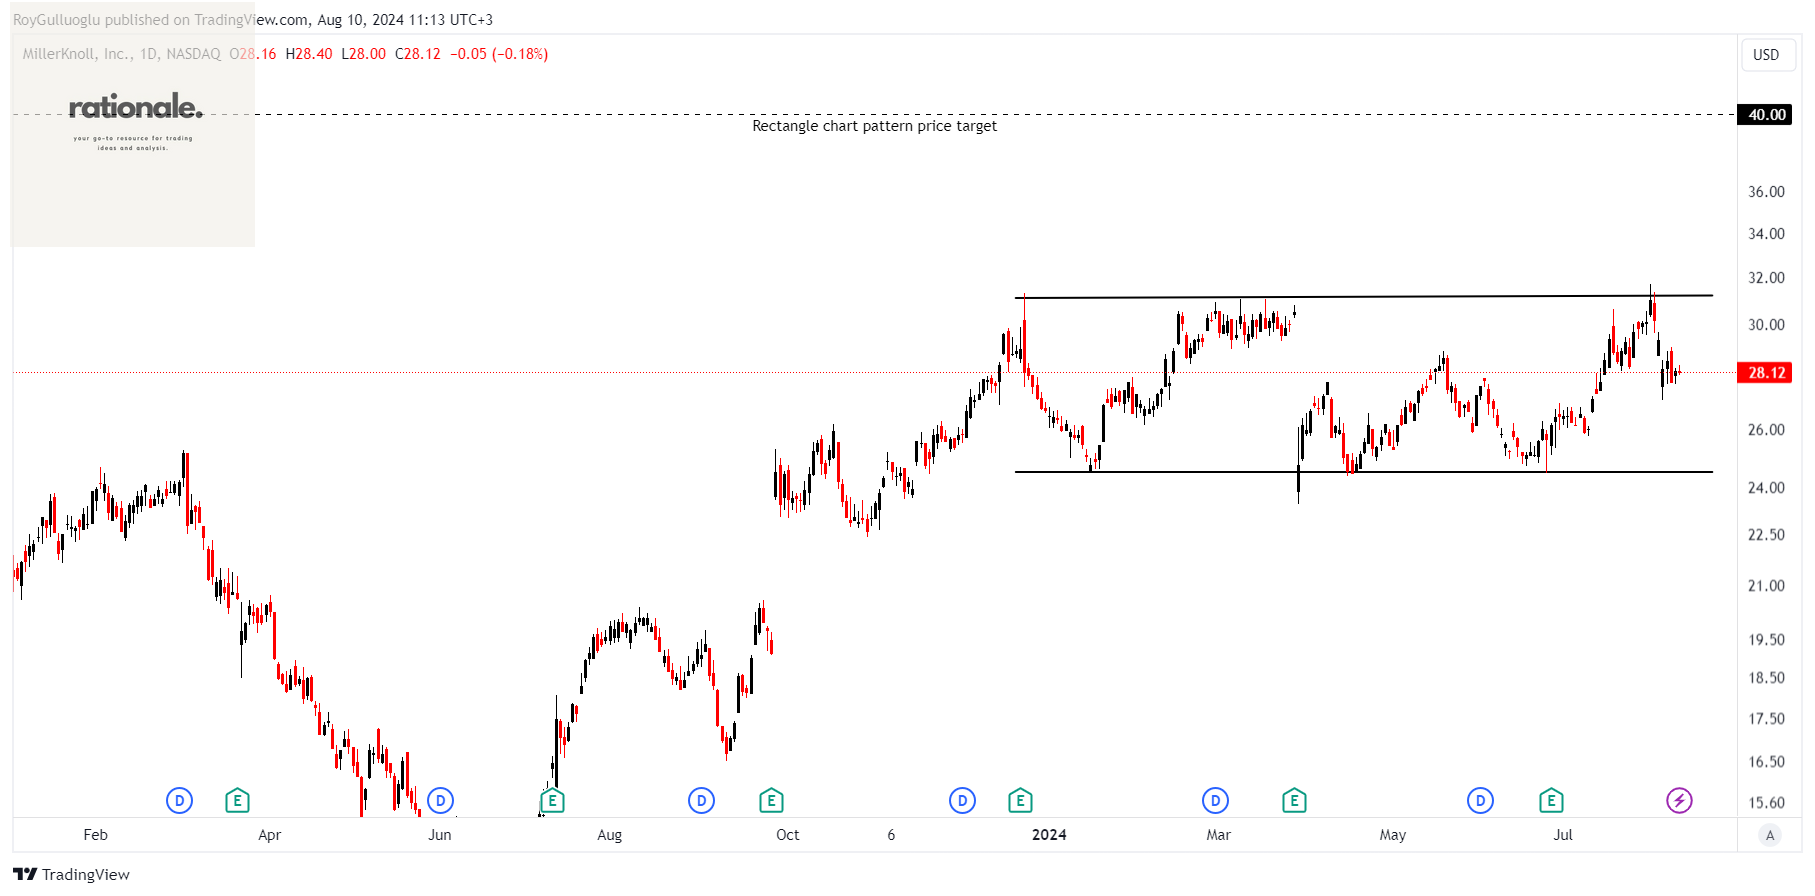
MillerKnoll, Inc. researches, designs, manufactures, and distributes interior furnishings globally. The company operates through three segments: Americas Contract, International Contract & Specialty, and Global Retail.
The above daily chart formed an approximately 5-month-long rectangle chart pattern as a bullish continuation after an uptrend.
The horizontal boundary at 31.22 levels acts as a resistance within this pattern.
A daily close above 32.15 levels would validate the breakout from the 5-month-long rectangle chart pattern.
Based on this chart pattern, the potential price target is 40 levels.
MLKN, classified under the "consumer cyclical" sector, falls under the “Small Cap - Growth” stock category.
CyberArk Software Ltd.-(CYBR/NASDAQ)-Long Idea
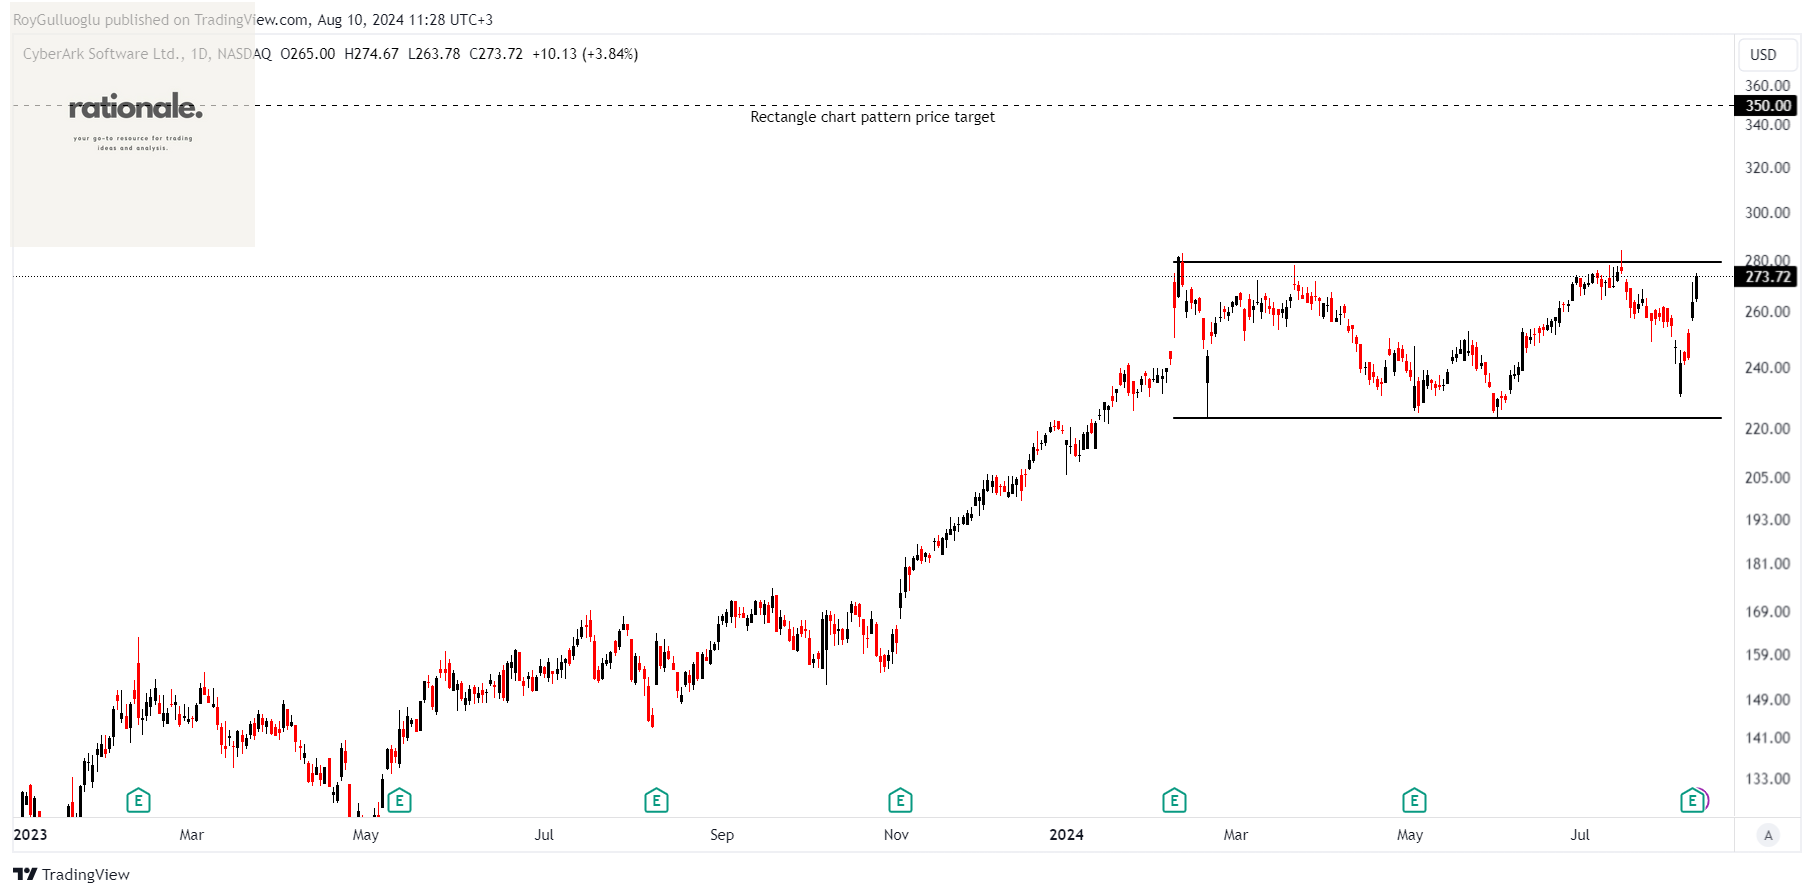
CyberArk Software Ltd., along with its subsidiaries, develops, markets, and sells software-based identity security solutions and services across the United States, Europe, the Middle East, Africa, and globally.
The above daily chart formed an approximately 4-month-long rectangle chart pattern as a bullish continuation after an uptrend.
The horizontal boundary at 273.72 levels acts as a resistance within this pattern.
A daily close above 281.94 levels would validate the breakout from the 4-month-long rectangle chart pattern.
Based on this chart pattern, the potential price target is 350 levels.
CYBR, classified under the "technology" sector, falls under the “Large Cap - Growth” stock category.
Soleno Therapeutics, Inc.-(SLNO/NASDAQ)-Long Idea
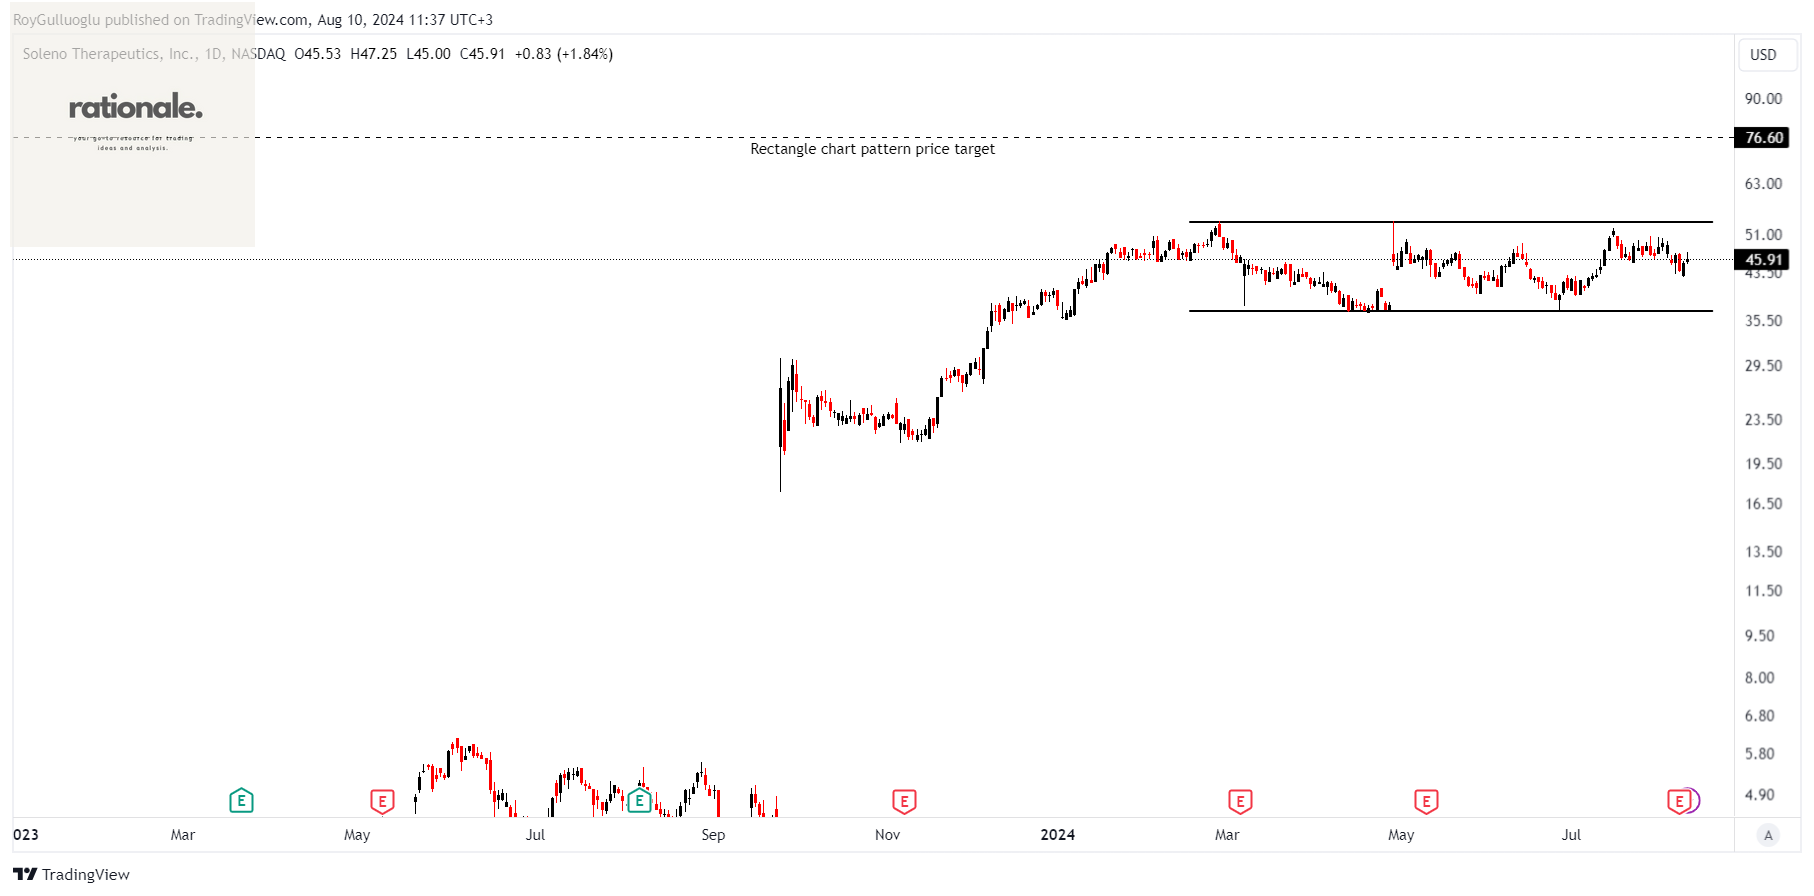
Soleno Therapeutics, Inc., a clinical-stage biopharmaceutical company, is dedicated to developing and commercializing innovative therapeutics for the treatment of rare diseases.
The above daily chart formed an approximately 4-month-long rectangle chart pattern as a bullish continuation after an uptrend.
The horizontal boundary at 53.71 levels acts as a resistance within this pattern.
A daily close above 55.32 levels would validate the breakout from the 4-month-long rectangle chart pattern.
Based on this chart pattern, the potential price target is 76.6 levels.
SLNO, classified under the "healthcare" sector, falls under the “Small Cap - Value” stock category.
Michelin-(ML/EURONEXT)-Short Idea
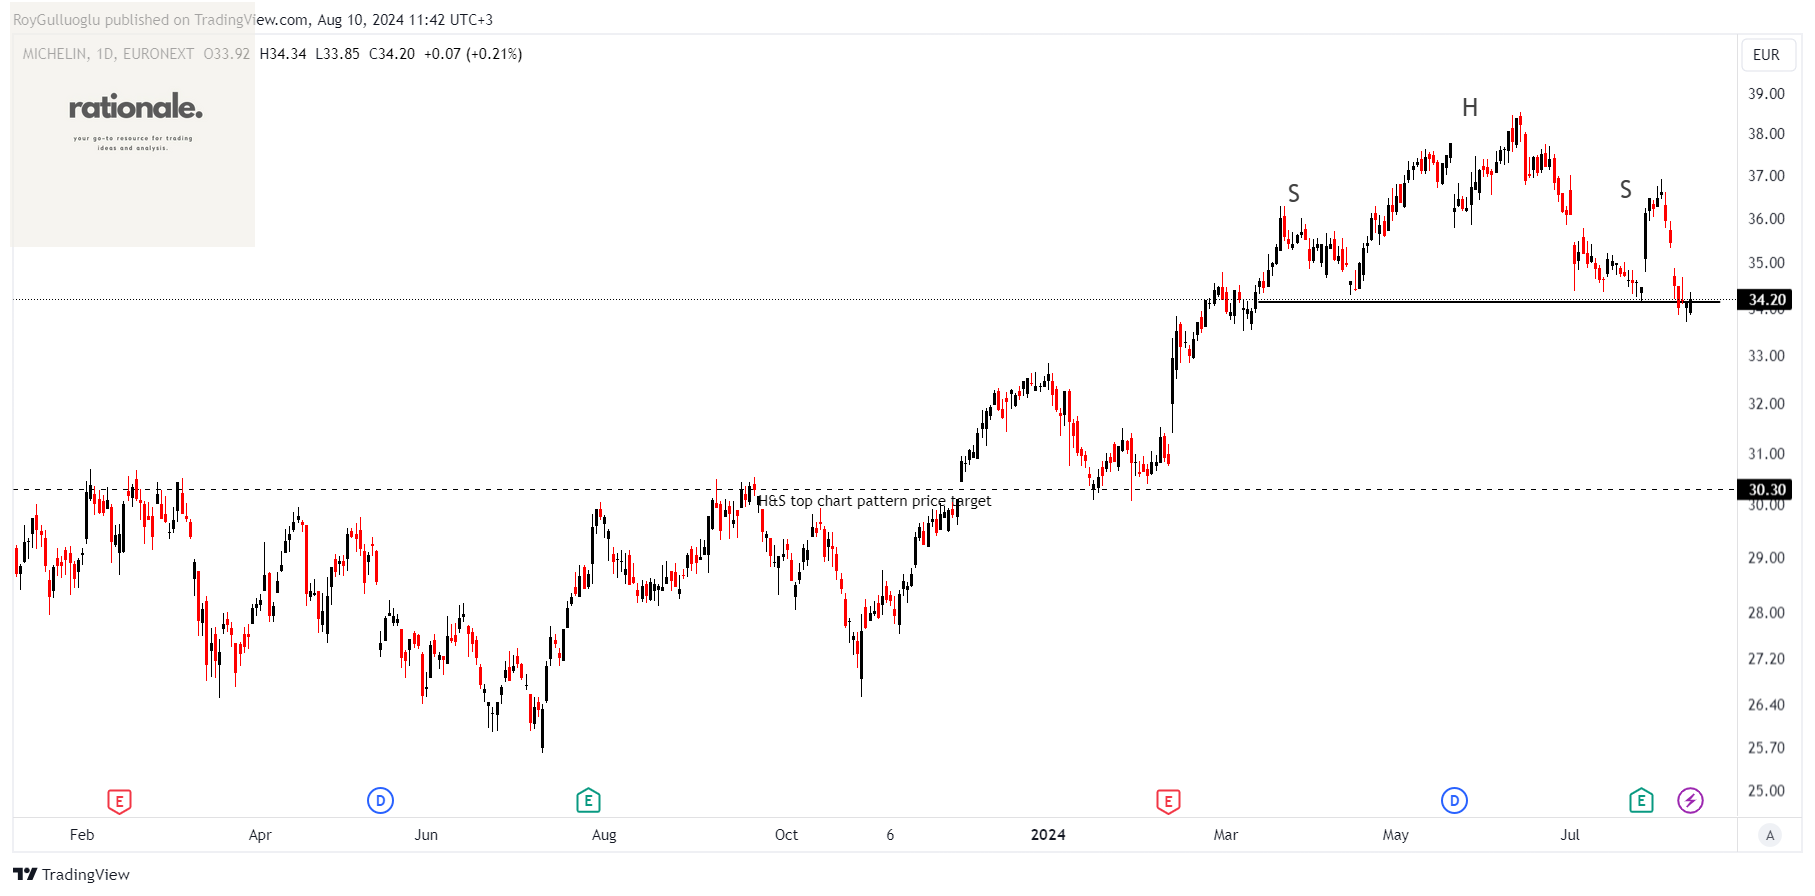
The company designs, manufactures, and sells tires for a wide range of vehicles, including cars, trucks, motorcycles, airplanes, and industrial machinery. In addition to tires, Michelin is also involved in publishing travel guides, maps, and road atlases.
The above daily chart formed an approximately 3-month-long H&S top chart pattern as a bullish reversal after an uptrend.
The horizontal boundary at 34.14 levels acts as a support within this pattern.
A daily close below 33.12 levels would validate the breakdown from the 3-month-long H&S top chart pattern.
Based on this chart pattern, the potential price target is 30.3 levels.
ML, classified under the "consumer cyclical" sector, falls under the “Large Cap - Growth” stock category.
Electrosteel Castings Limited-(ELECTCAST/NSE)-Long Idea
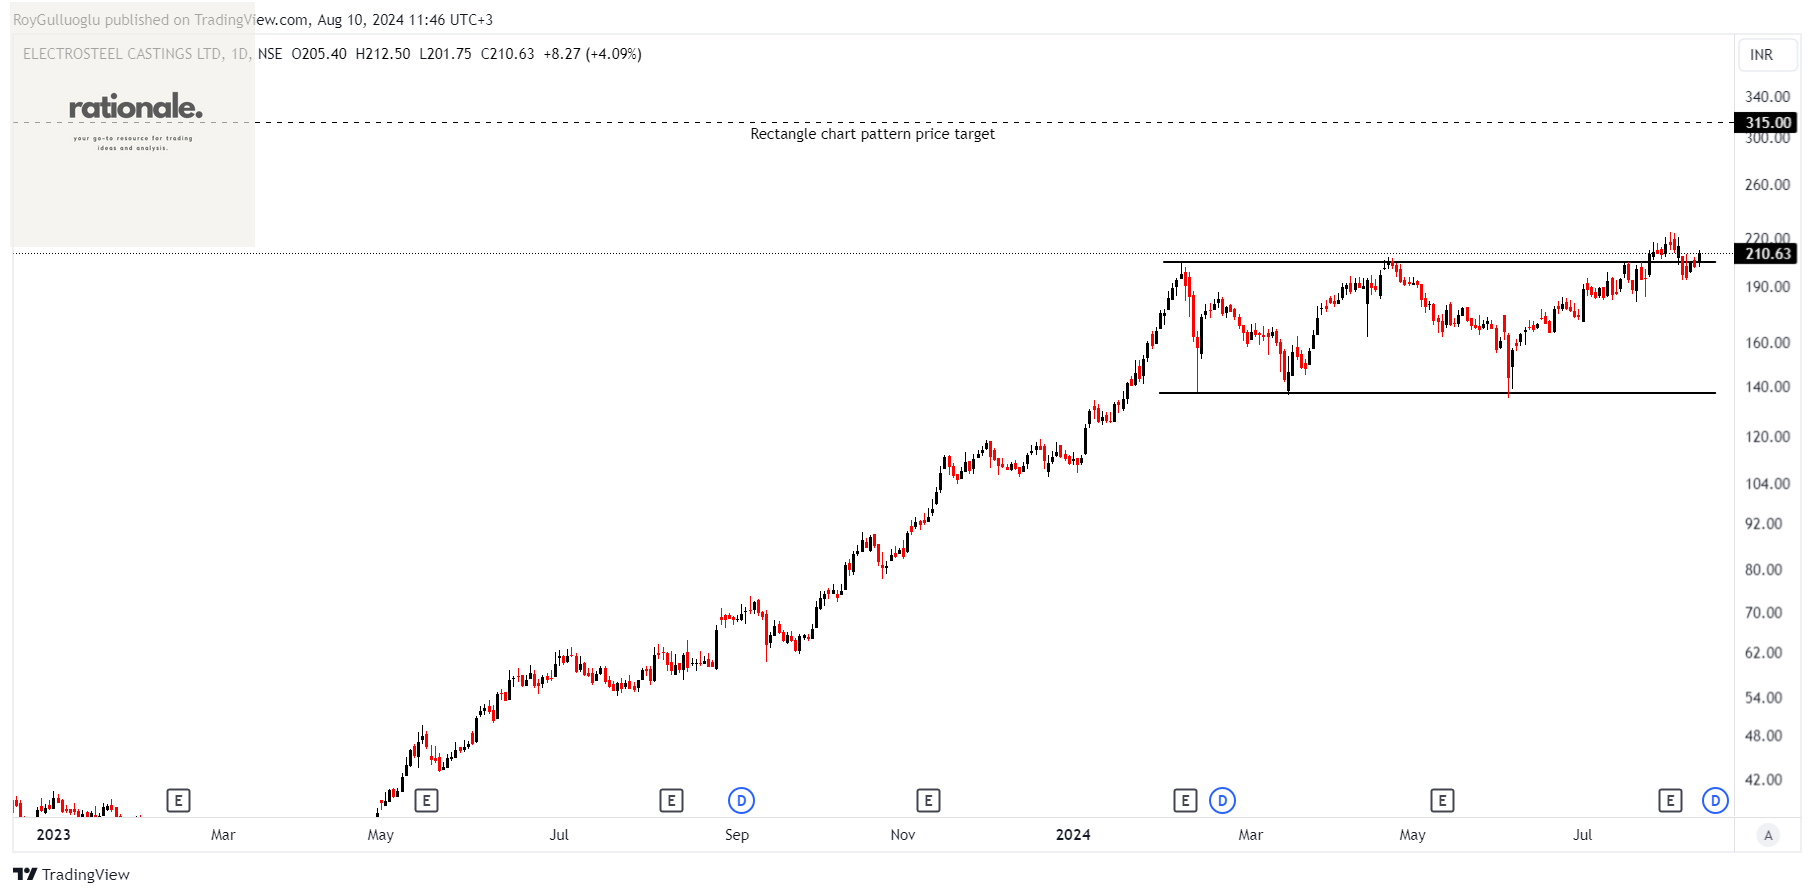
Electrosteel Castings Limited manufactures and supplies ductile iron (DI) pipes, ductile iron fittings (DIF), and accessories, as well as cast iron (CI) pipes, serving both the Indian and international markets.
The above daily chart formed an approximately 4-month-long rectangle chart pattern as a bullish continuation after an uptrend.
The horizontal boundary at 205 levels acts as a resistance within this pattern.
A daily close above 211.15 levels would validate the breakout from the 4-month-long rectangle chart pattern.
Based on this chart pattern, the potential price target is 315 levels.
ELECTCAST, classified under the "basic materials" sector, falls under the “Small Cap - Value” stock category.
Supriya Lifescience Limited-(SUPRIYA/NSE)-Long Idea
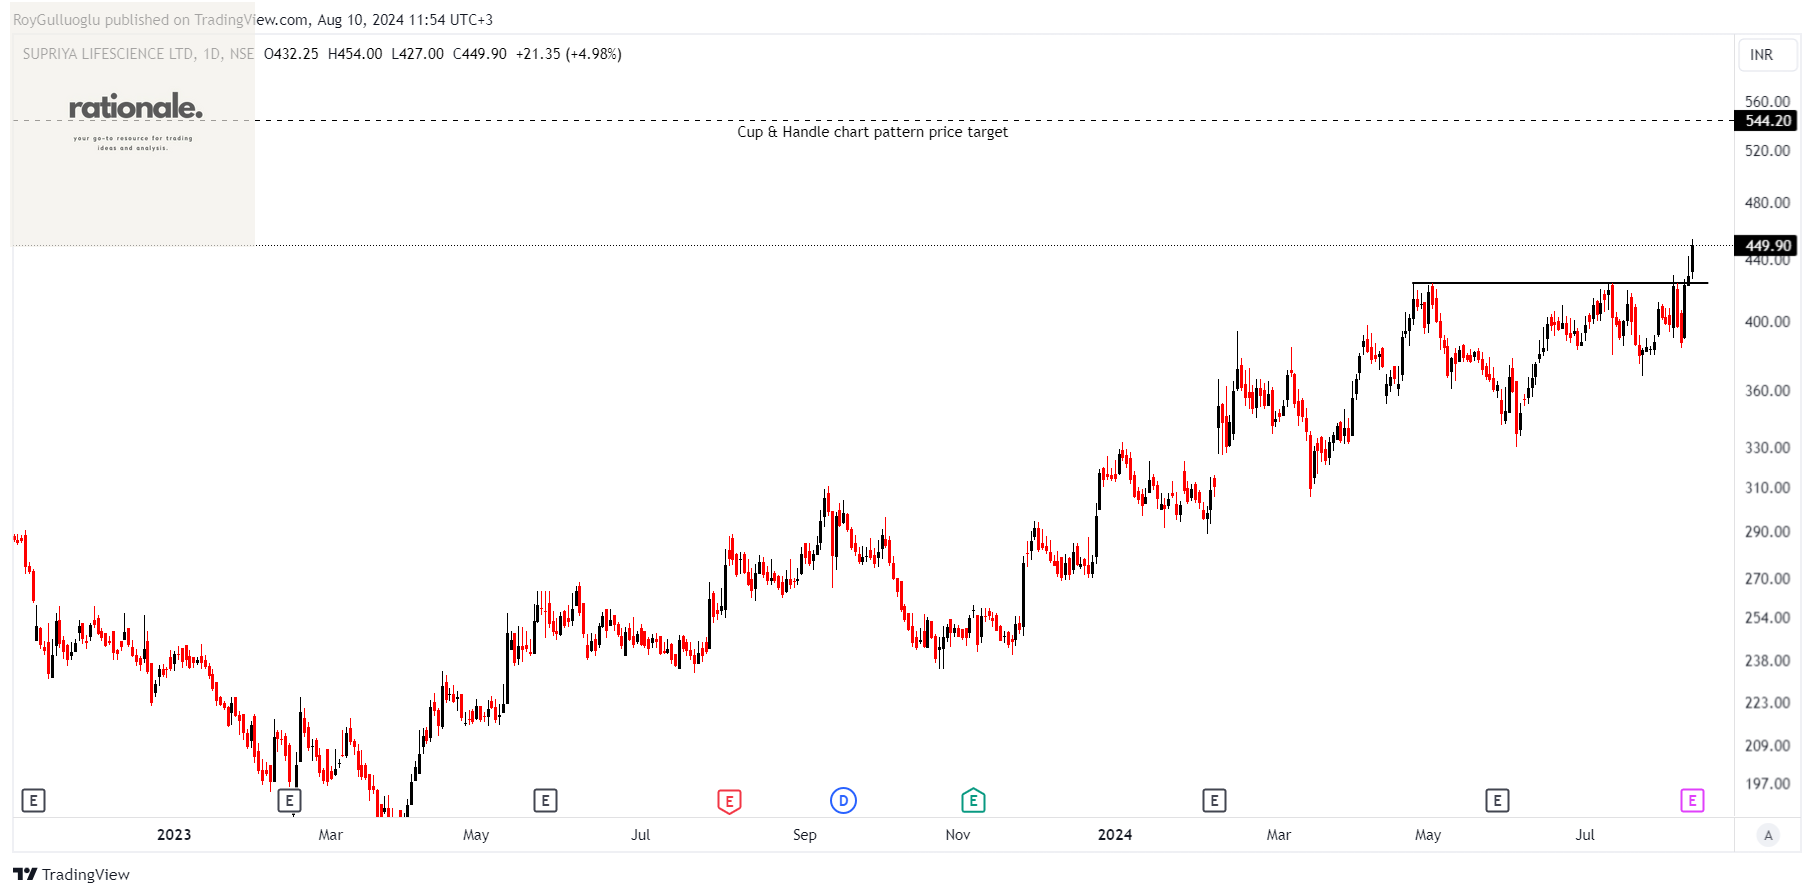
Supriya Lifescience Limited is involved in the research and development, manufacturing, and sale of bulk drugs and pharmaceutical chemicals on a global scale.
The above daily chart formed an approximately 2-month-long cup & handle chart pattern as a bullish continuation after an uptrend.
The horizontal boundary at 424 levels acted as a resistance within this pattern.
A daily close above 436.72 levels validated the breakout from the 2-month-long cup & handle chart pattern.
Based on this chart pattern, the potential price target is 544.2 levels.
SUPRIYA, classified under the "healthcare" sector, falls under the “Small Cap - Value” stock category.