


Napco Security Technologies, Inc.-(NSSC/NASDAQ)-Short Idea
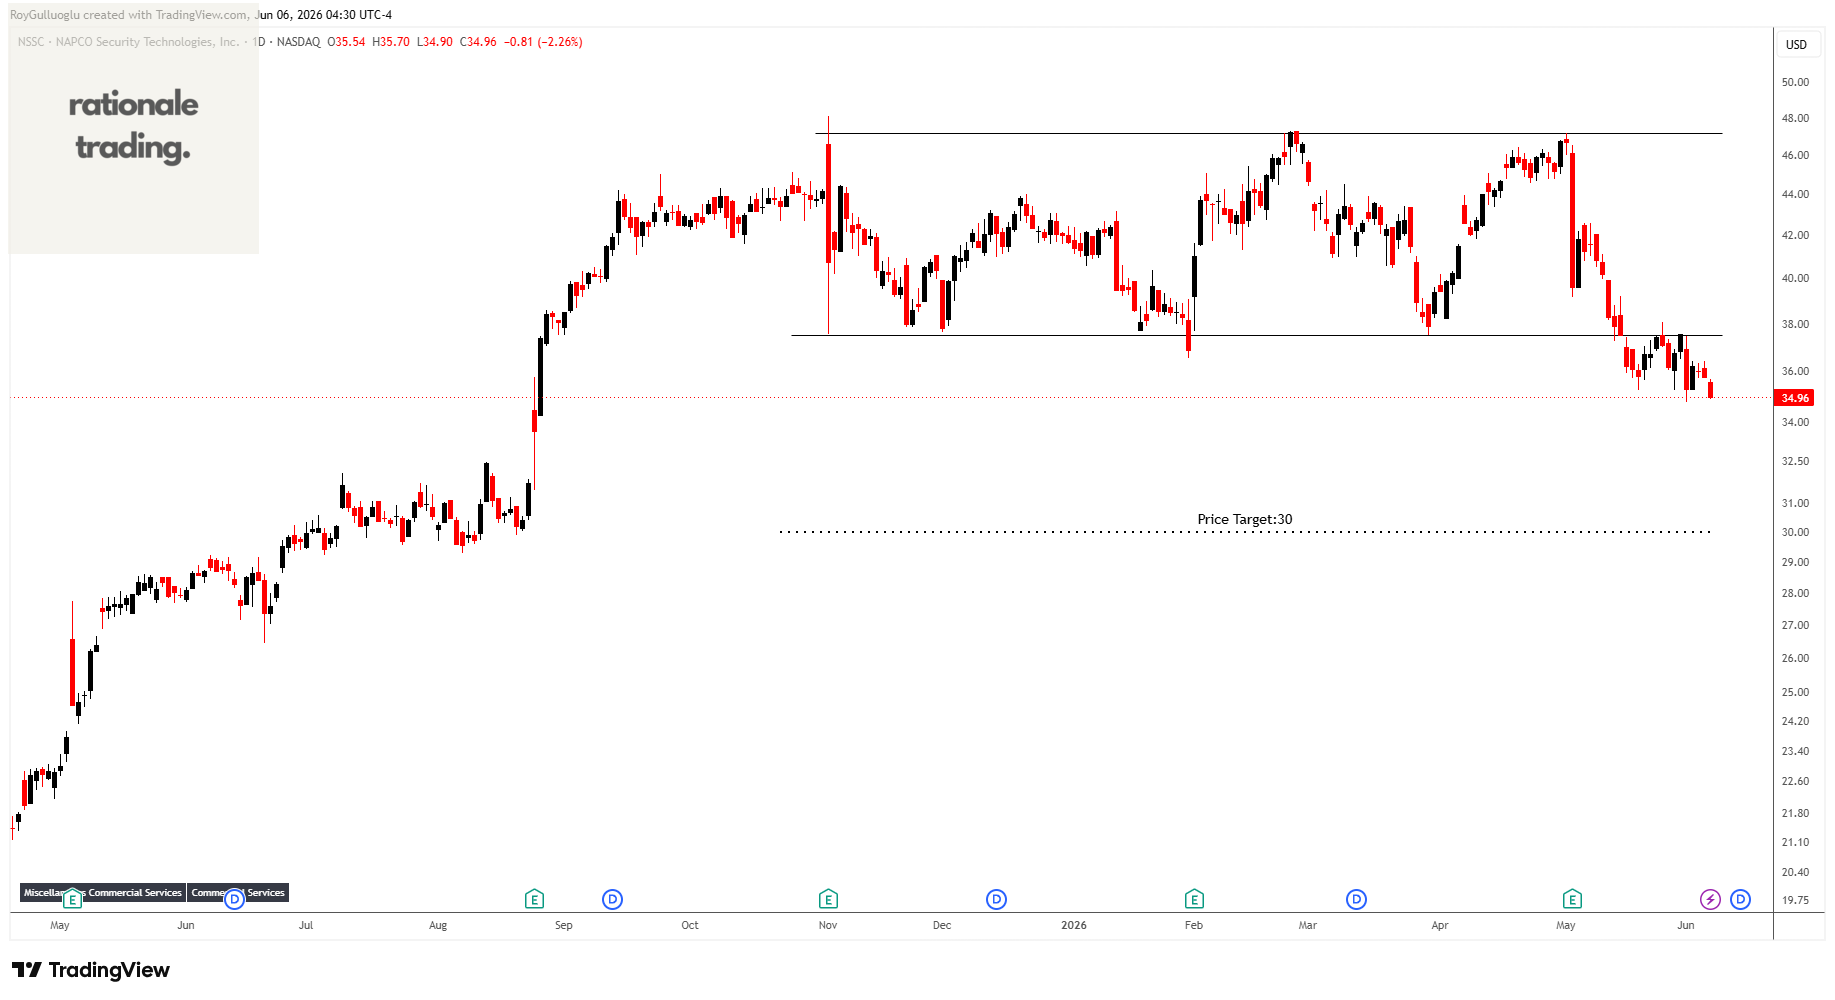
Napco Security Technologies, Inc. engages in the development, manufacturing, and sale of electronic security systems for commercial, residential, institutional, industrial, and governmental applications in the United States and internationally.
The above daily chart formed an approximately 4-month-long rectangle chart pattern as a bearish reversal after an uptrend.
The horizontal boundary at 37.52 levels acted as a support within this pattern.
A daily close below 36.5 levels validated the breakdown from the 4-month-long rectangle chart pattern.
Based on this chart pattern, the potential price target is 30 levels.
Ulta Beauty, Inc.-(ULTA/NASDAQ)-Short Idea
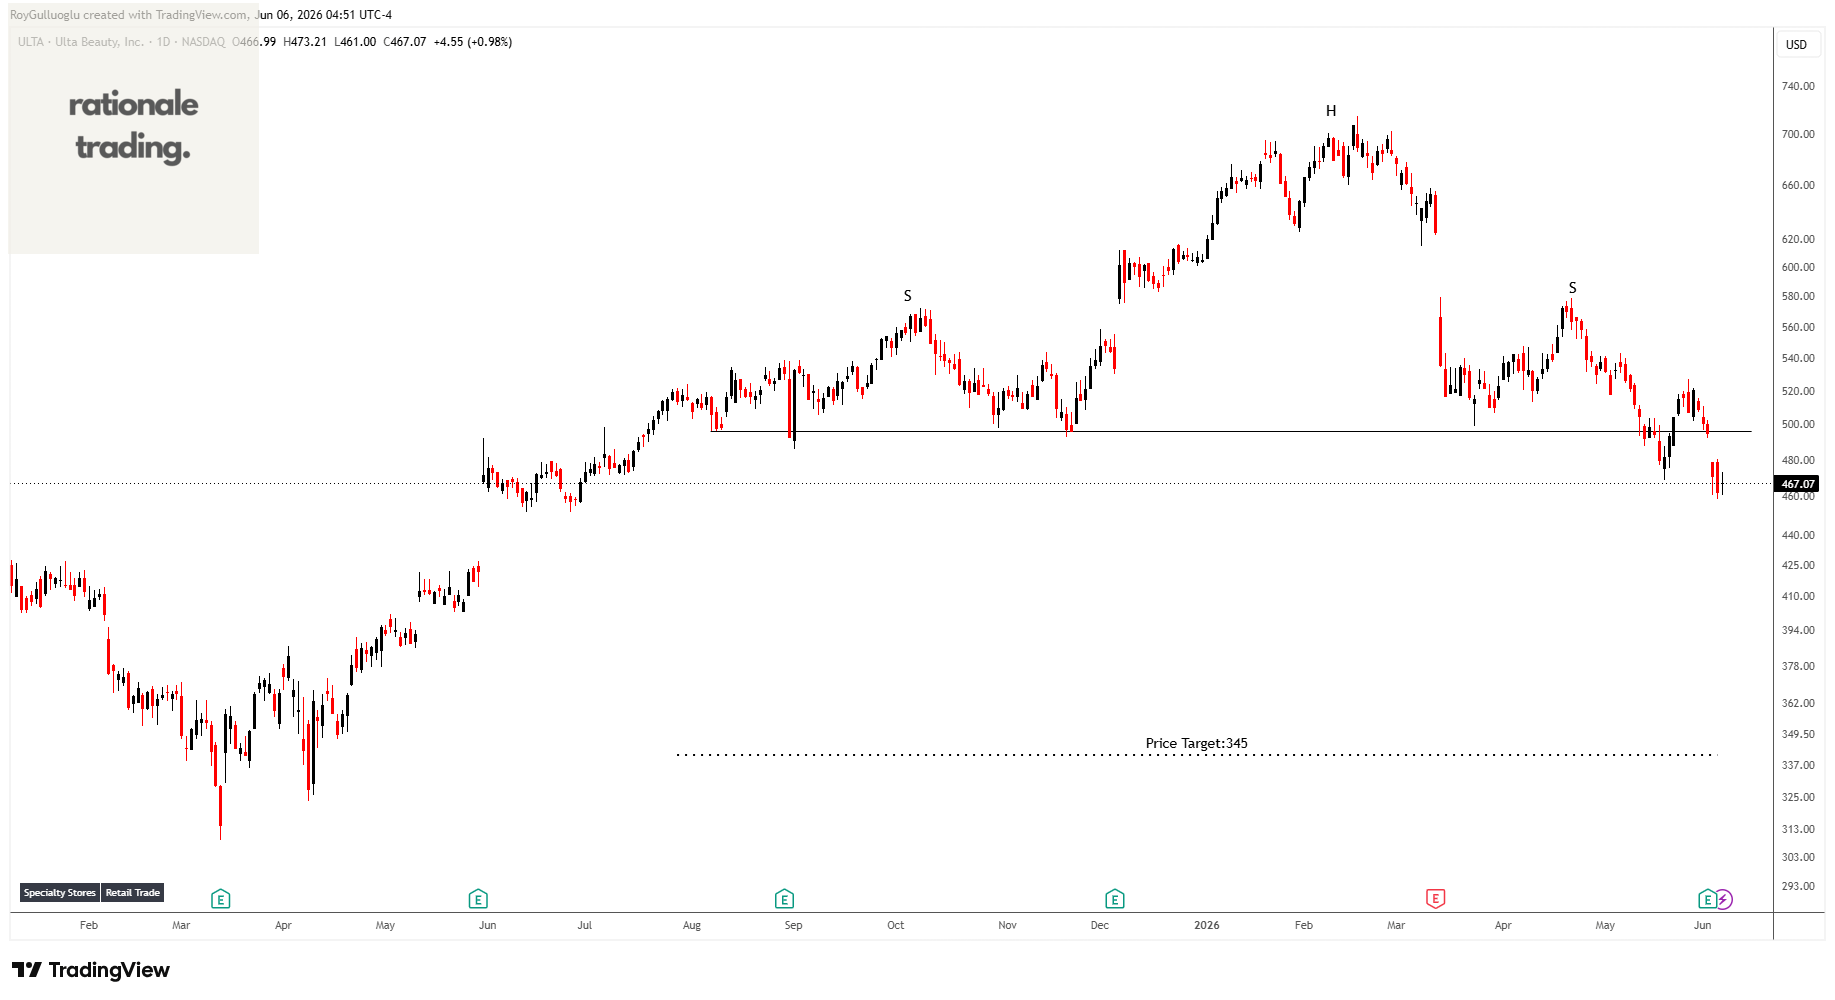
Ulta Beauty, Inc. operates as a specialty beauty retailer in the United States, Mexico, and Kuwait.
The above daily chart formed an approximately 6-month-long H&S top chart pattern as a bearish reversal after an uptrend.
The horizontal boundary at 496.26 levels acted as a support within this pattern.
A daily close below 481.4 levels validated the breakdown from the 6-month-long H&S top chart pattern.
Based on this chart pattern, the potential price target is 345 levels.
Palantir Technologies Inc.-(PLTR/NASDAQ)-Short Idea
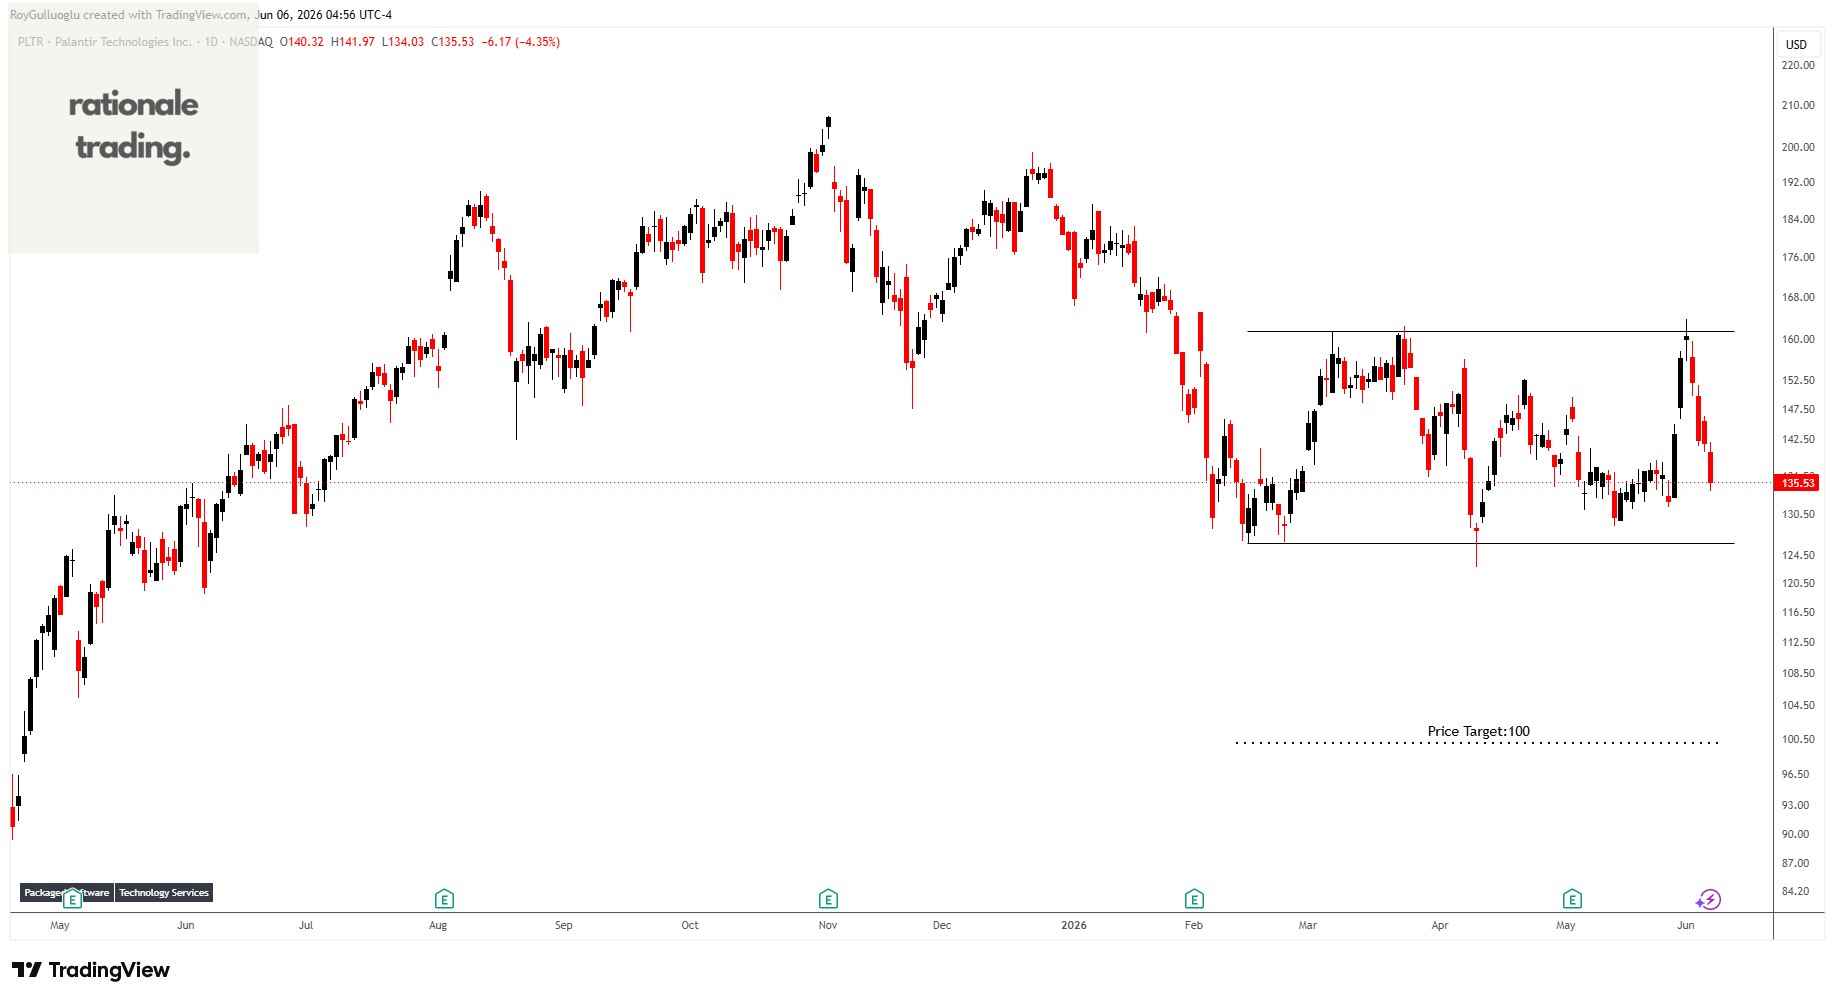
Palantir Technologies Inc. builds and deploys software platforms for the intelligence community to assist in counterterrorism investigations and operations in the United States, the United Kingdom, and internationally.
The above daily chart formed an approximately 3-month-long rectangle chart pattern as a bearish continuation after a downtrend.
The horizontal boundary at 126.23 levels acts as a support within this pattern.
A daily close below 122.5 levels would validate the breakdown from the 3-month-long rectangle chart pattern.
Based on this chart pattern, the potential price target is 100 levels.
Terex Corporation-(TEX/NYSE)-Short Idea
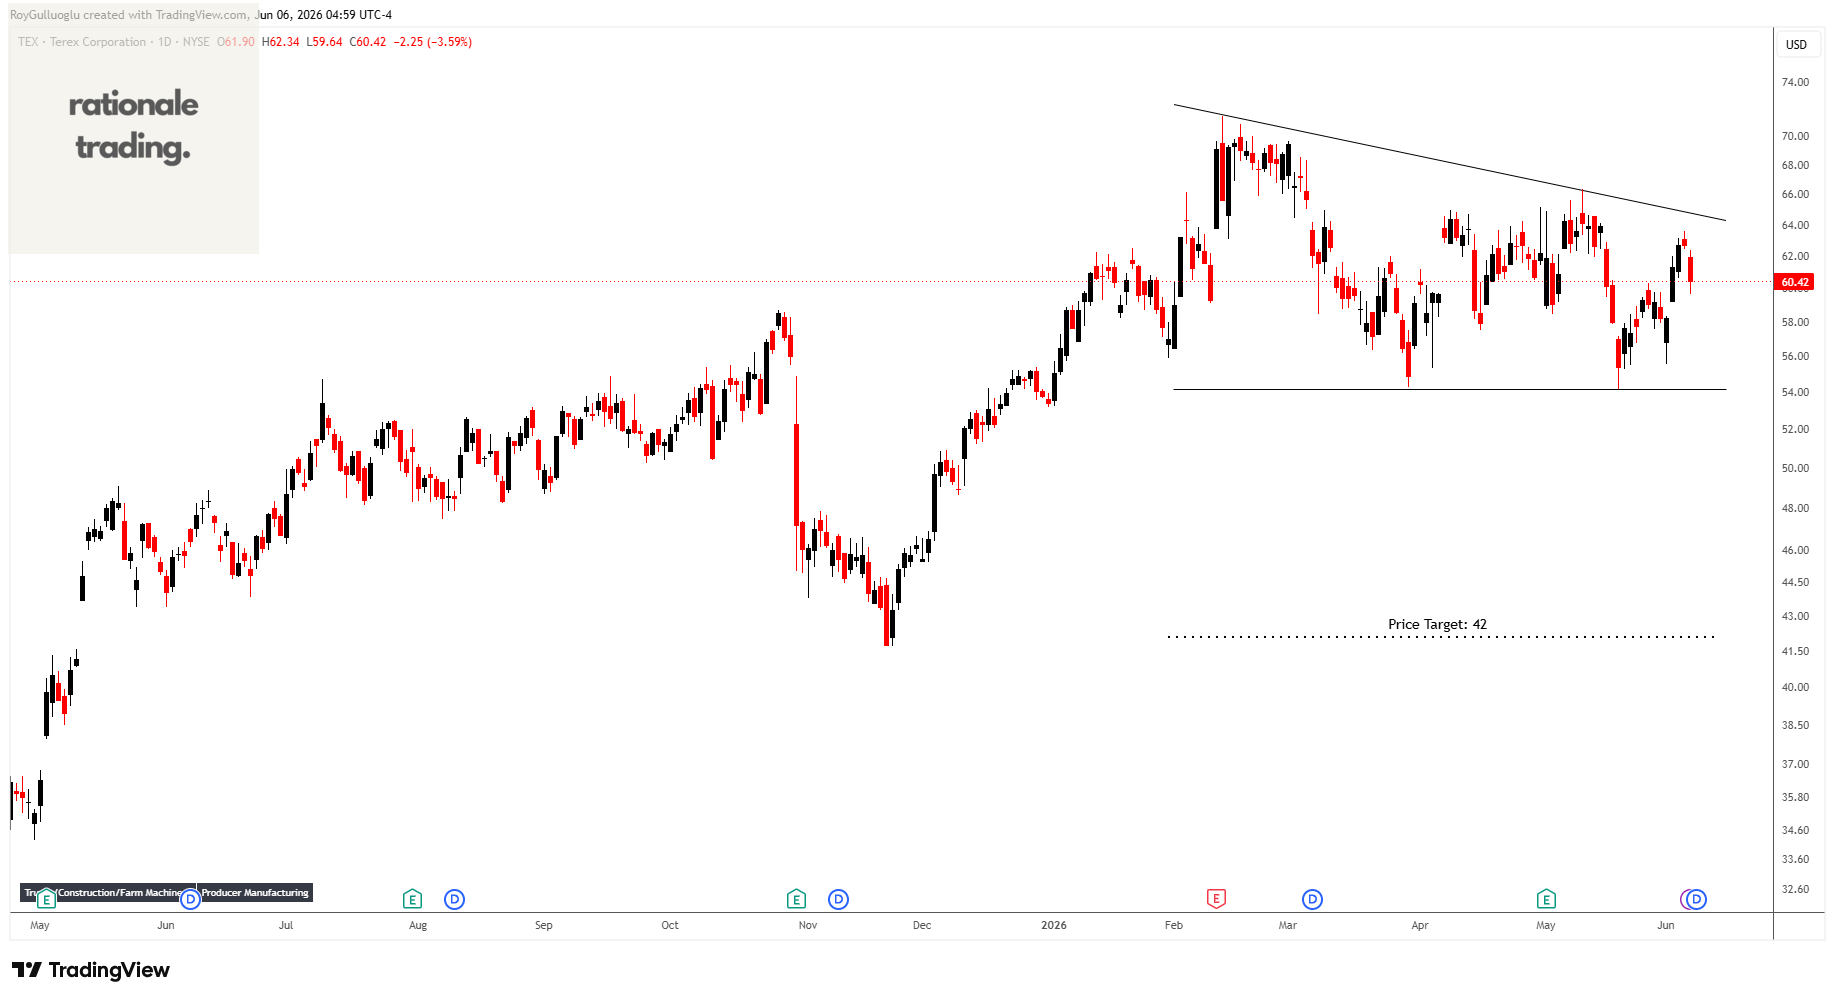
Terex Corporation manufactures industrial equipment for materials processing machinery, waste and recycling solutions, mobile elevating work platforms, and equipment for the electric utility industry worldwide.
The above daily chart formed an approximately 3-month-long descending triangle chart pattern as a bearish reversal after an uptrend.
The horizontal boundary at 54.17 levels acts as a support within this pattern.
A daily close below 52.5 levels would validate the breakdown from the 3-month-long rectangle chart pattern.
Based on this chart pattern, the potential price target is 42 levels.