


Sionna Therapeutics, Inc.-(SION/NASDAQ)-Long Idea
Sionna Therapeutics, Inc., a clinical-stage biopharmaceutical company, researches and develops medicines for the treatment of cystic fibrosis (CF).
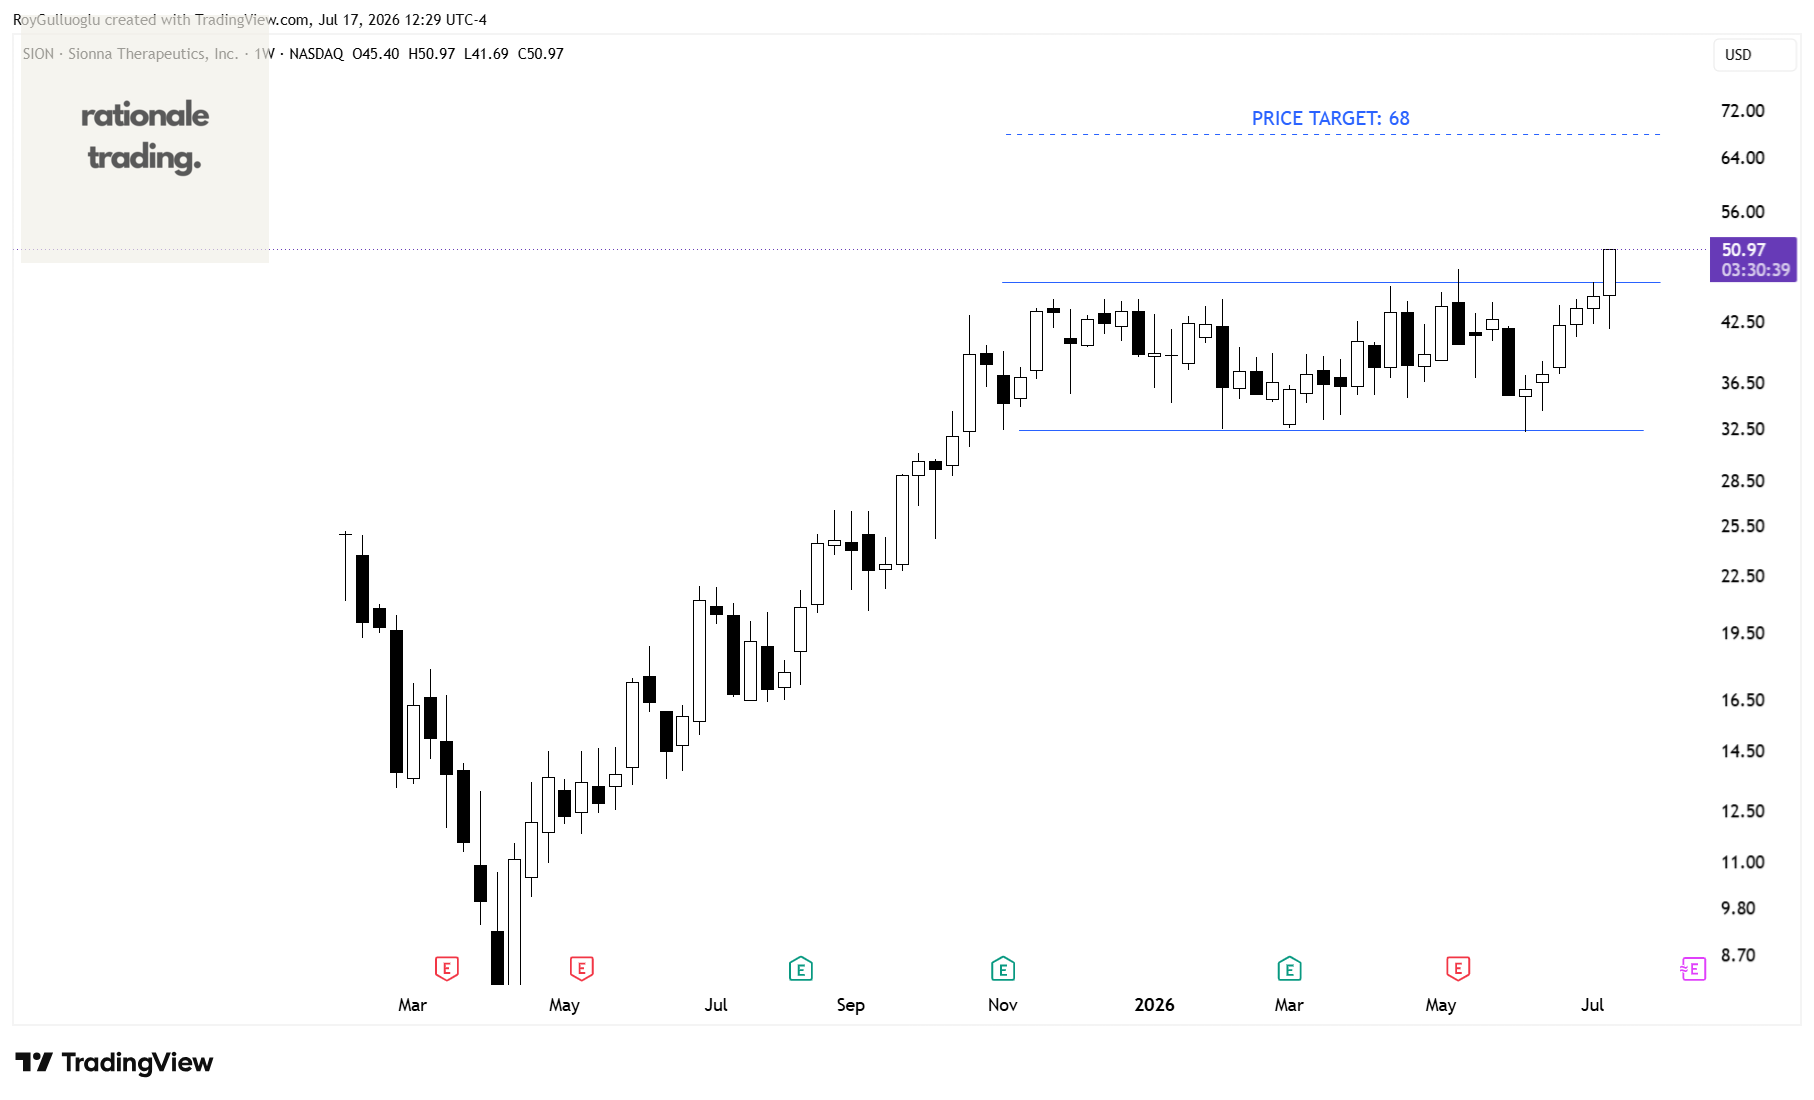
The above weekly chart formed an approximately 9-month-long rectangle chart pattern as a bullish continuation after an uptrend.
Within this pattern, the horizontal boundary at 46.98 levels acted as a resistance.
A daily close above 48.39 levels would validated the breakout from the 9-month-long rectangle chart pattern.
Based on this chart pattern, the potential price target is 68 levels.
The Procter & Gamble Company-(PG/NYSE)-Long Idea
The Procter & Gamble Company provides branded consumer packaged goods worldwide.
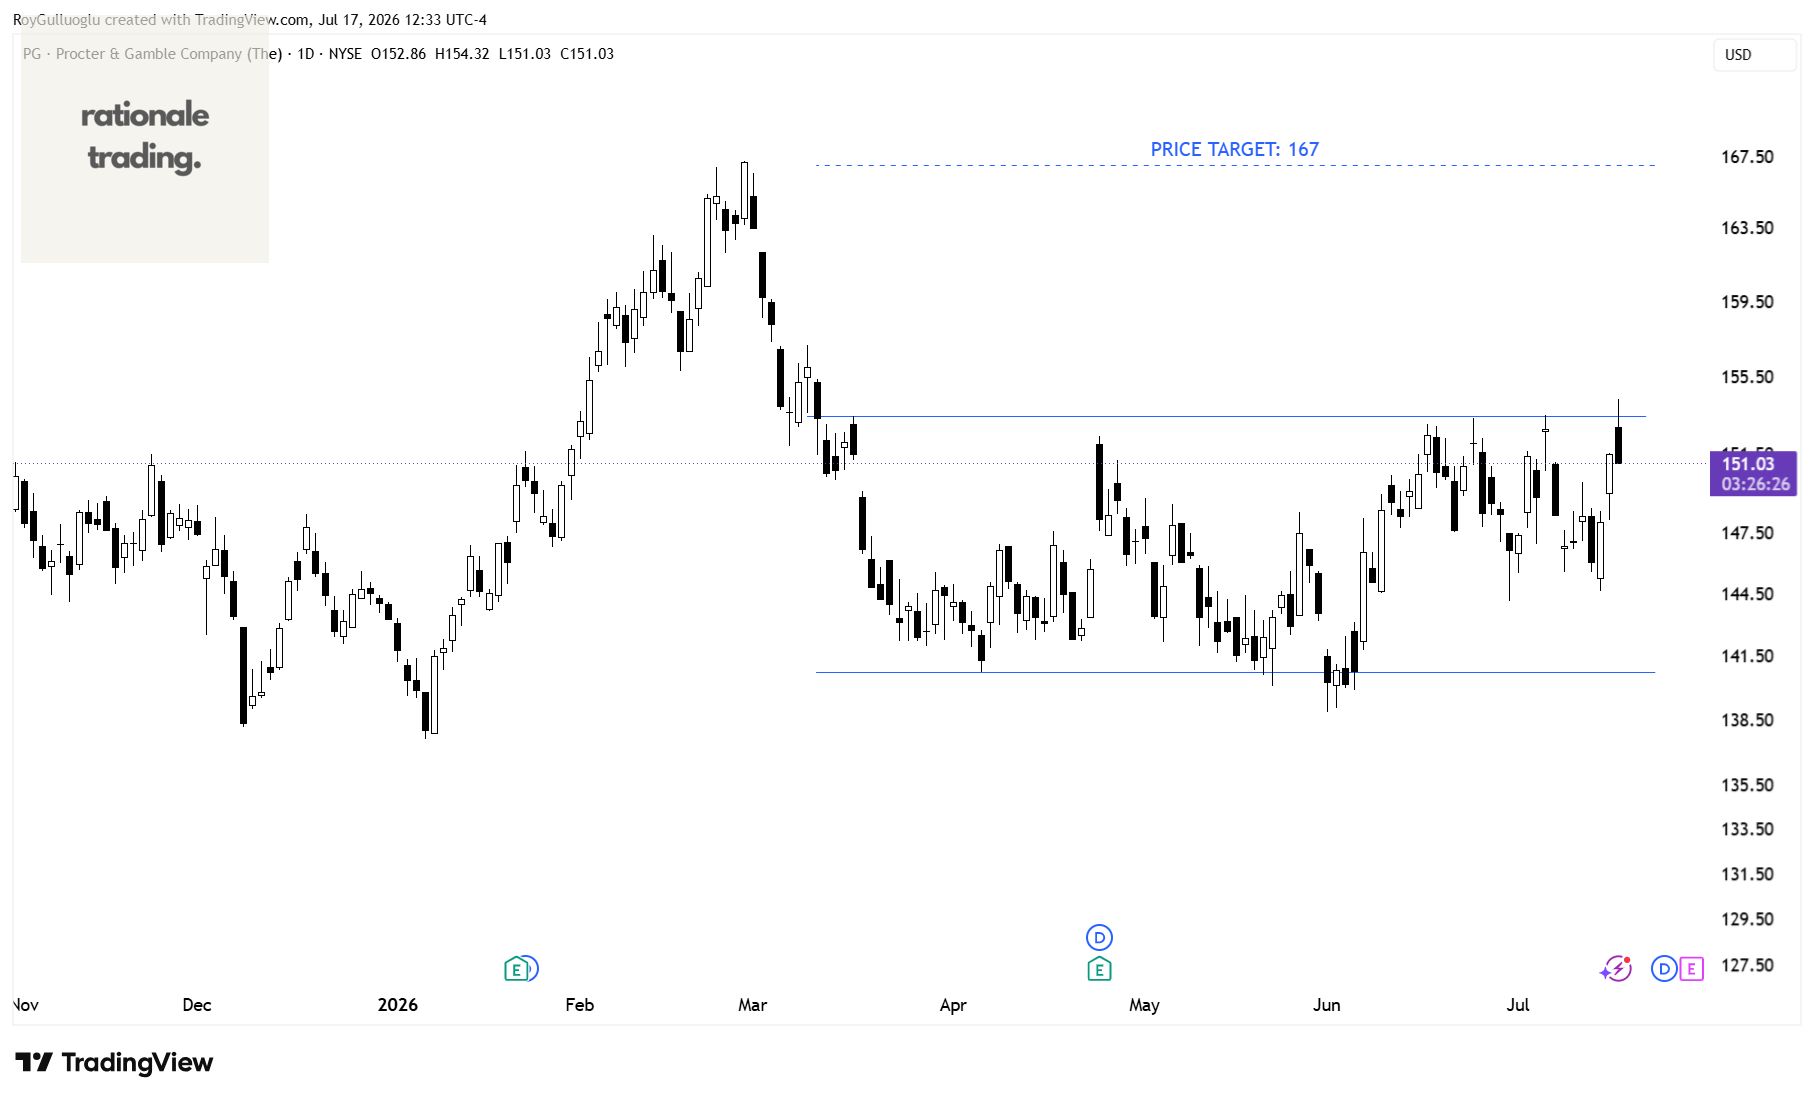
The above daily chart formed an approximately 3-month-long rectangle chart pattern as a bullish reversal after a downtrend.
Within this pattern, the horizontal boundary at 153.46 levels acts as a resistance.
A daily close above 158 levels would validate the breakout from the 3-month-long rectangle chart pattern .
Based on this chart pattern, the potential price target is 167 levels.
Madrigal Pharmaceuticals, Inc.-(MDGL/NASDAQ)-Long Idea
Madrigal Pharmaceuticals, Inc., a biopharmaceutical company, focuses on delivering novel therapeutics for metabolic dysfunction-associated steatohepatitis (MASH) in the United States.
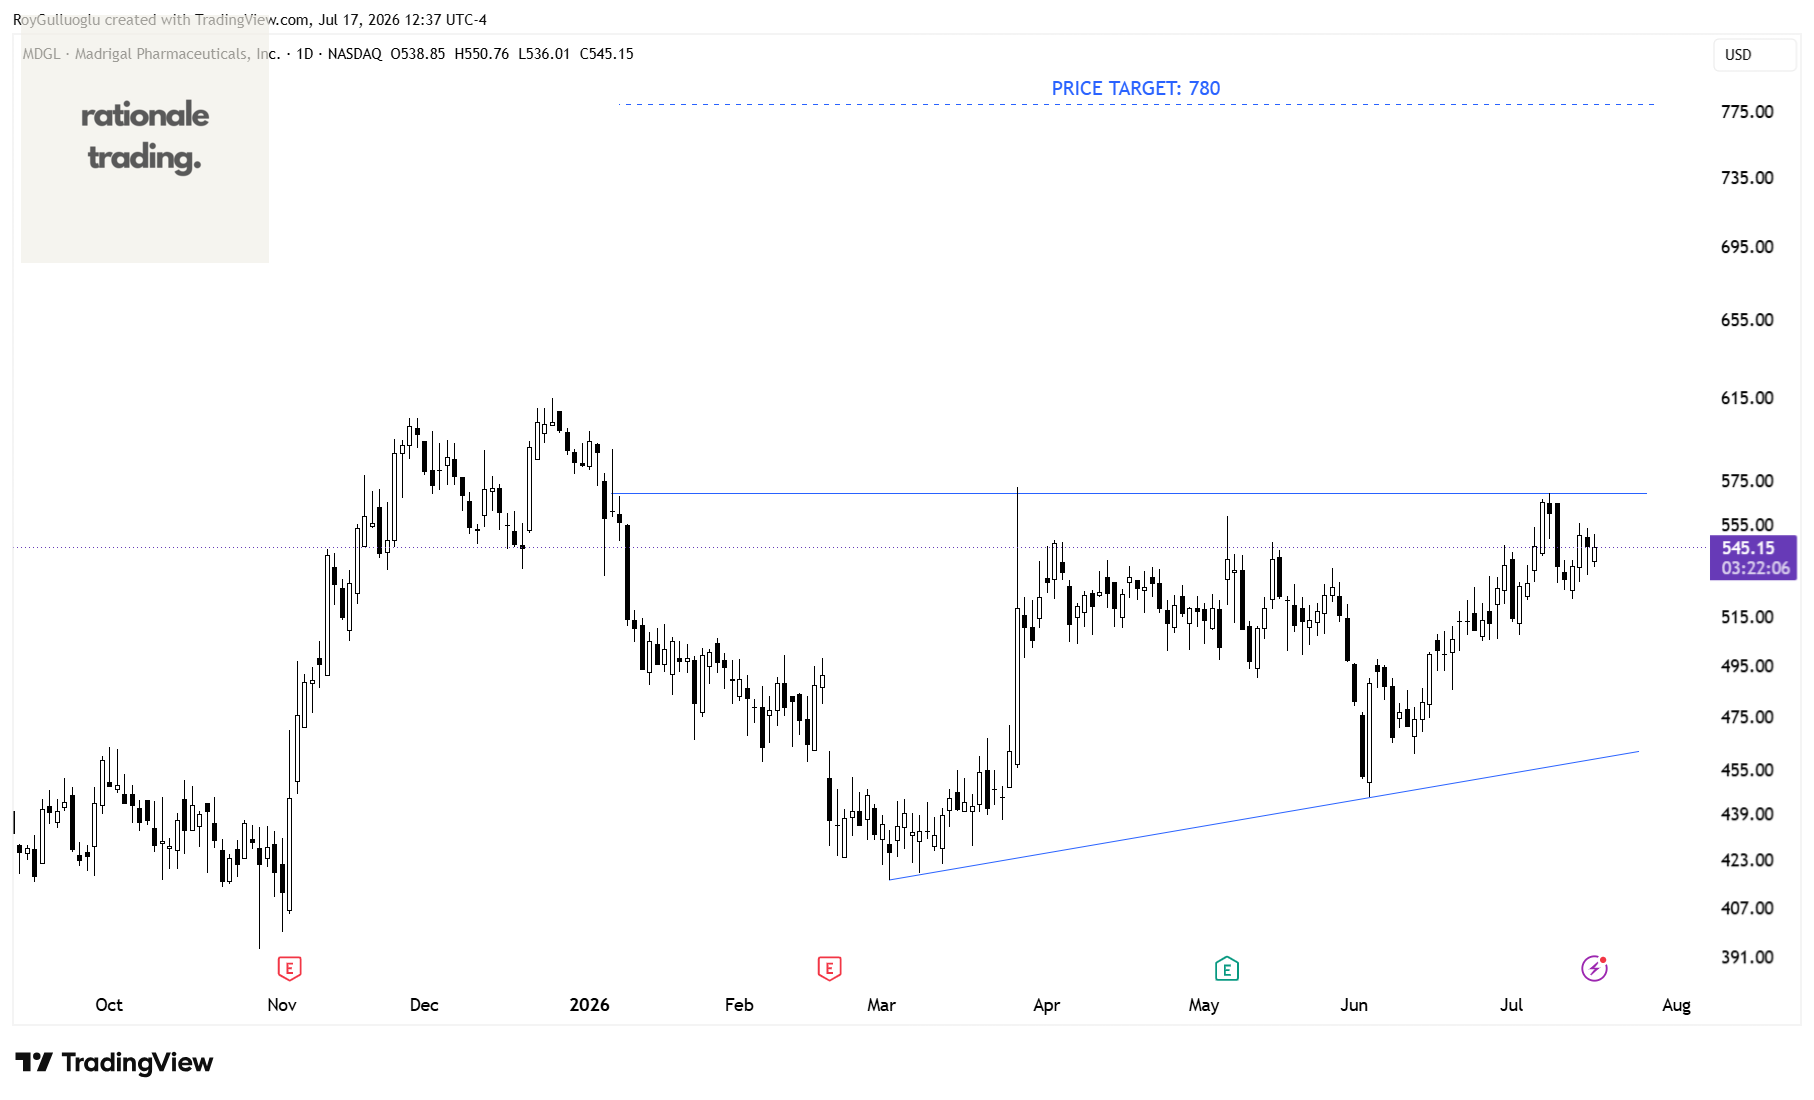
The above daily chart formed an approximately 4-month-long ascending triangle chart pattern as a bullish reversal after a downtrend.
Within this pattern, the horizontal boundary at 570 levels acts as a resistance.
A daily close above 587 levels would validate the breakout from the 4-month-long ascending triangle chart pattern.
Based on this chart pattern, the potential price target is 780 levels.
Toro Company-(TTC/NYSE)-Long Idea
The Toro Company provides professional turf maintenance equipment and services.
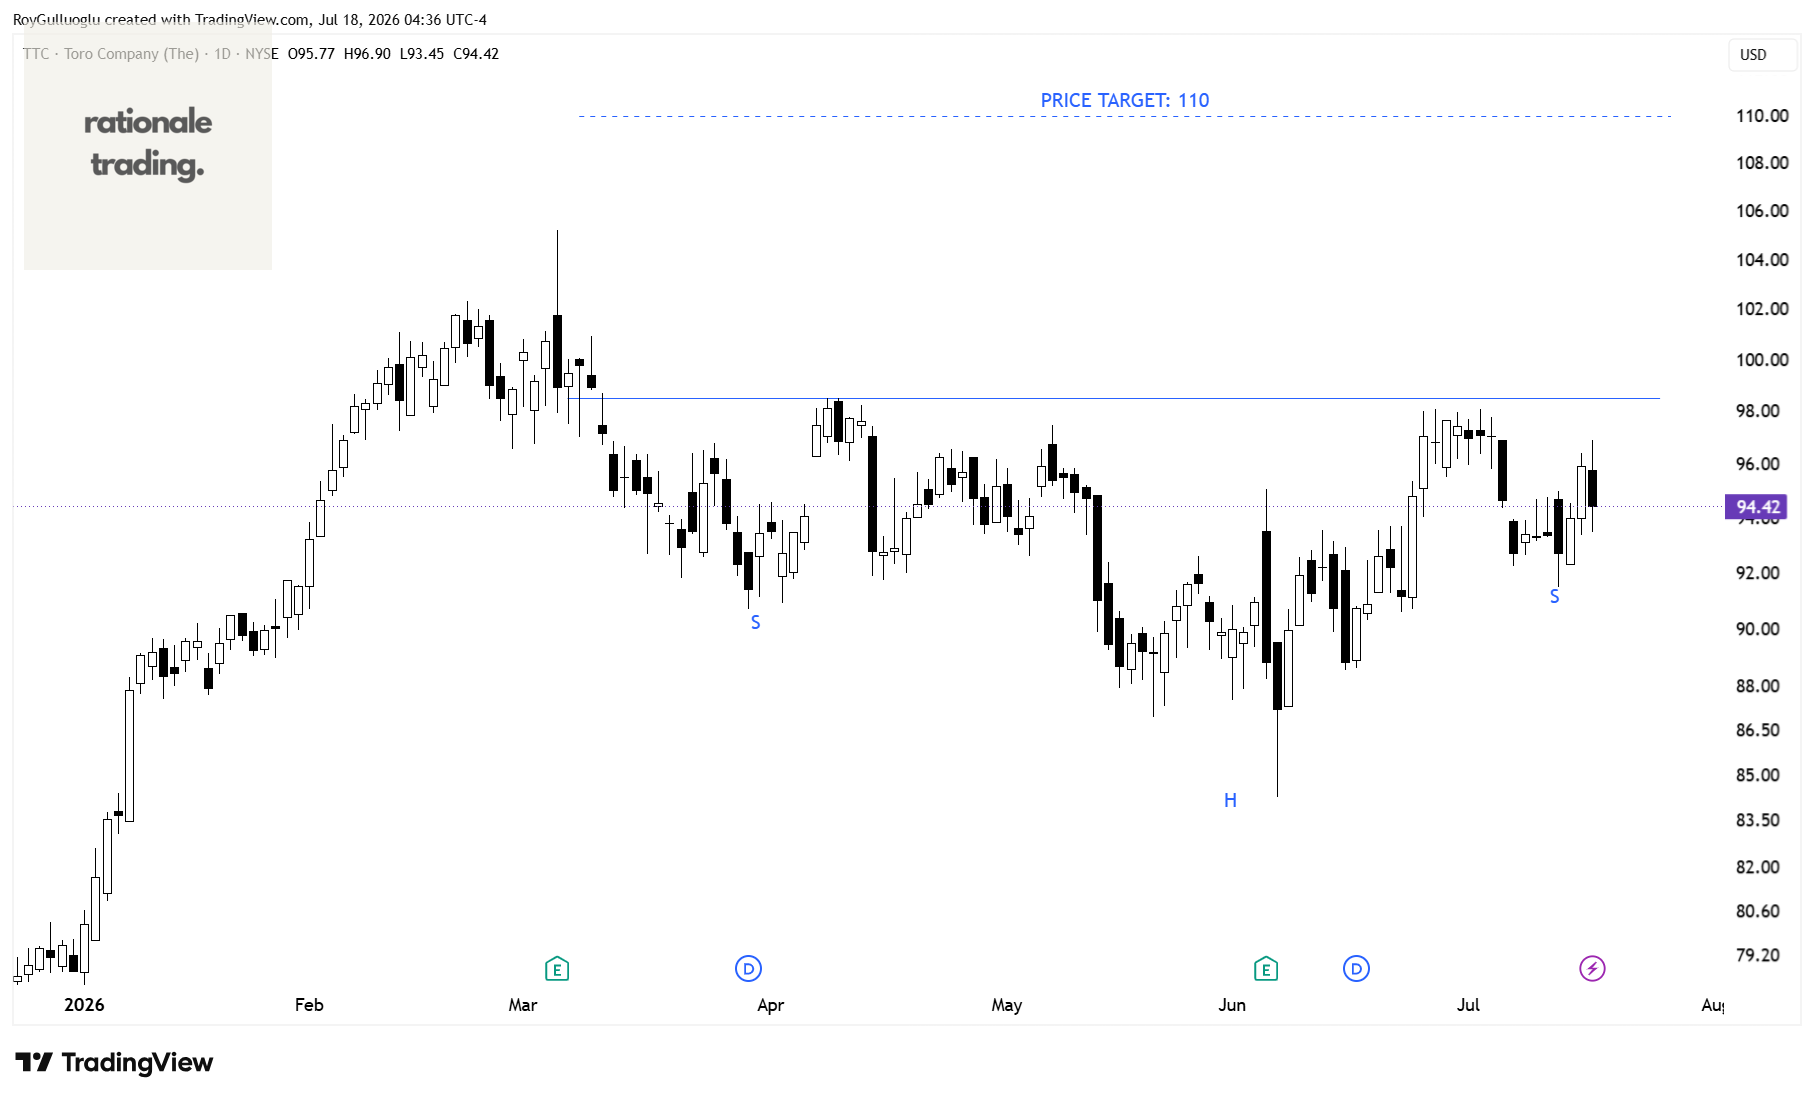
The above daily chart formed an approximately 3-month-long H&S bottom chart pattern as a bullish reversal after a downtrend.
Within this pattern, the horizontal boundary at 98.5 levels acts as a resistance.
A daily close above 101.45 levels would validate the breakout from the 3-month-long H&S bottom chart pattern.
Based on this chart pattern, the potential price target is 110 levels.
Teledyne Technologies Incorporated -(TDY/NYSE)-Long Idea
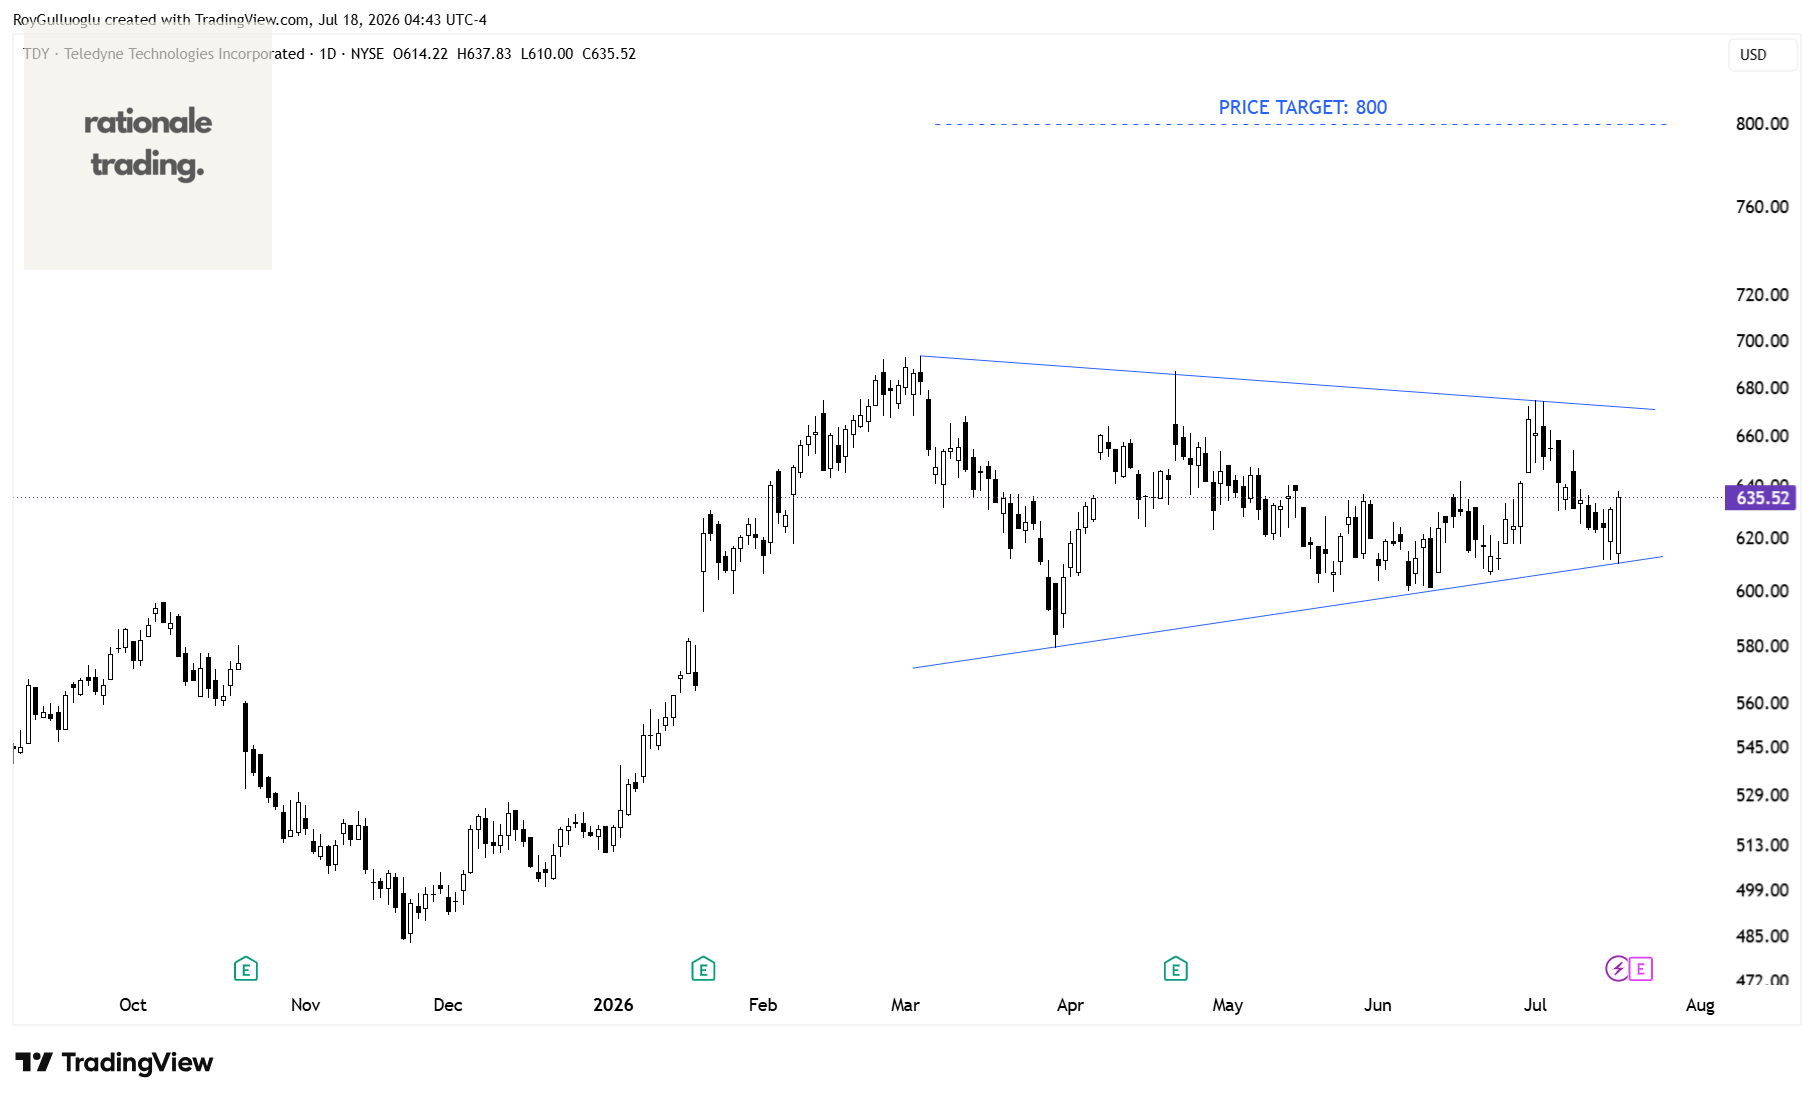
Teledyne Technologies Incorporated provides enabling technologies for industrial growth markets in the United States, Europe, Asia, and internationally.
The above daily chart formed an approximately 3-month-long symmetrical triangle chart pattern as a bullish continuation after an uptrend.
A daily close above 695 levels would validate the breakout from the 3-month-long symmetrical triangle chart pattern.
Based on this chart pattern, the potential price target is 800 levels.