


Gold.com, Inc.-(GOLD/NYSE)-Long Idea
Gold.com, Inc., together with its subsidiaries, operates as a precious metals company.
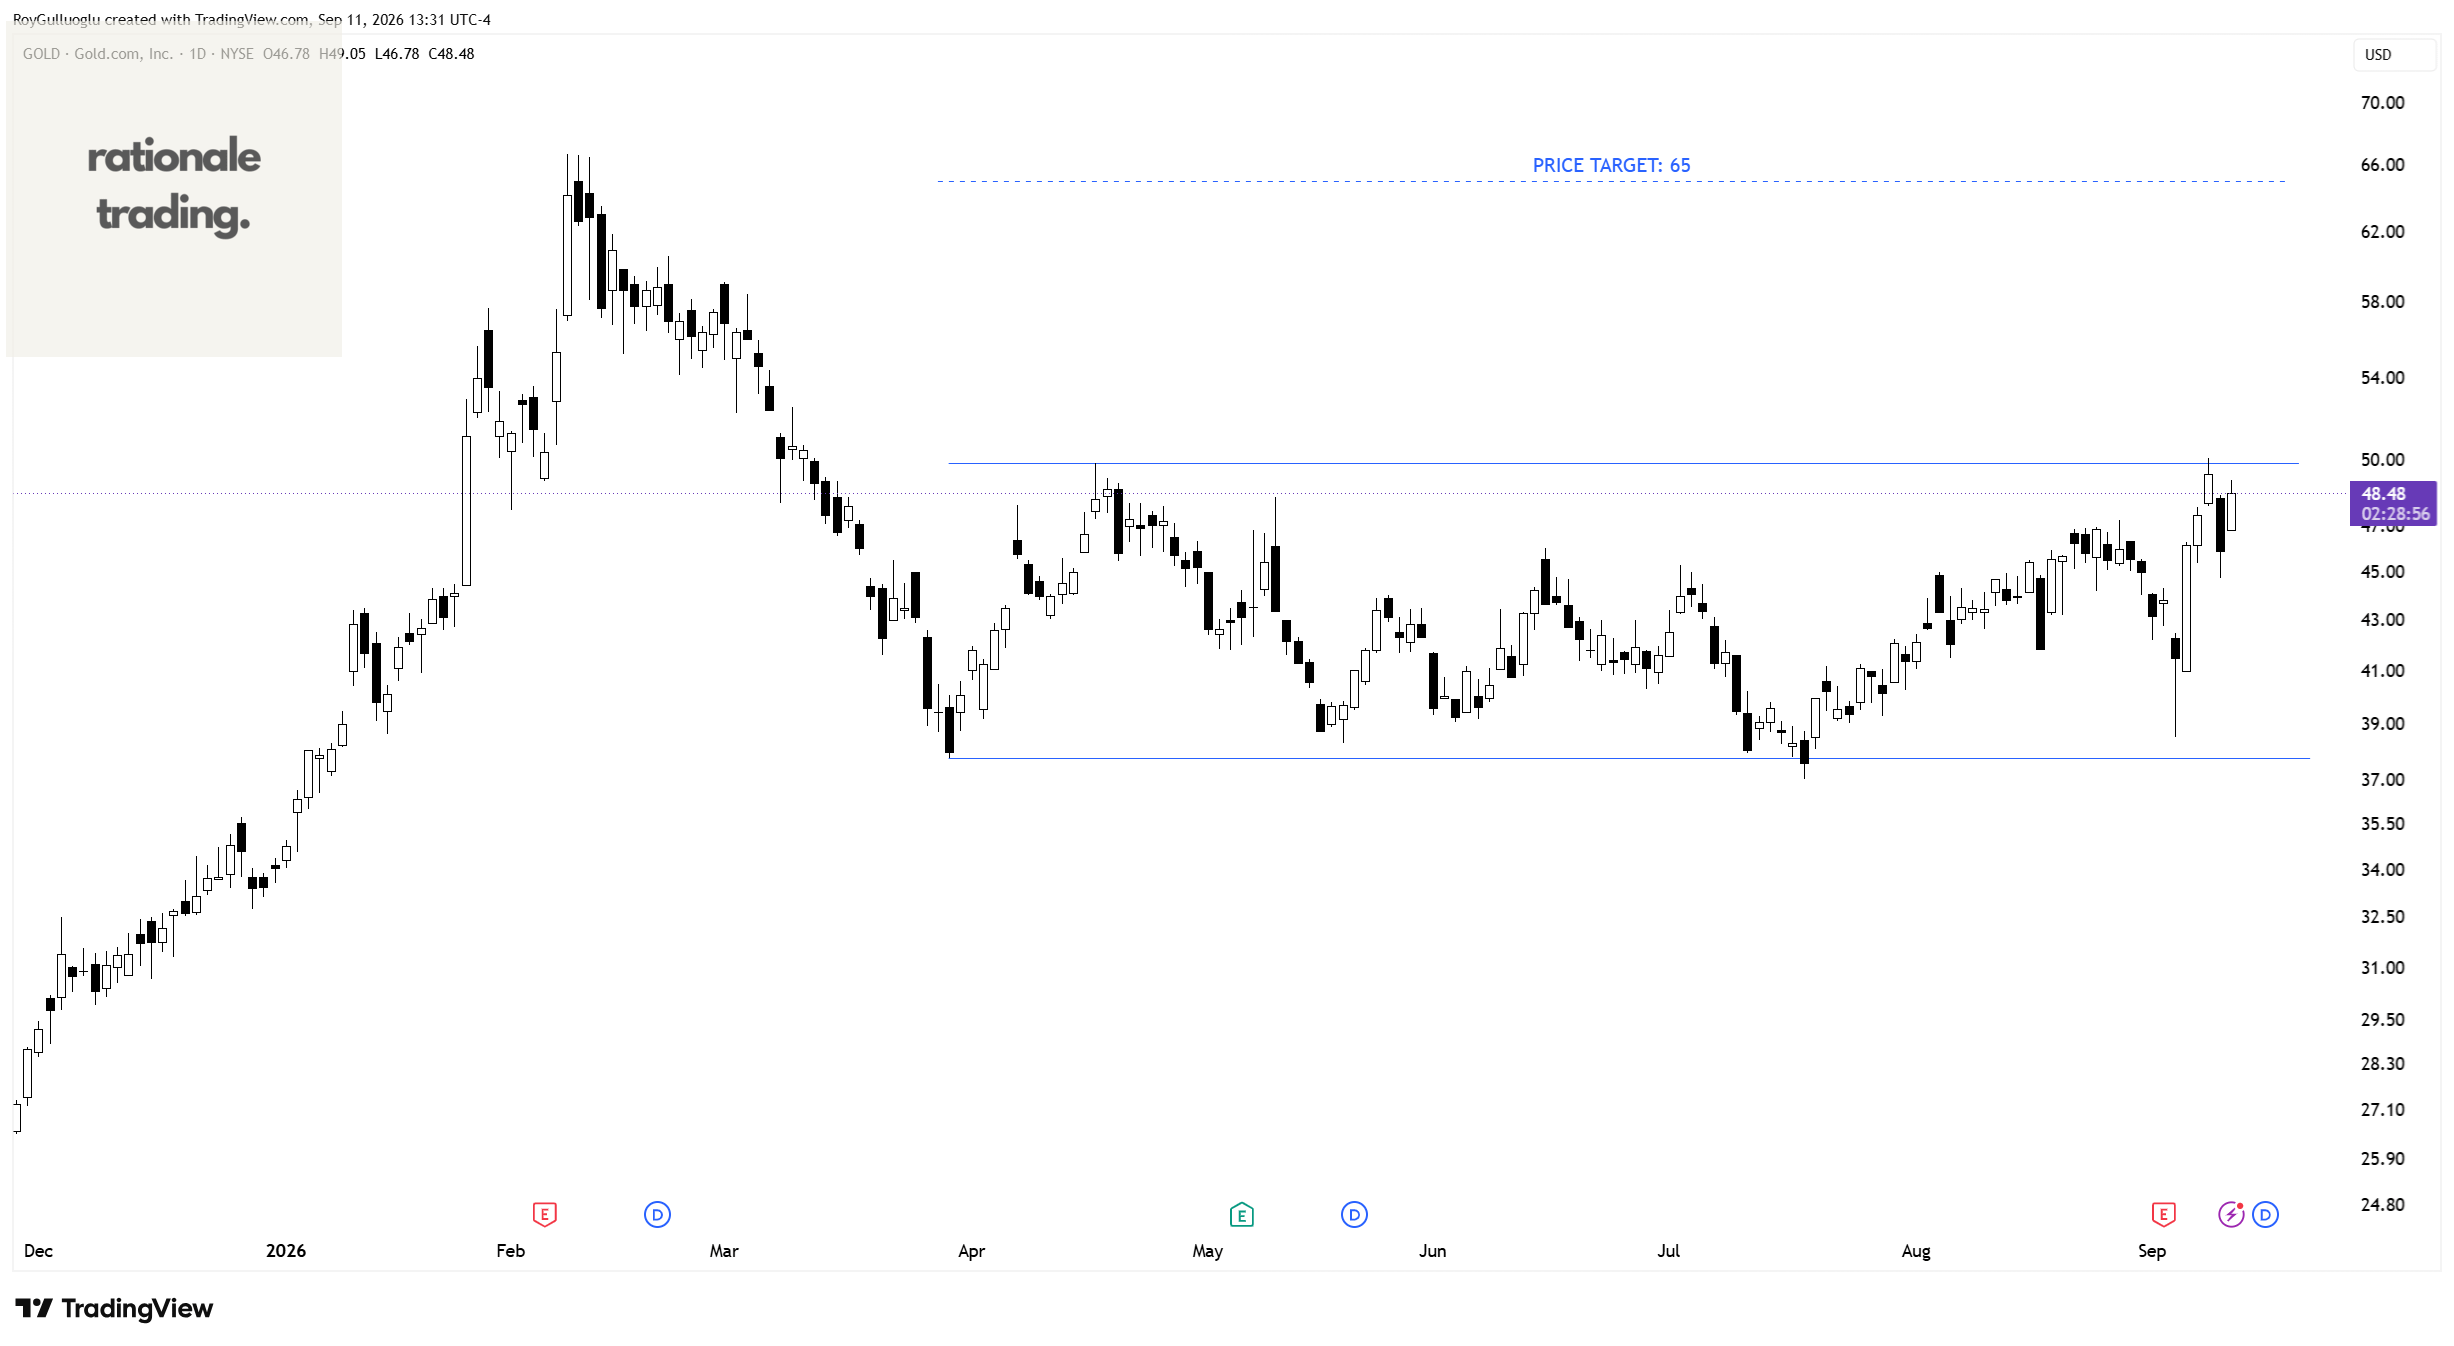
The above daily chart formed an approximately 4-month-long rectangle chart pattern as a bullish reversal after a downtrend.
Within this pattern, the horizontal boundary at 49.83 levels acts as a resistance.
A daily close above 51.3 levels would validate the breakout from the 4-month-long rectangle chart pattern.
Based on this chart pattern, the potential price target is 65 levels.
Wolverine World Wide, Inc.-(WWW/NYSE)-Long Idea
Wolverine World Wide, Inc. designs, manufactures, sources, markets, licenses, and distributes footwear, apparel, and accessories in the United States, Europe, the Middle East, Africa, the Asia Pacific, Canada and Latin America. It operates through two segments: Active Group and Work Group.
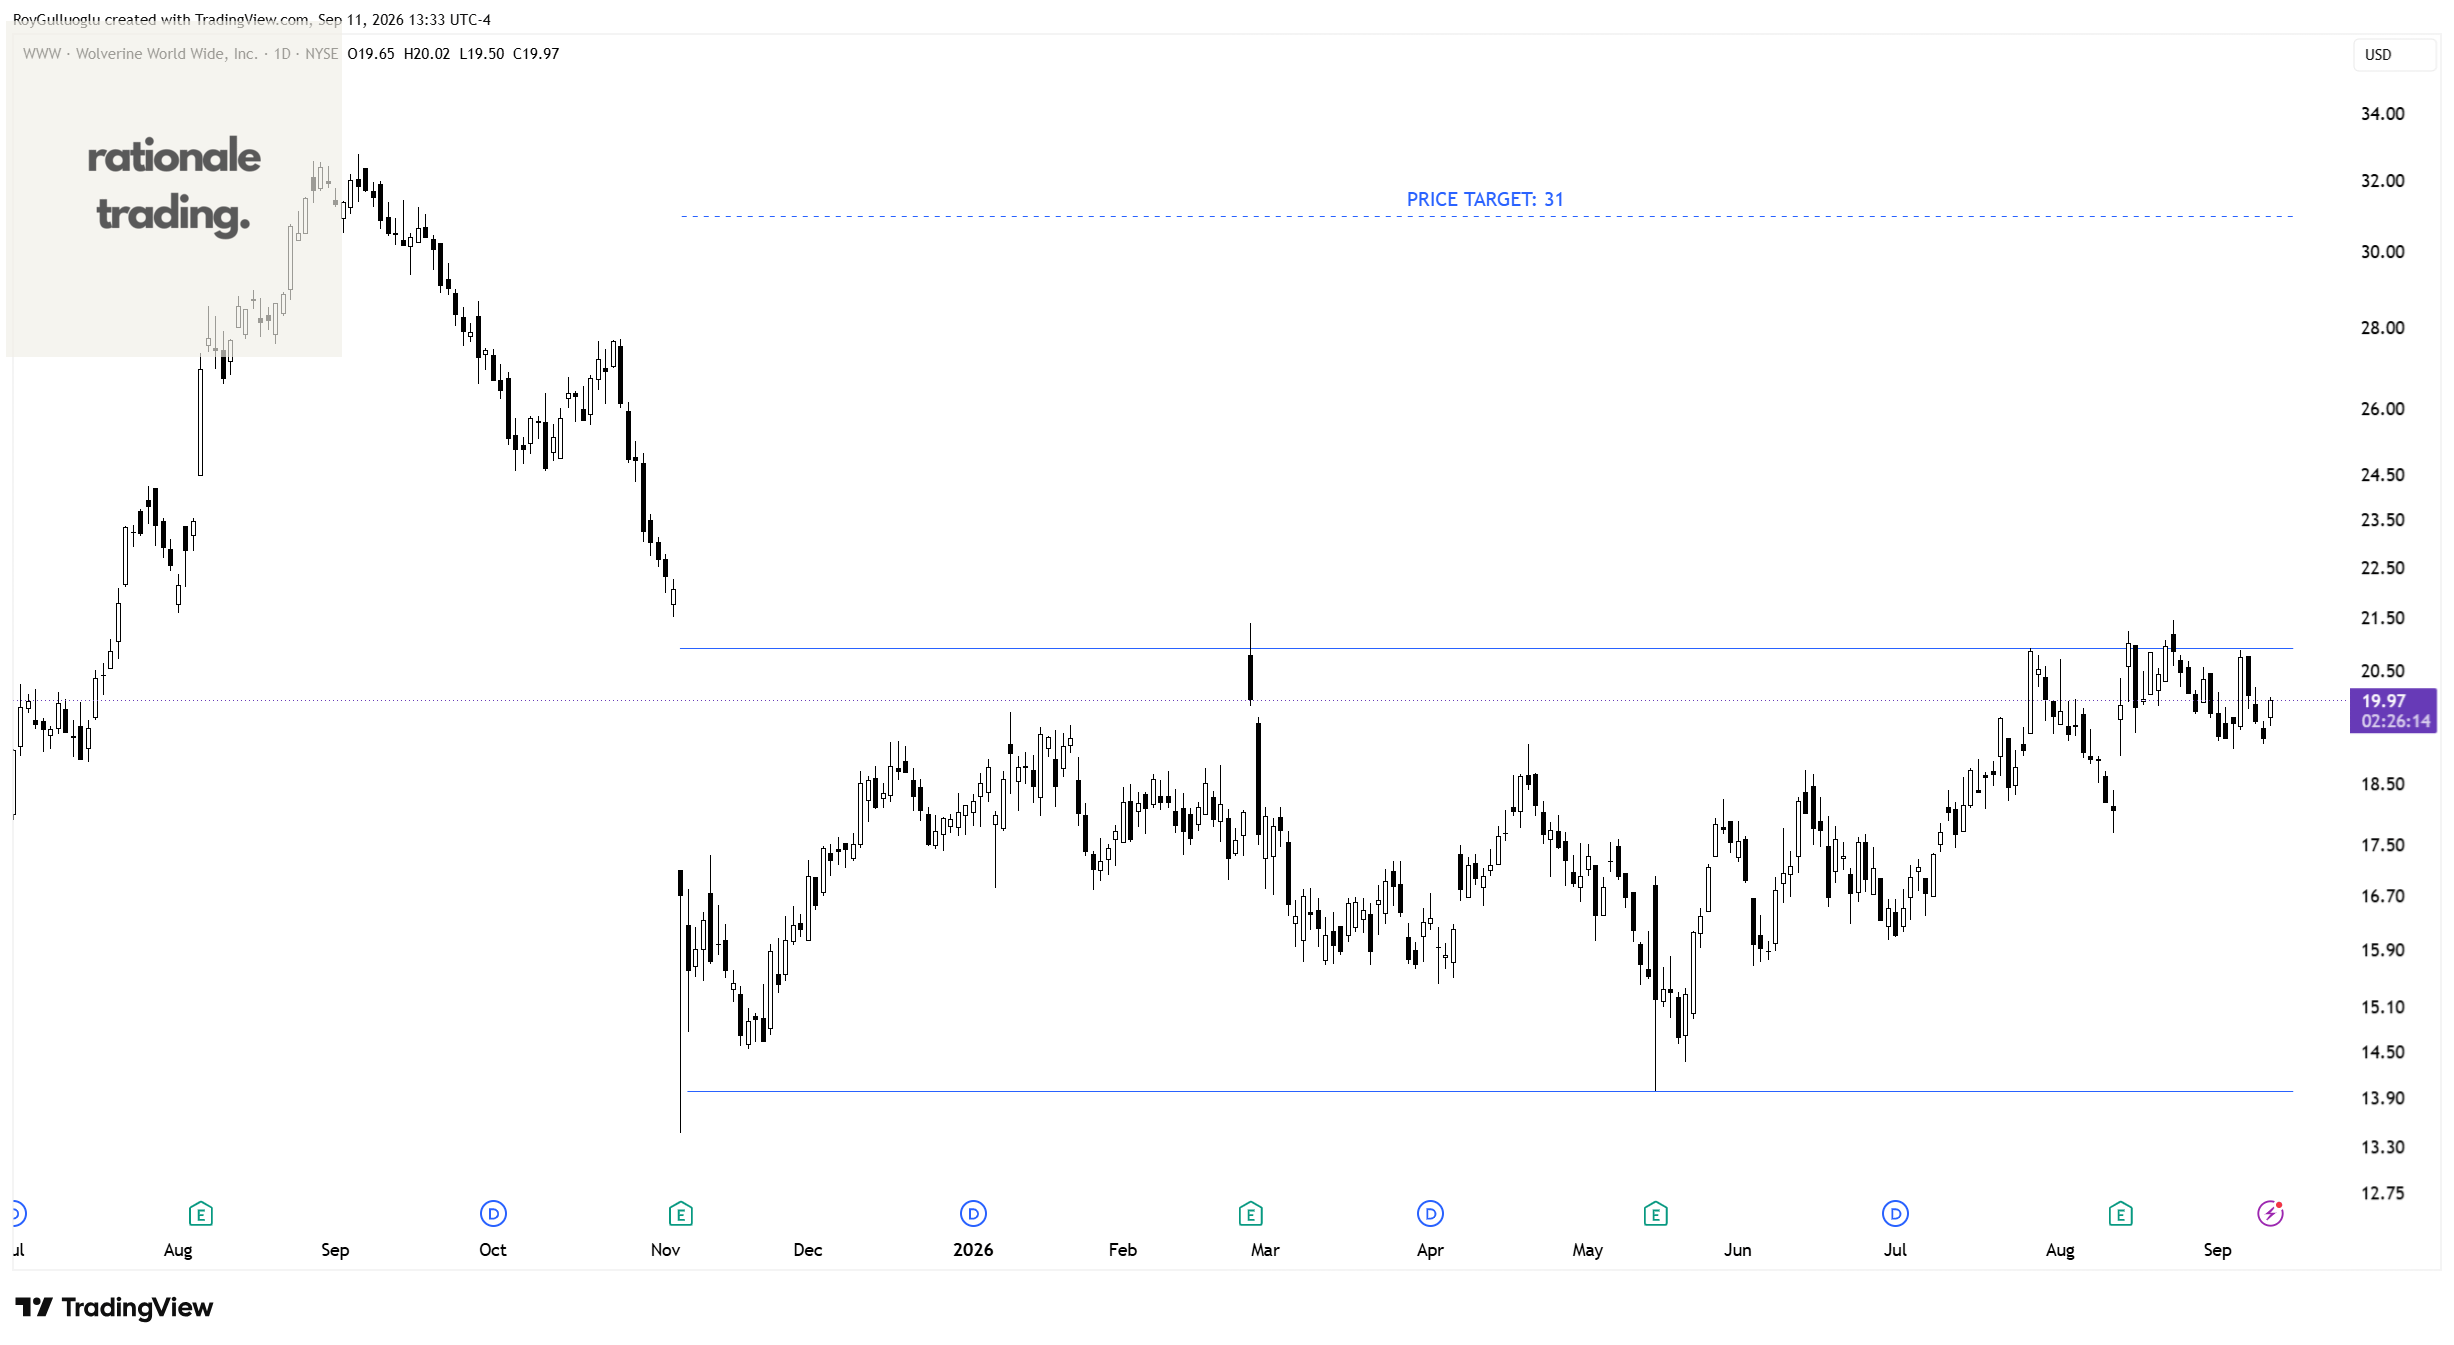
The above daily chart formed an approximately 7-month-long rectangle chart pattern as a bullish reversal after a downtrend.
Within this pattern, the horizontal boundary at 20.9 levels acts as a resistance.
A daily close above 21.5 levels would validate the breakout from the 7-month-long rectangle chart pattern.
Based on this chart pattern, the potential price target is 31 levels.
Arrow Electronics, Inc.-(ARW/NYSE)-Long Idea
Arrow Electronics, Inc. sources and engineers technology for manufacturers, service providers, and users of enterprise computing solutions in the Americas, Europe, the Middle East, Africa, and the Asia Pacific
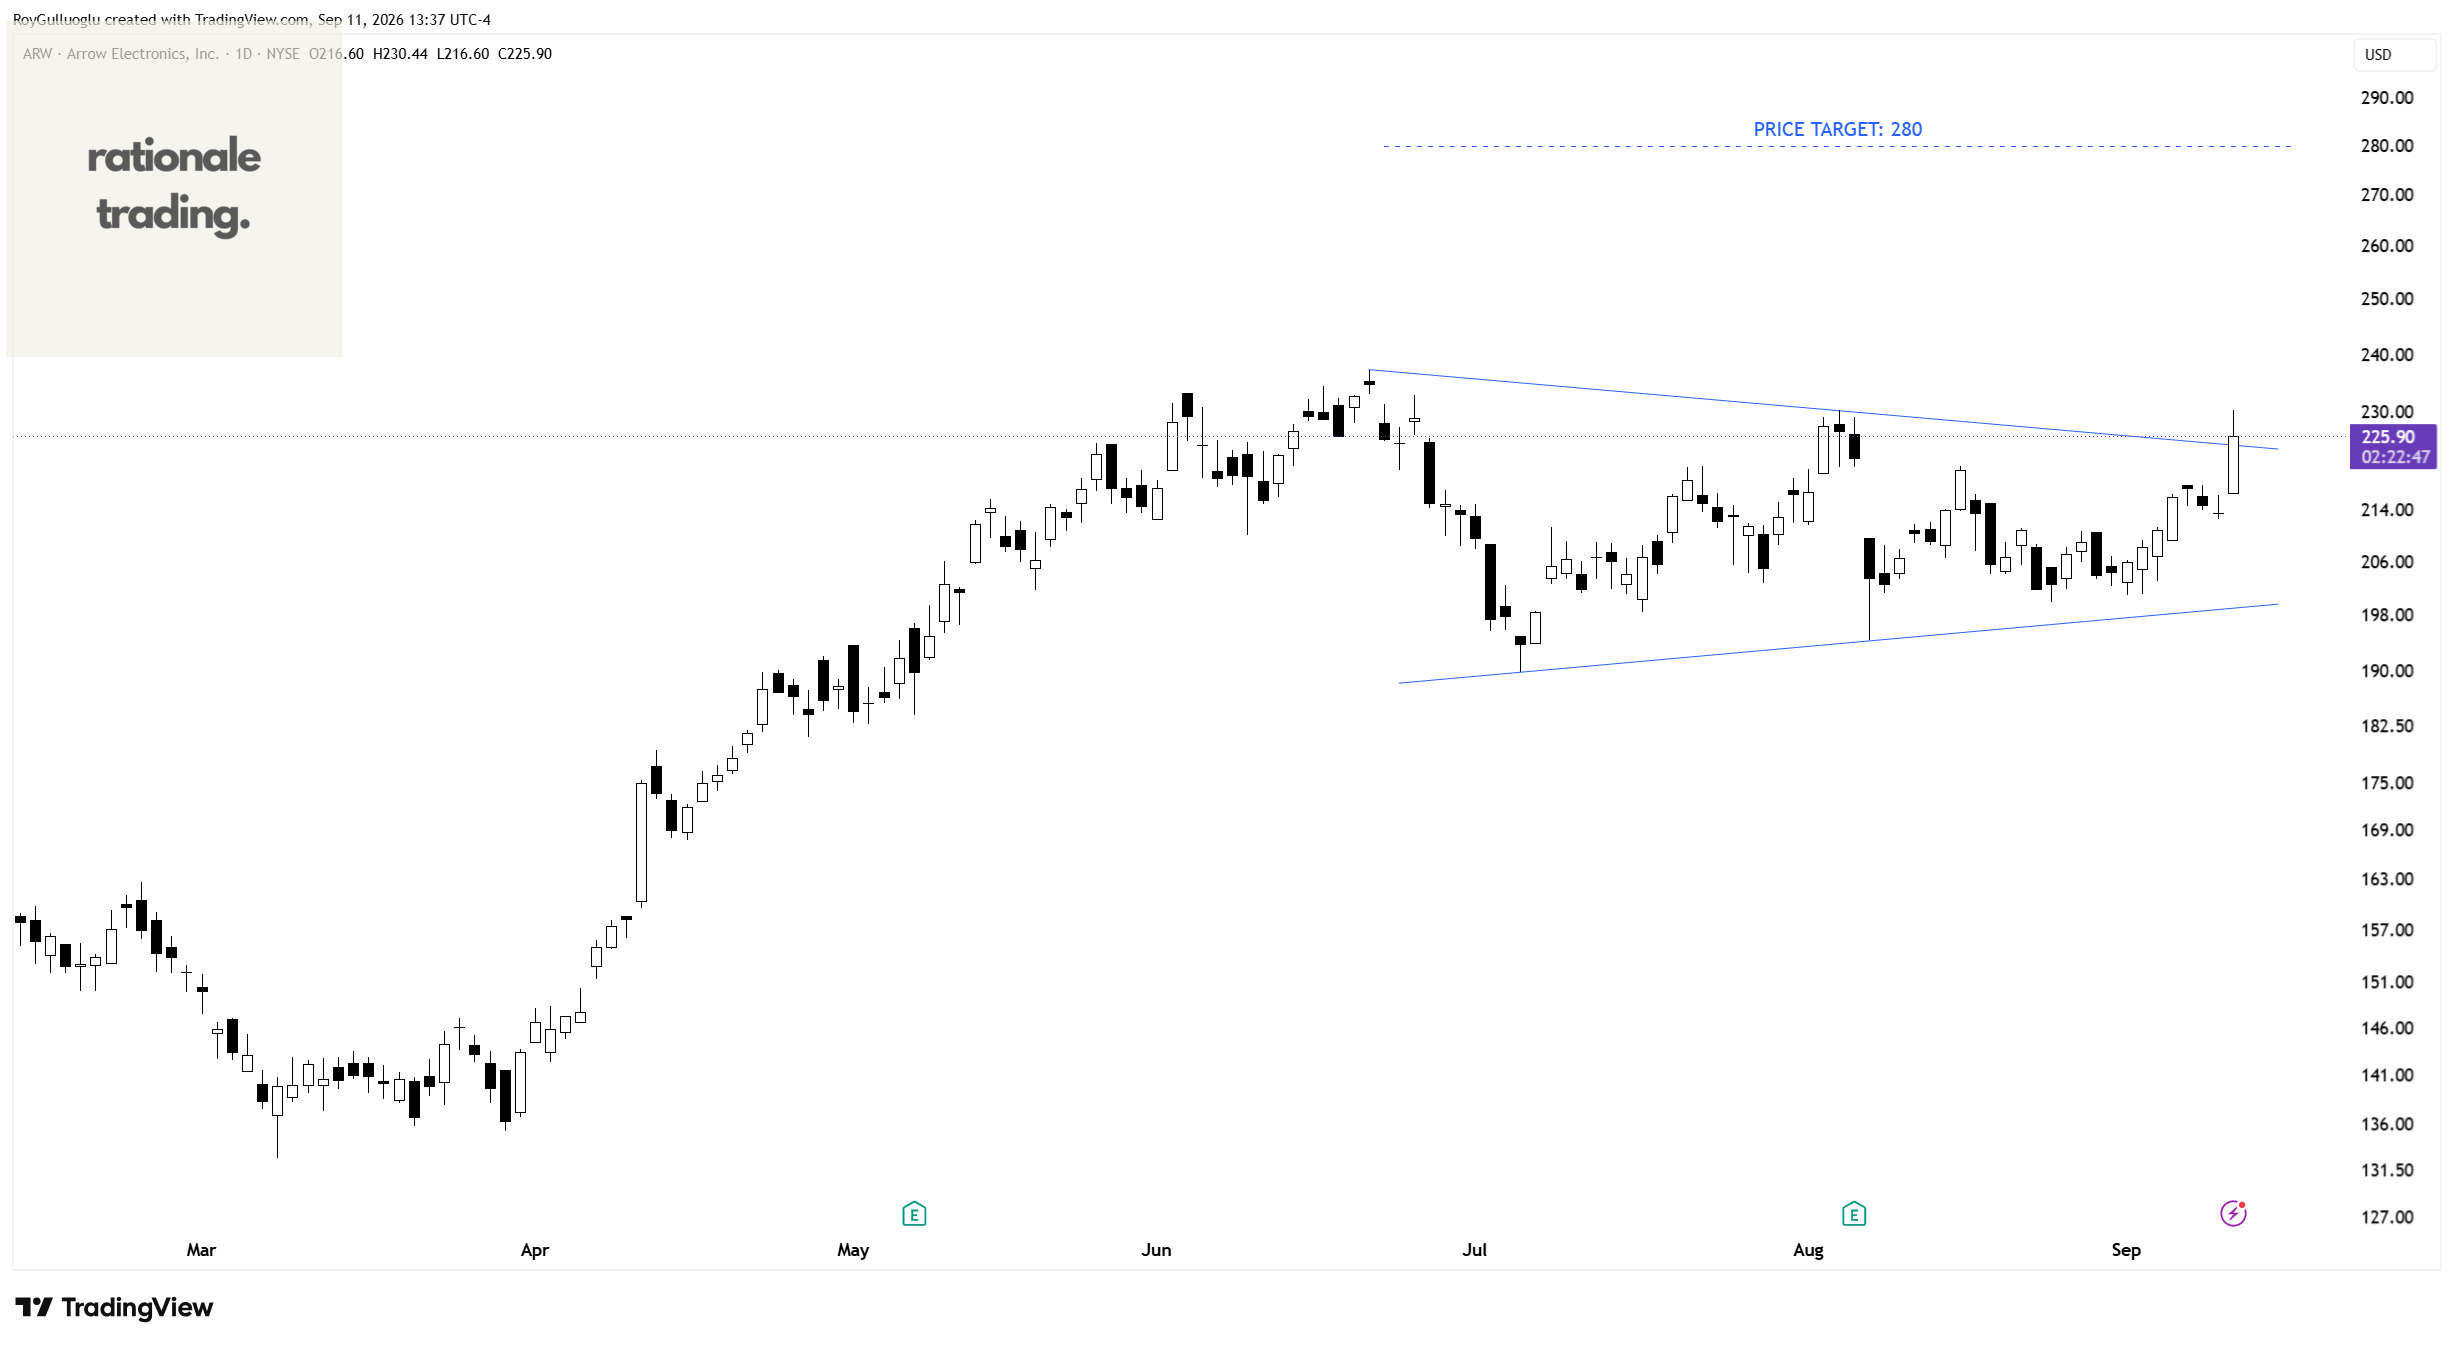
The above daily chart formed an approximately 2-month-long symmetrical triangle chart pattern as a bullish continuation after an uptrend.
A daily close above 231.7 levels would validate the breakout from the 2-month-long symmetrical triangle chart pattern.
Based on this chart pattern, the potential price target is 280 levels.
HubSpot, Inc.-(HUBS/NYSE)-Long Idea
HubSpot, Inc., together with its subsidiaries, provides a cloud-based customer relationship management (CRM) platform for businesses in the Americas, Europe, and the Asia Pacific.
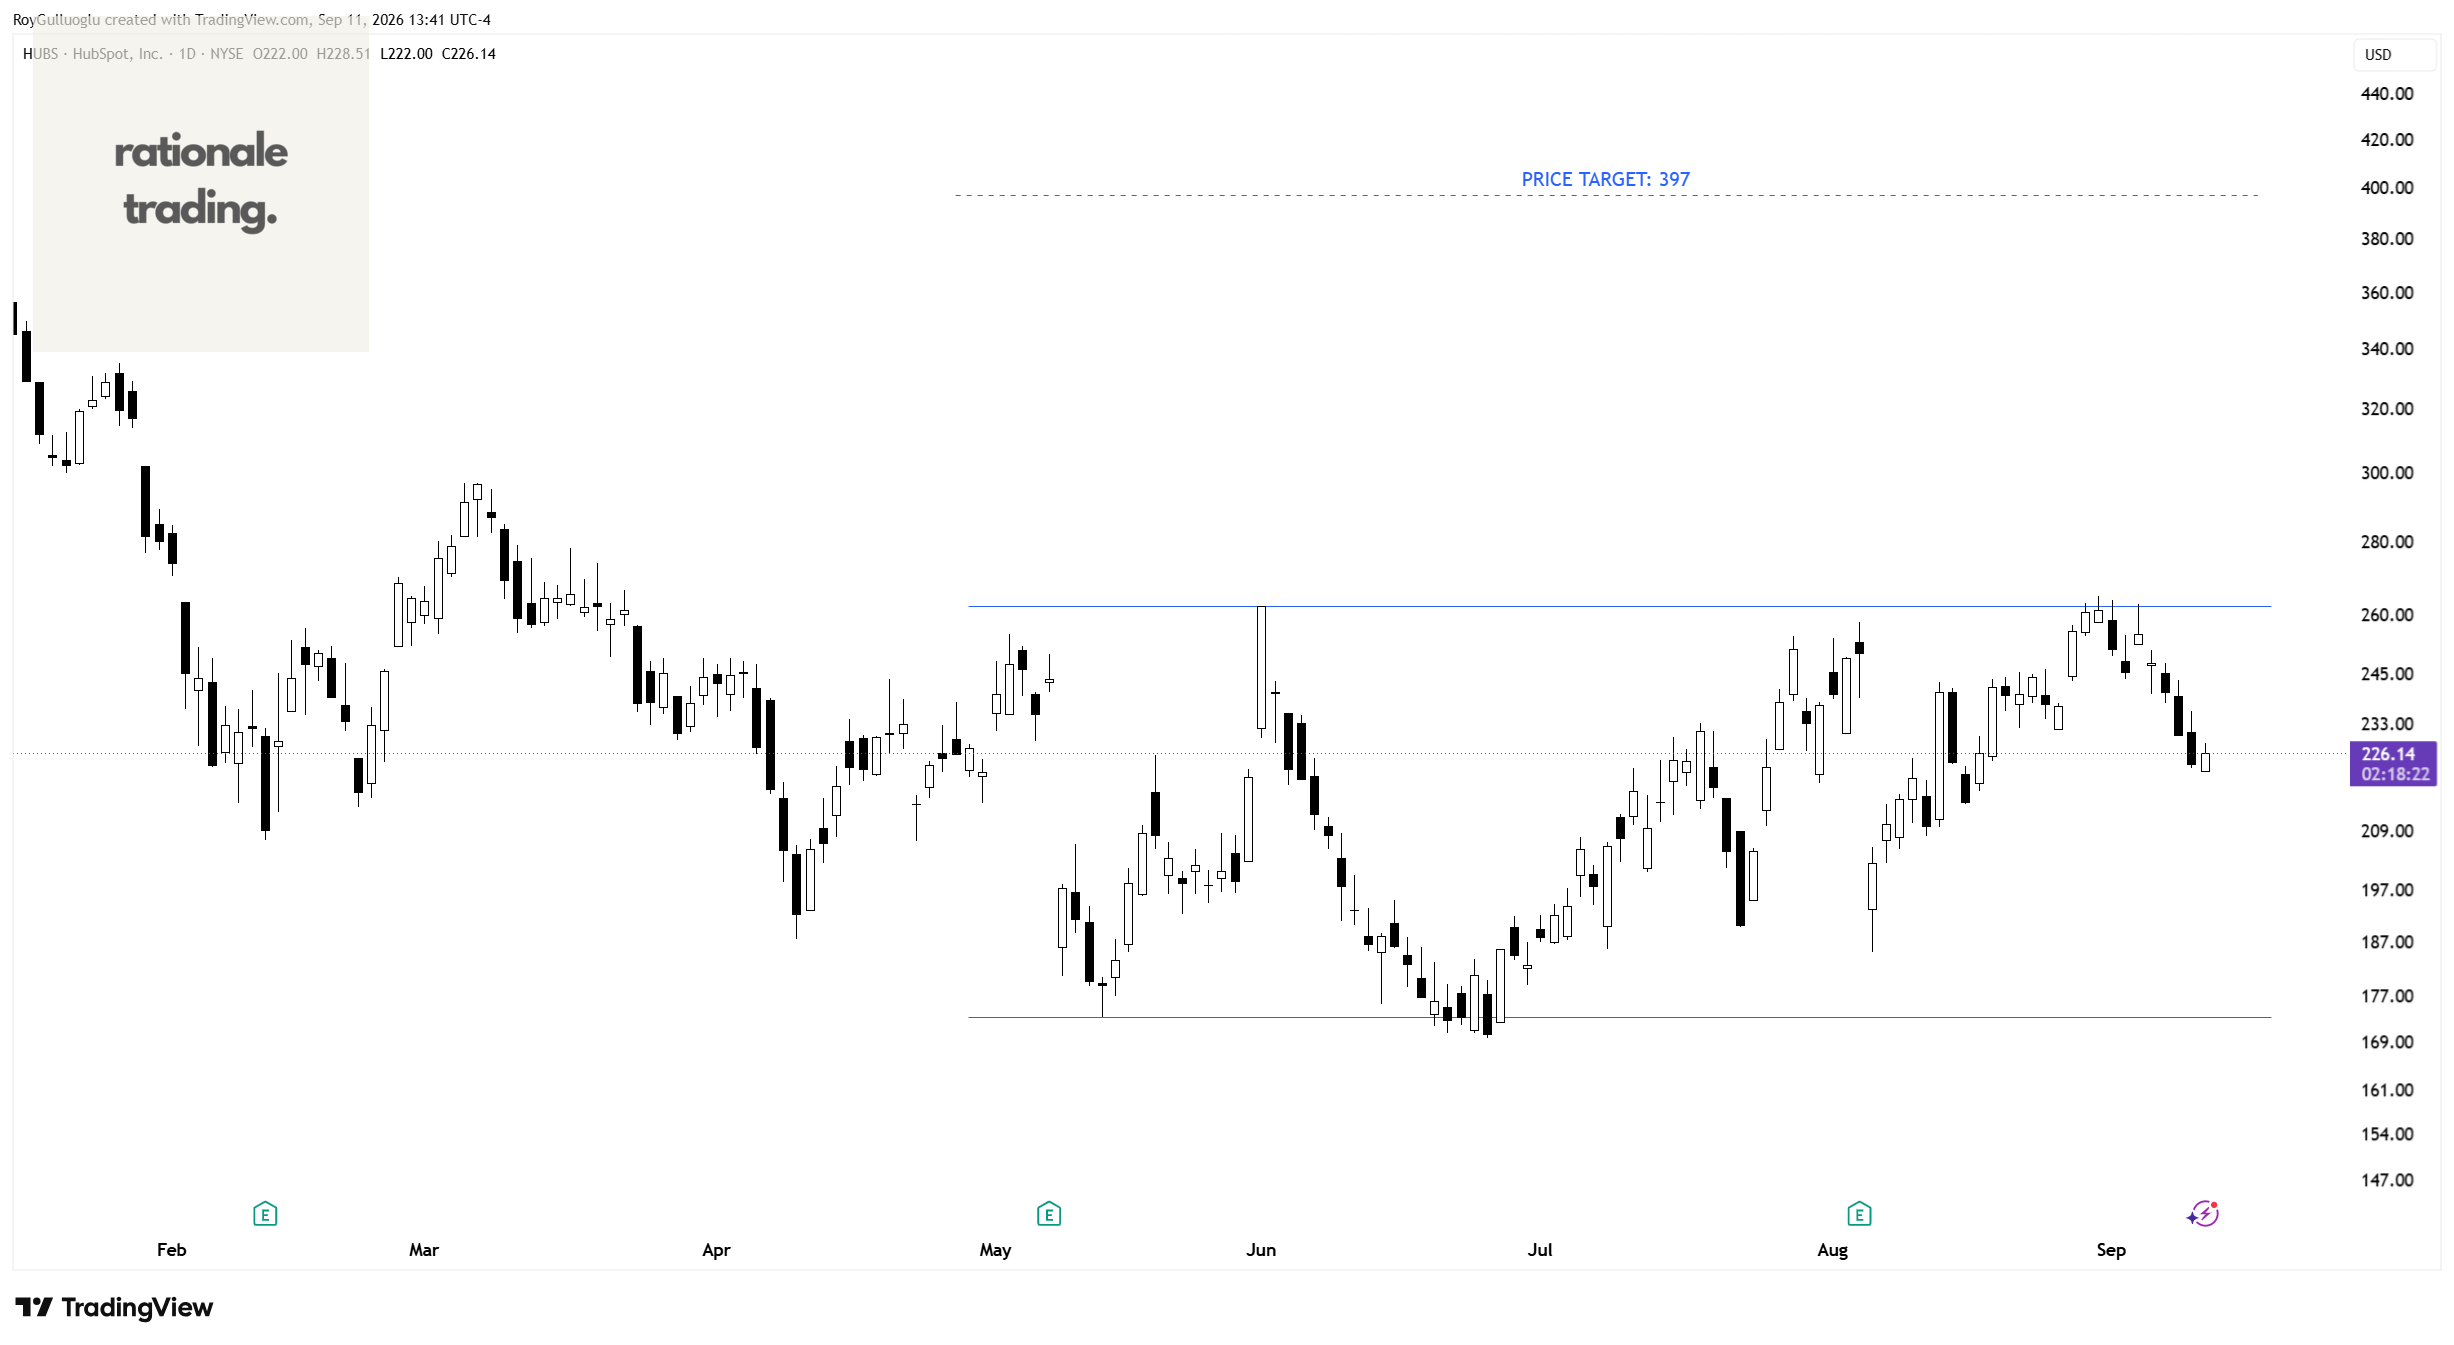
The above daily chart formed an approximately 3-month-long rectangle chart pattern as a bullish reversal after a downtrend.
Within this pattern, the horizontal boundary at 262.3 levels acts as a resistance.
A daily close above 270.1 levels would validate the breakout from the 3-month-long rectangle chart pattern.
Based on this chart pattern, the potential price target is 397 levels.
Hewlett Packard Enterprise Company-(HPE/NYSE)-Long Idea
Hewlett Packard Enterprise Company, together with its subsidiaries, develops intelligent solutions in the United States, the Americas, Europe, the Middle East, Africa, the Asia Pacific, Japan, and internationally.
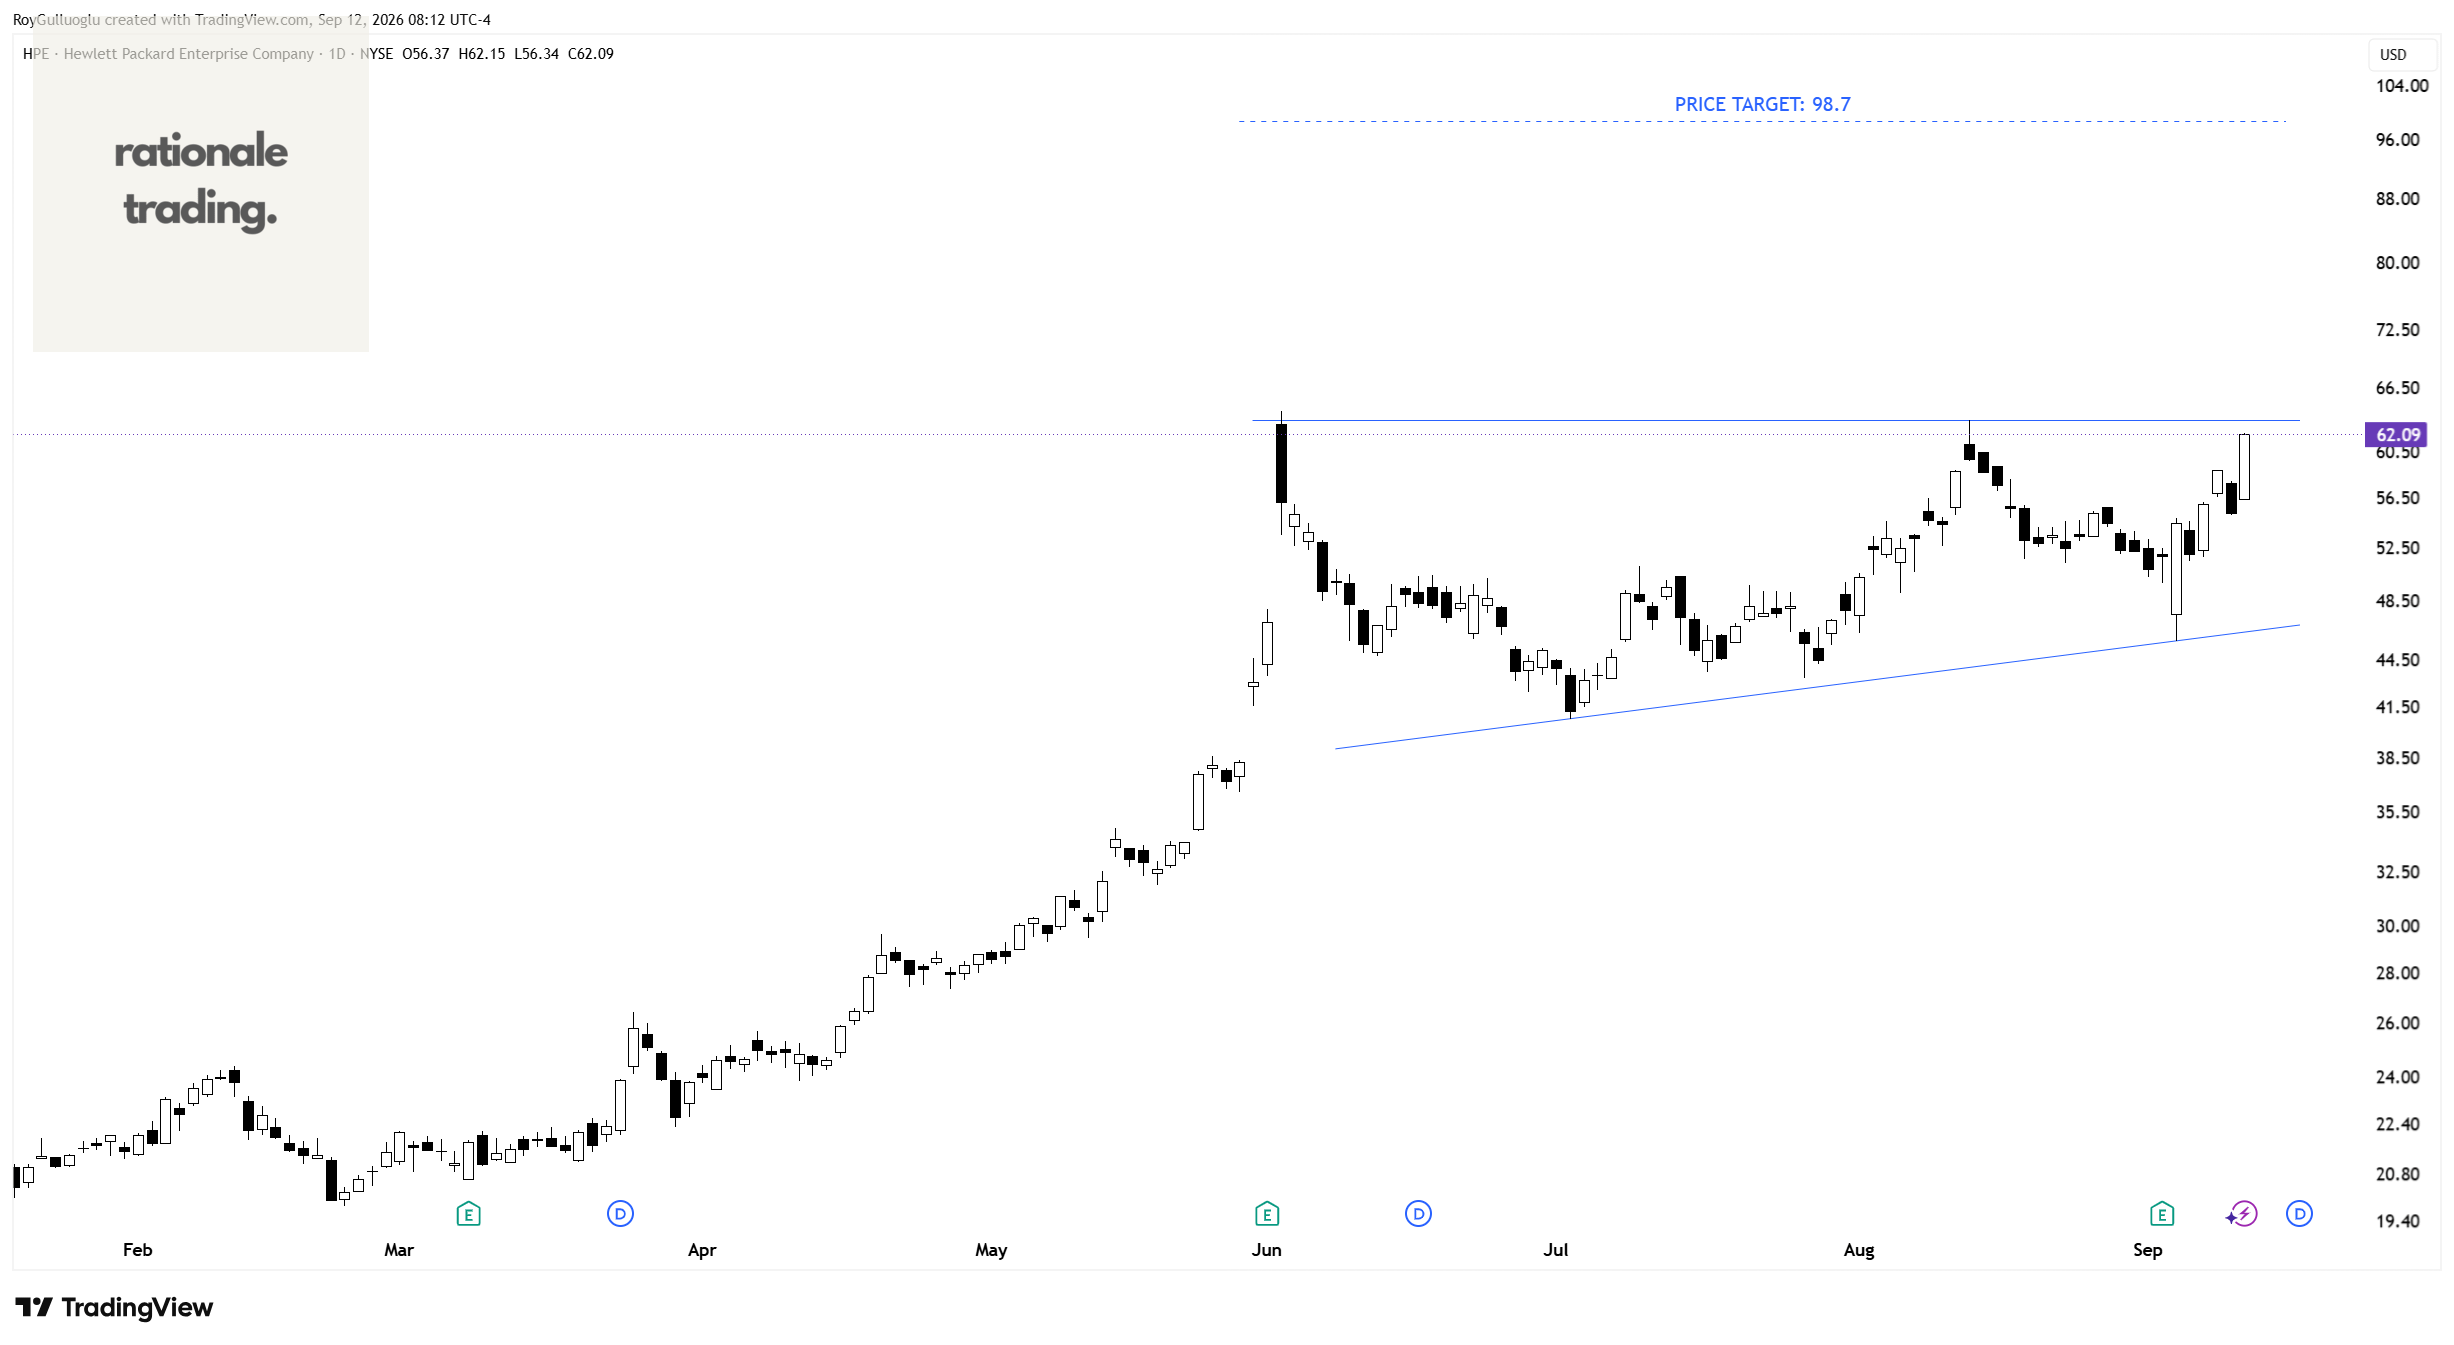
The above daily chart formed an approximately 3-month-long ascending triangle chart pattern as a bullish continuation after an uptrend.
Within this pattern, the horizontal boundary at 63.44 levels acts as a resistance.
A daily close above 65.3 levels would validate the breakout from the 3-month-long ascending triangle chart pattern.
Based on this chart pattern, the potential price target is 98.7 levels.