


EQT Corporation -(EQT/NYSE)-Long Idea
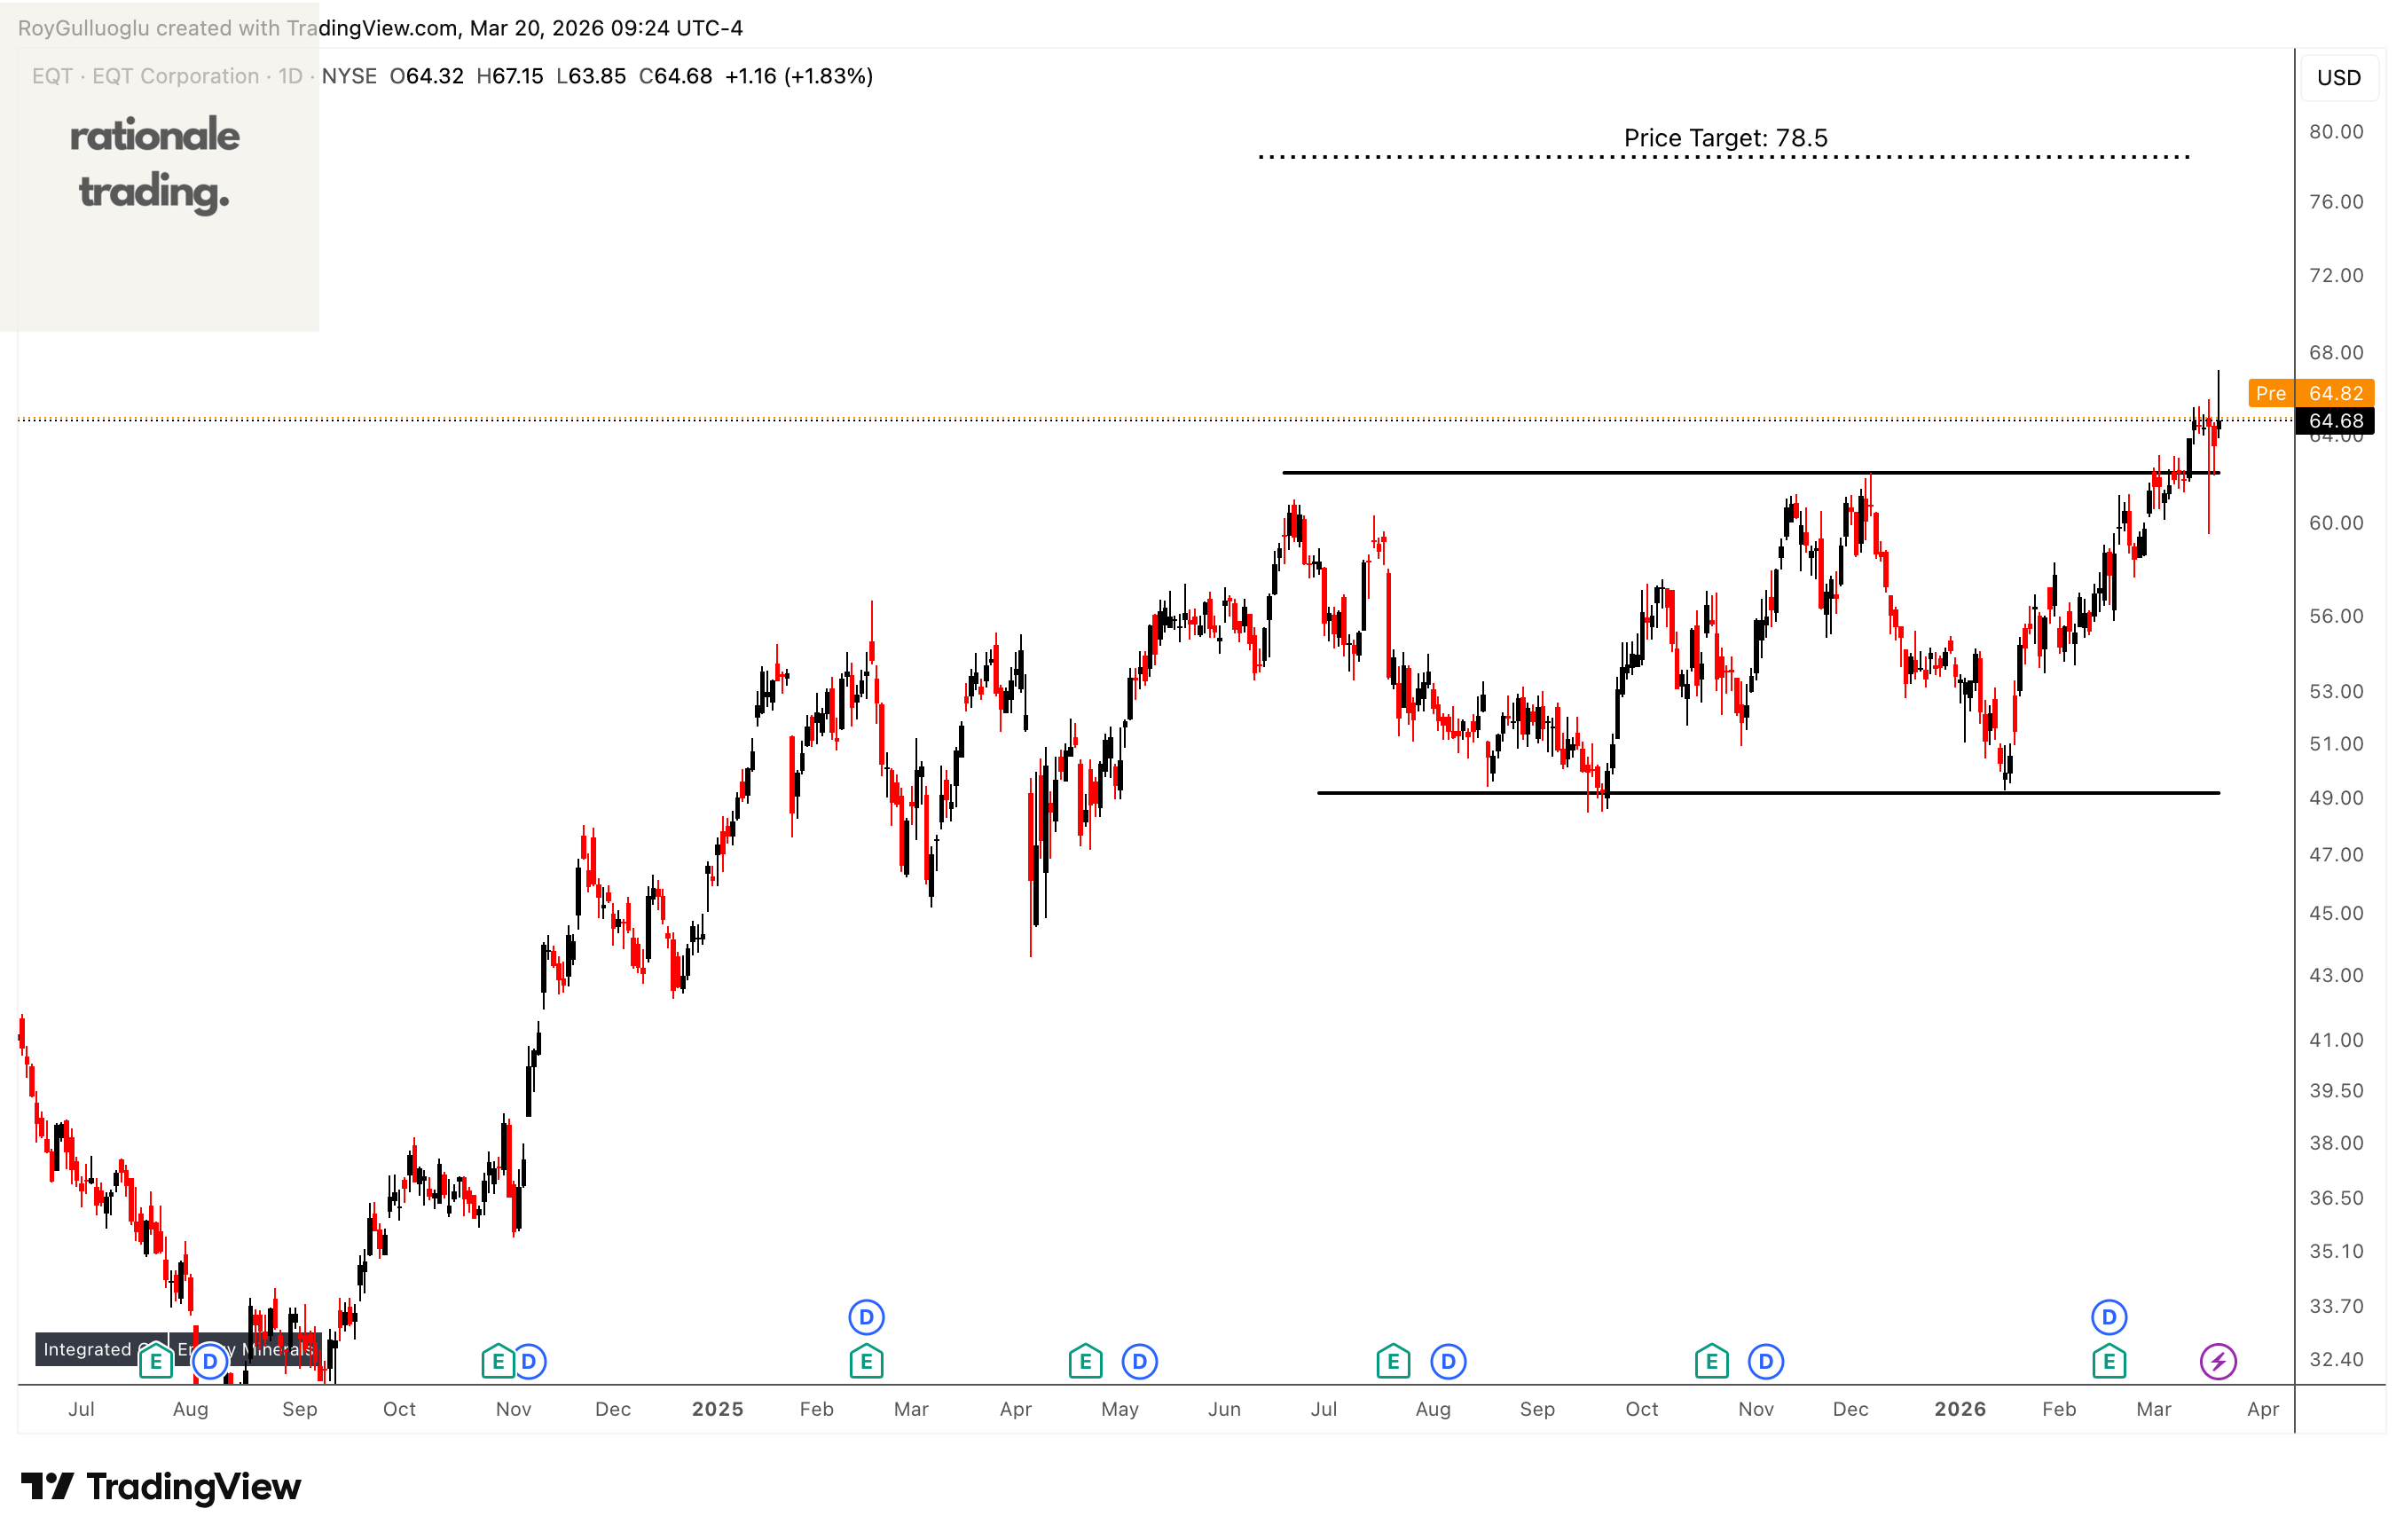
EQT Corporation engages in the exploration, production, gathering, and transmission of hydrocarbons and natural gas.
The horizontal boundary at 62.23 levels acted as a resistance within this pattern.
A daily close above 64 levels validated the breakout from the 6-month-long rectangle chart pattern.
Based on this chart pattern, the potential price target is 78.5 levels.
Ubiquiti Inc. -(UI/NYSE)-Long Idea
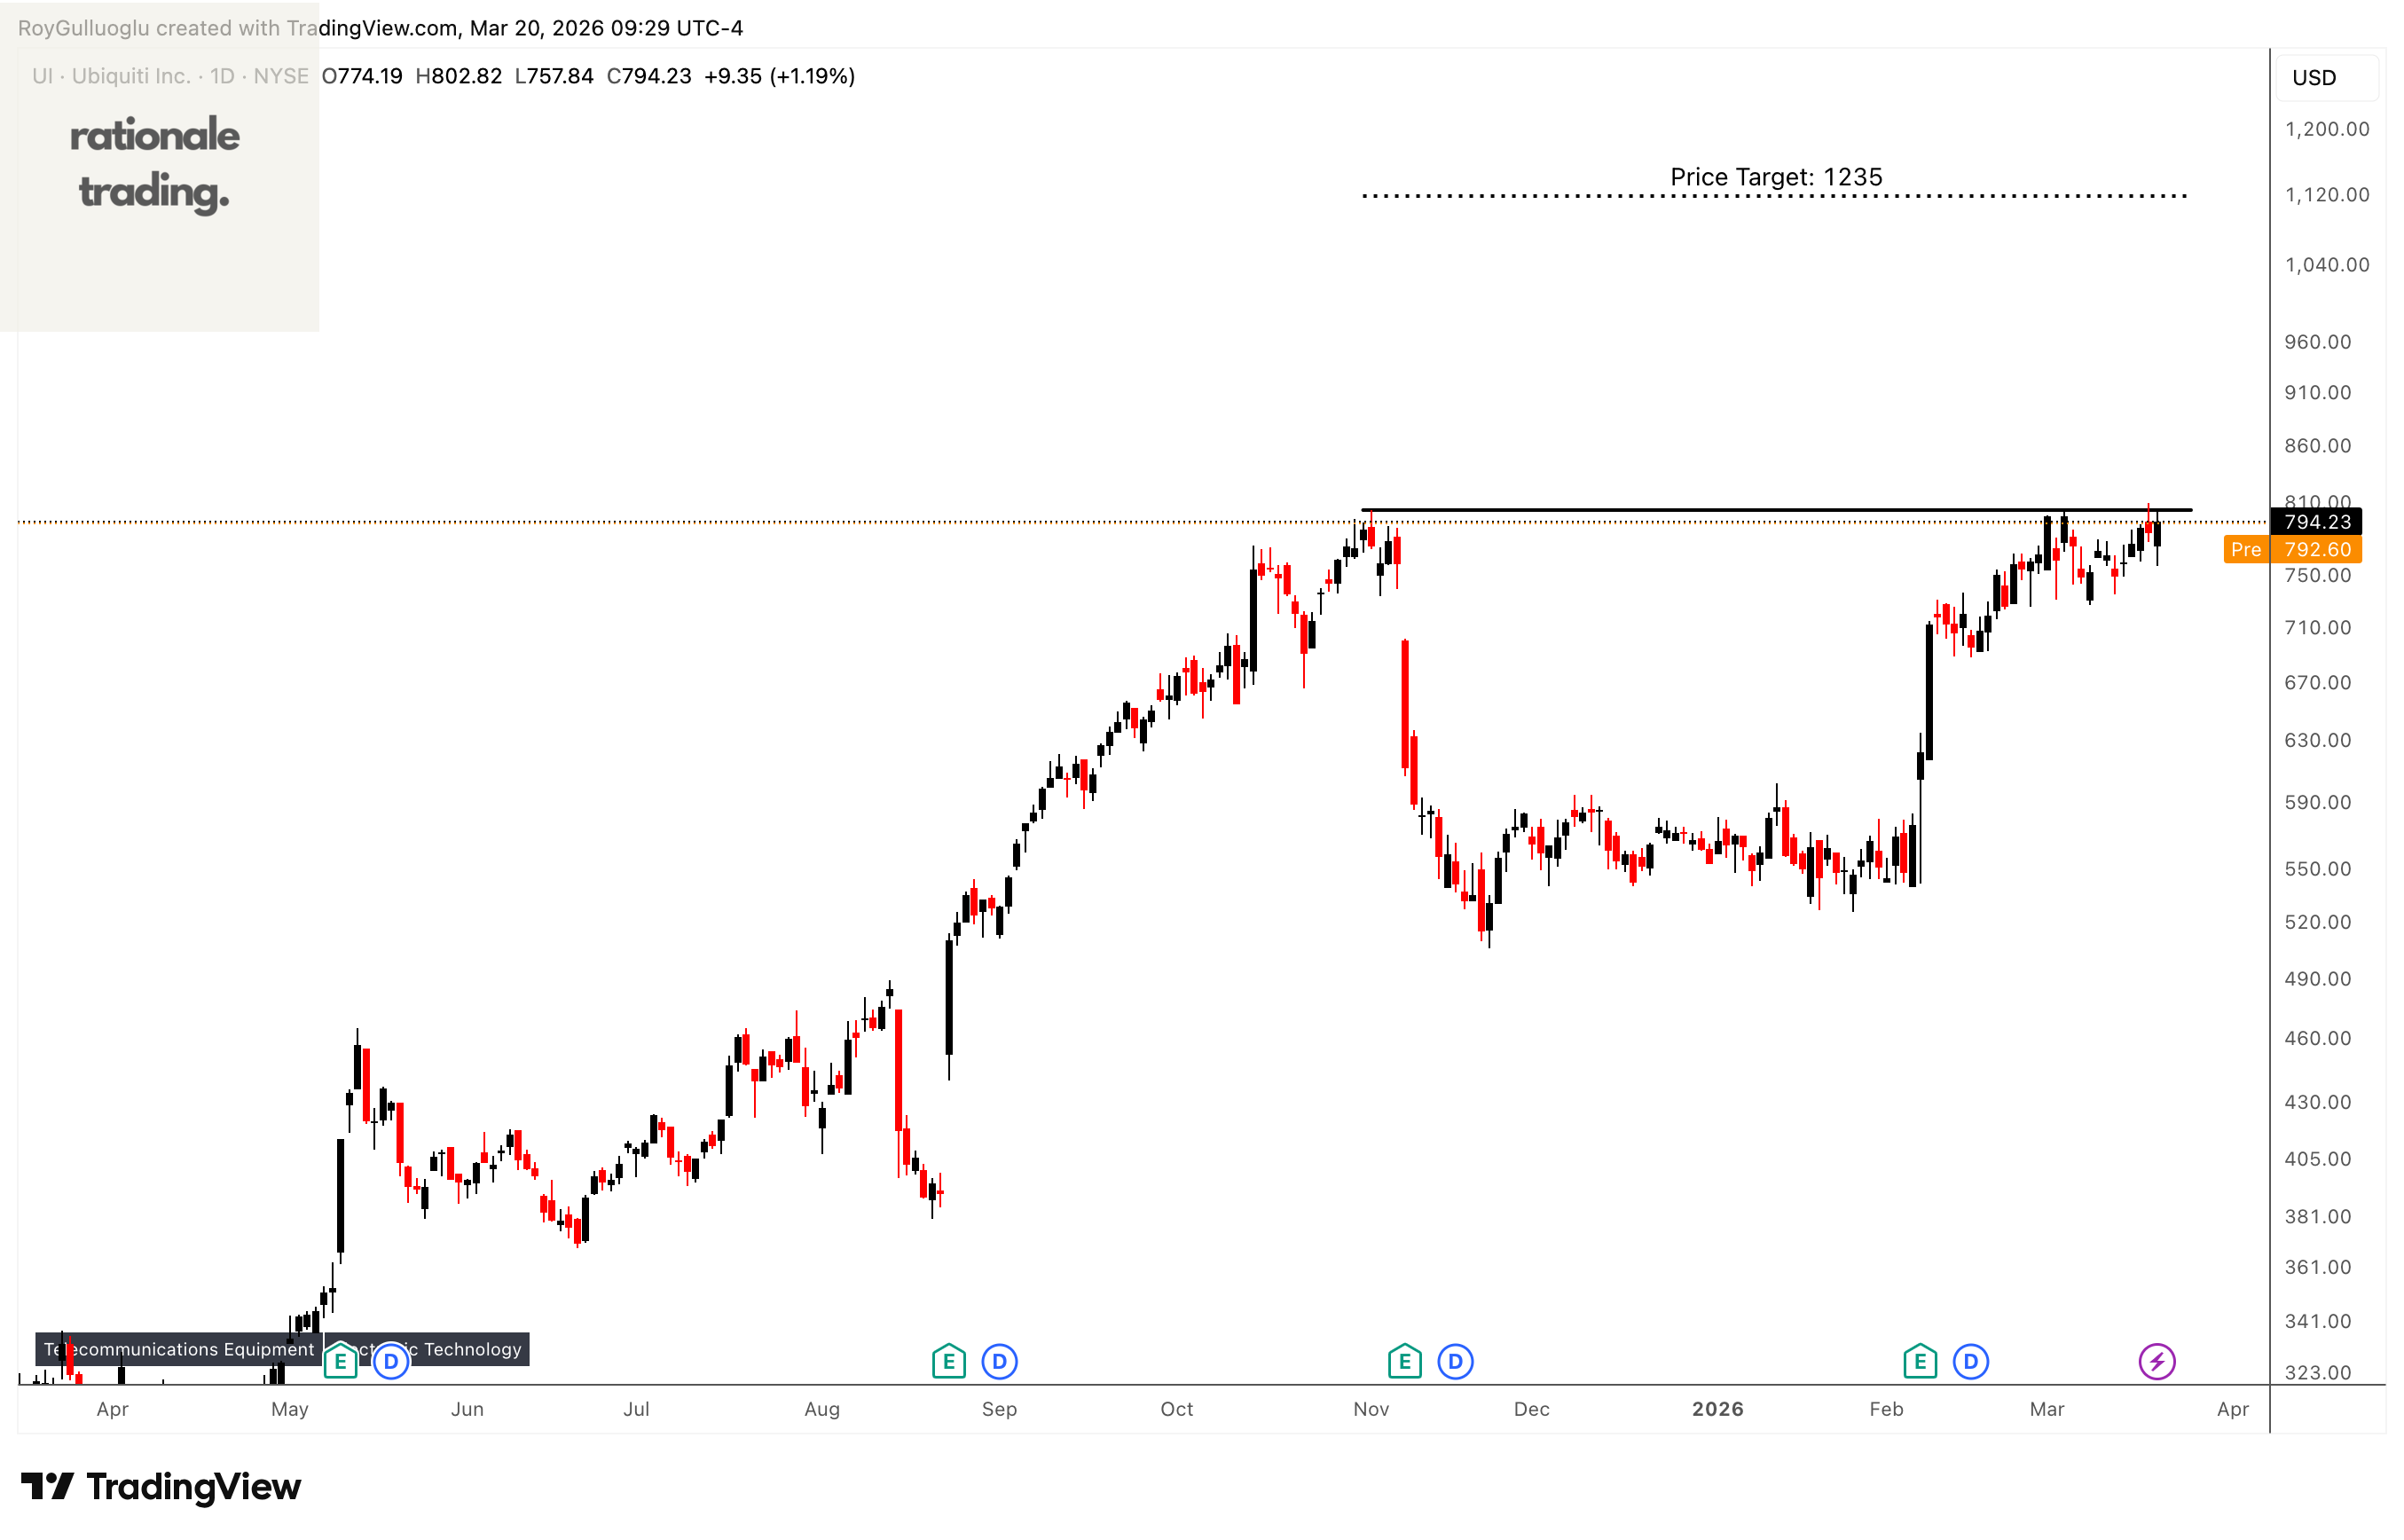
Ubiquiti Inc. develops networking technology for service providers, enterprises, and consumers in North America, Europe, the Middle East, Africa, Asia Pacific, South America.
The horizontal boundary at 803.47 levels acts as a resistance within this pattern.
A daily close above 827 levels would validate the breakout from the 3-month-long cup & handle chart pattern.
Based on this chart pattern, the potential price target is 1235 levels.
Alphabet Inc.-(GOOGL/NASDAQ)-Long/Short Idea
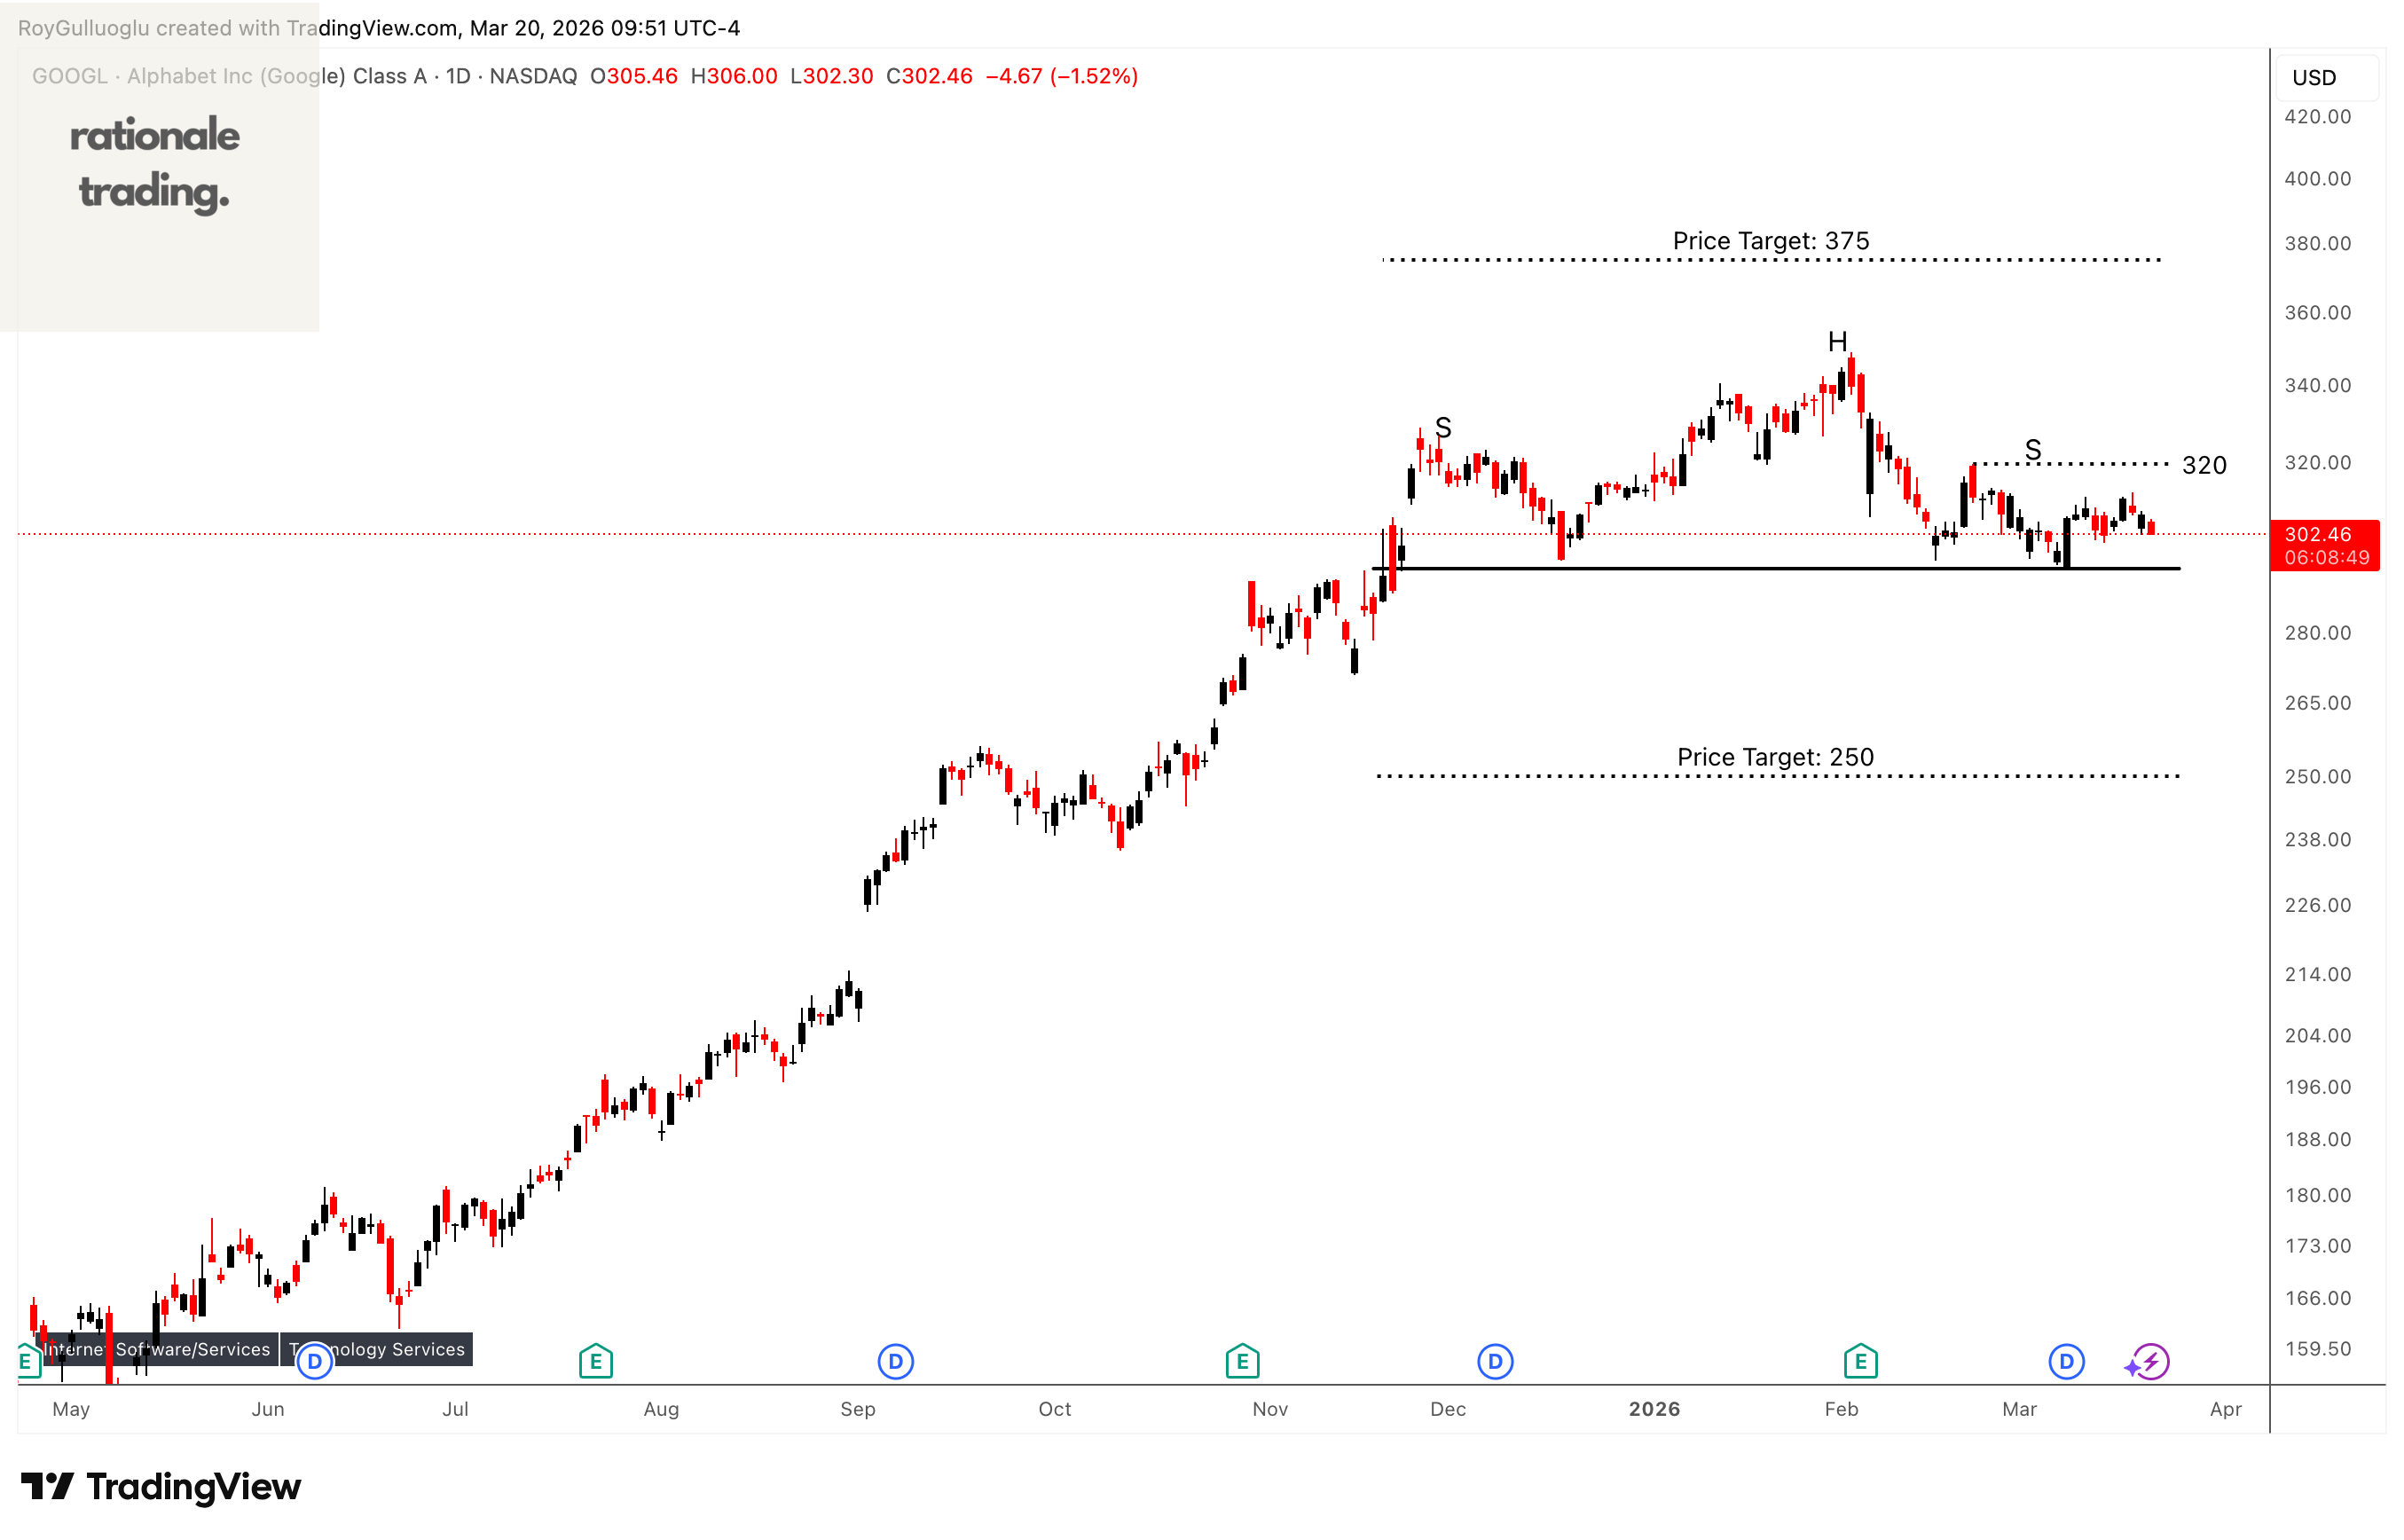
Alphabet Inc. offers various products and platforms in the United States, Europe, the Middle East, Africa, the Asia-Pacific, Canada, and Latin America.
The above daily chart formed an approximately 3-month-long H&S top chart pattern as a bearish reversal after an uptrend or it might act as a continuation and form an H&S failure chart pattern.
The horizontal boundary at 294.36 levels acts as a support within this pattern while 320 levels act as a resistance.
A daily close below 285.5 levels would validate the breakdown from the 3-month-long H&S top chart pattern. A daily close above 329 would validate the breakout from the H&S failure chart pattern.
Based on the chart patterns, the potential price targets are 250 and 375 levels respectively.
Cipher Digital Inc.-(CIFR/NASDAQ)-Short Idea
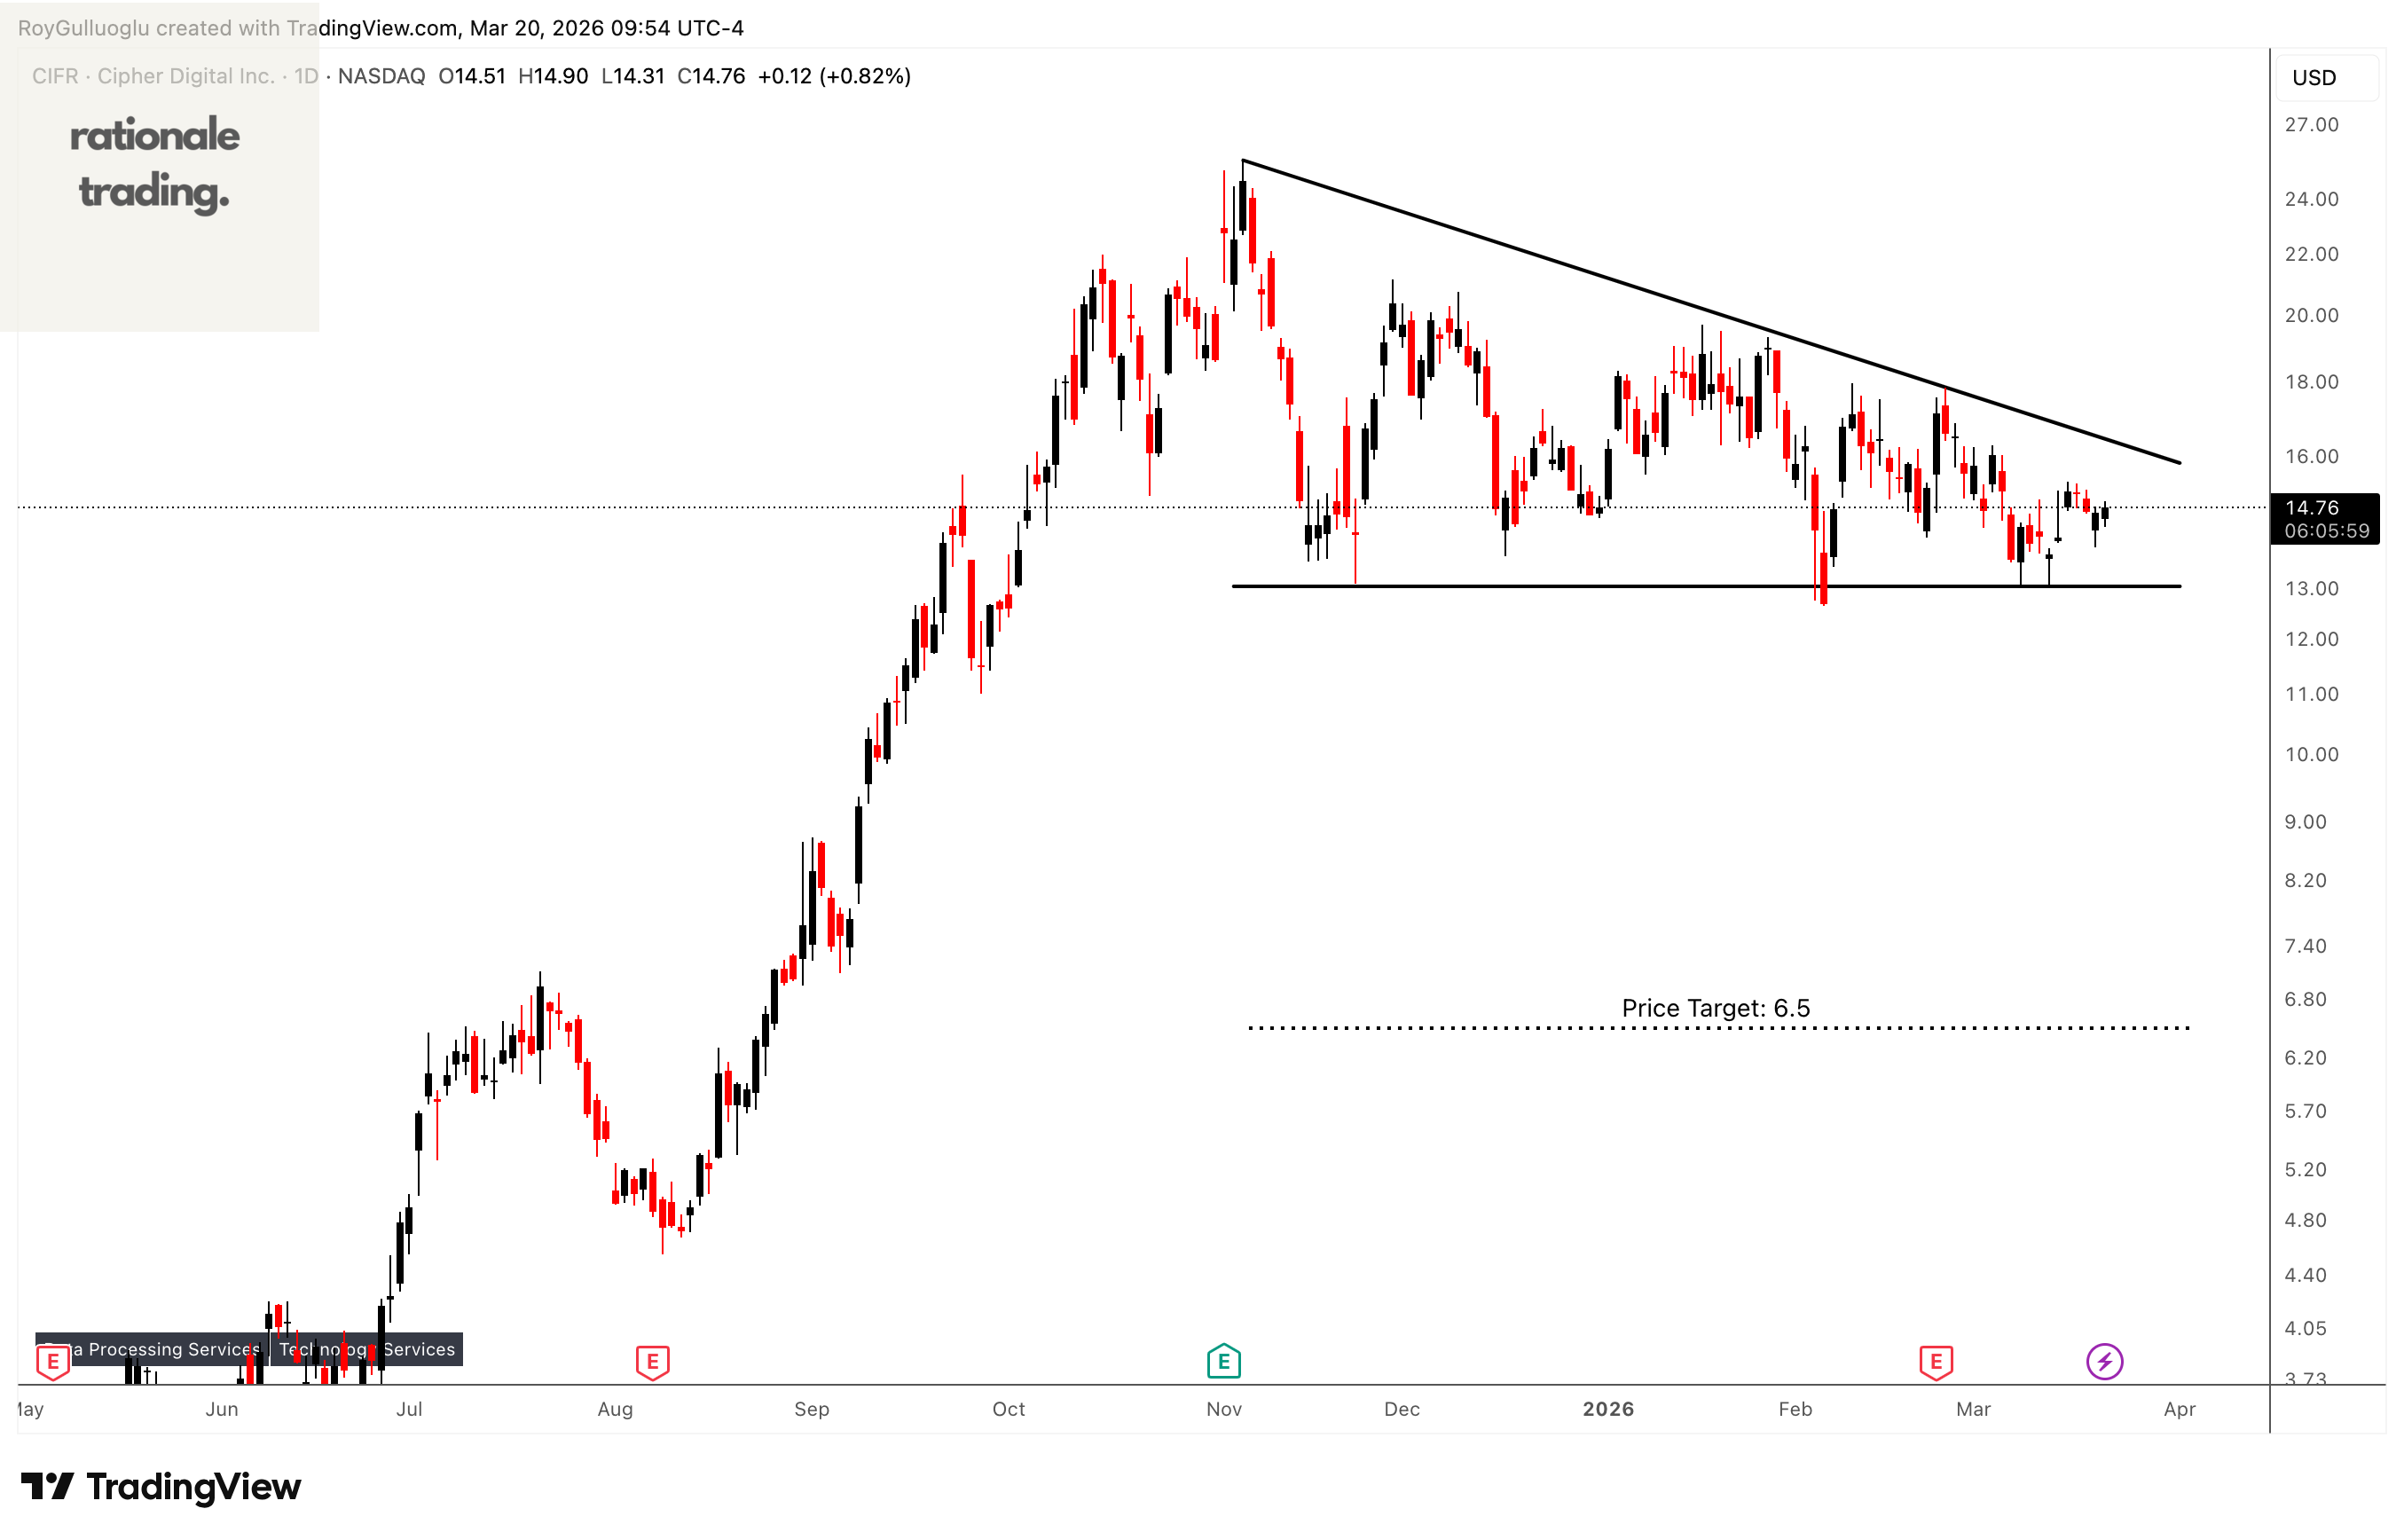
Cipher Digital Inc., together with its subsidiaries, develops and operates industrial-scale data centers for bitcoin mining and high-performance compute (HPC) hosting in the United States.
The horizontal boundary at 13 levels acts as a support within this pattern.
A daily close below 12.6 levels would validate the breakout from the 3-month-long descending triangle chart pattern.
Based on this chart pattern, the potential price target is 6.5 levels.