


New setups
TICKERS: DOCO(BIST), TOASO(BIST), EREGL(BIST), CTAS(NASDAQ), PFSI(NYSE), UMBF(NASDAQ), BATRA(NASDAQ), FOR(NYSE), 002463(SZSE), 8795(TSE)
DO & CO-(DOCO/BIST)-Long Idea
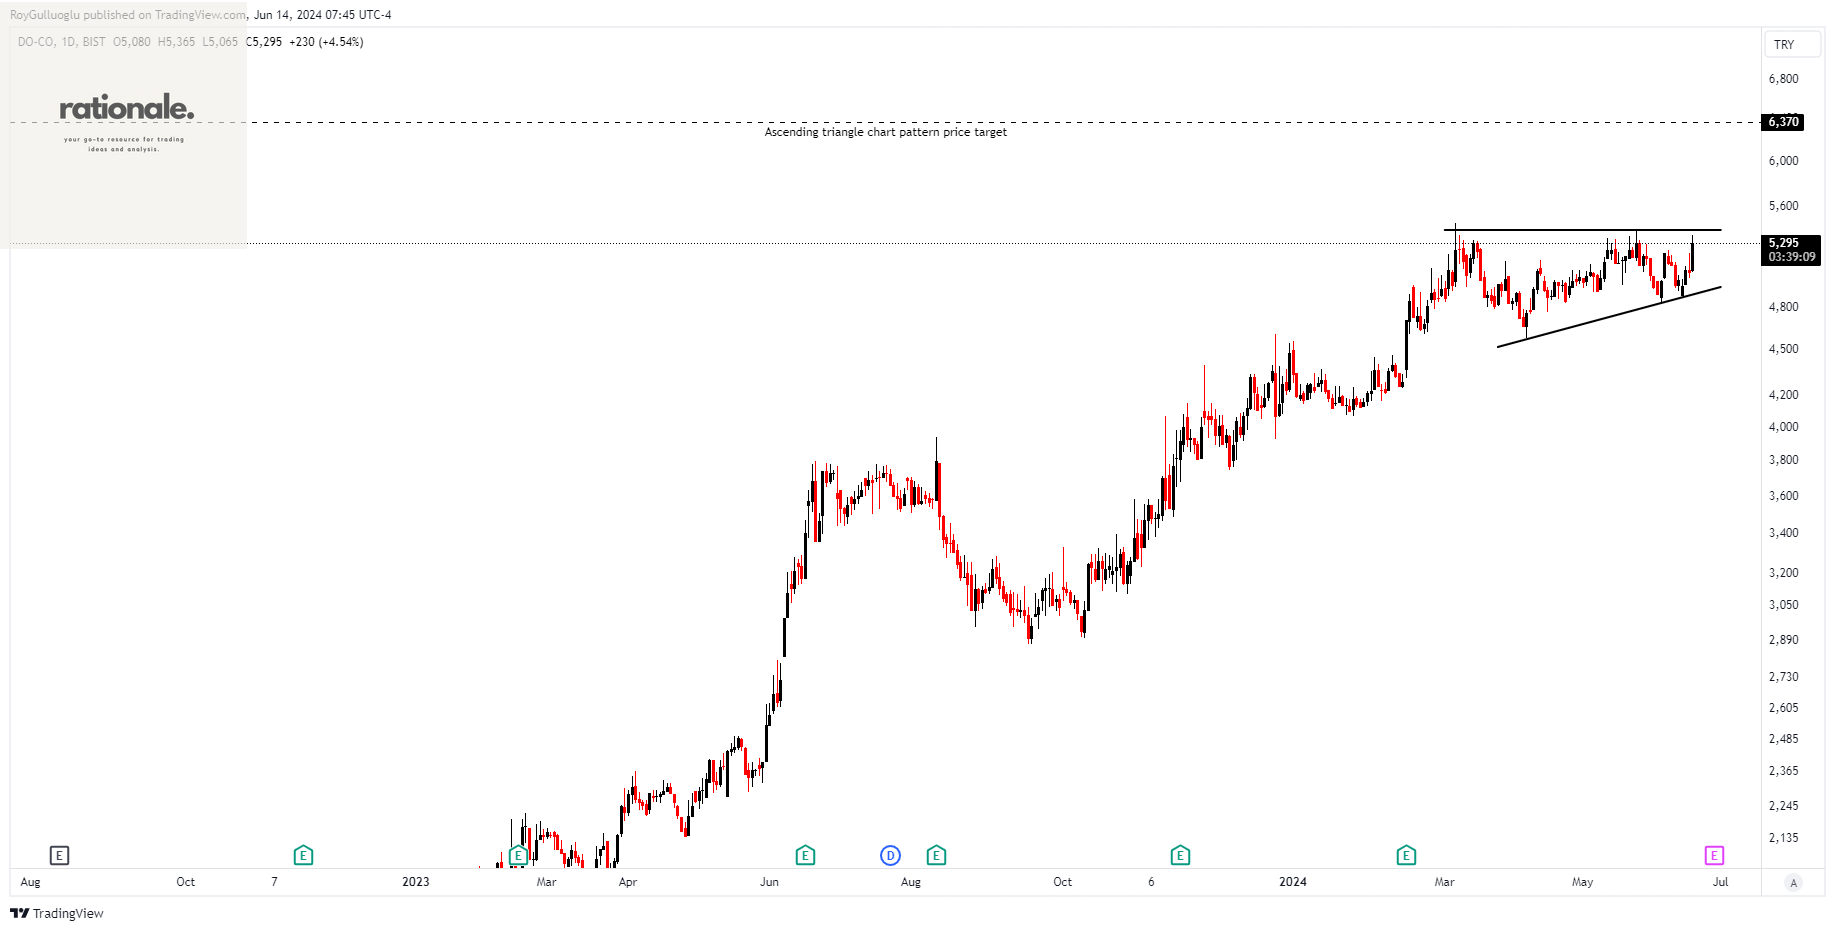
DO & CO Aktiengesellschaft offers catering services in Austria, Turkey, the United Kingdom, the United States, Spain, Germany, and globally. The company operates through three divisions: Airline Catering, International Event Catering, and Restaurants, Lounges & Hotel.
The above daily chart formed an approximately 2-month-long ascending triangle chart pattern as a bullish continuation after an uptrend.
The horizontal boundary at 5402 levels acts as a resistance within this pattern.
A daily close above 5564 levels would validate the breakout from the 2-month-long cup & handle chart pattern.
Based on this chart pattern, the potential price target is 6370 levels.
DOCO, classified under the "industrials" sector, falls under the “Value Cap - Small” stock category.
Tofas Türk Otomobil Fabrikasi Anonim Sirketi-(TOASO/BIST)-Long Idea
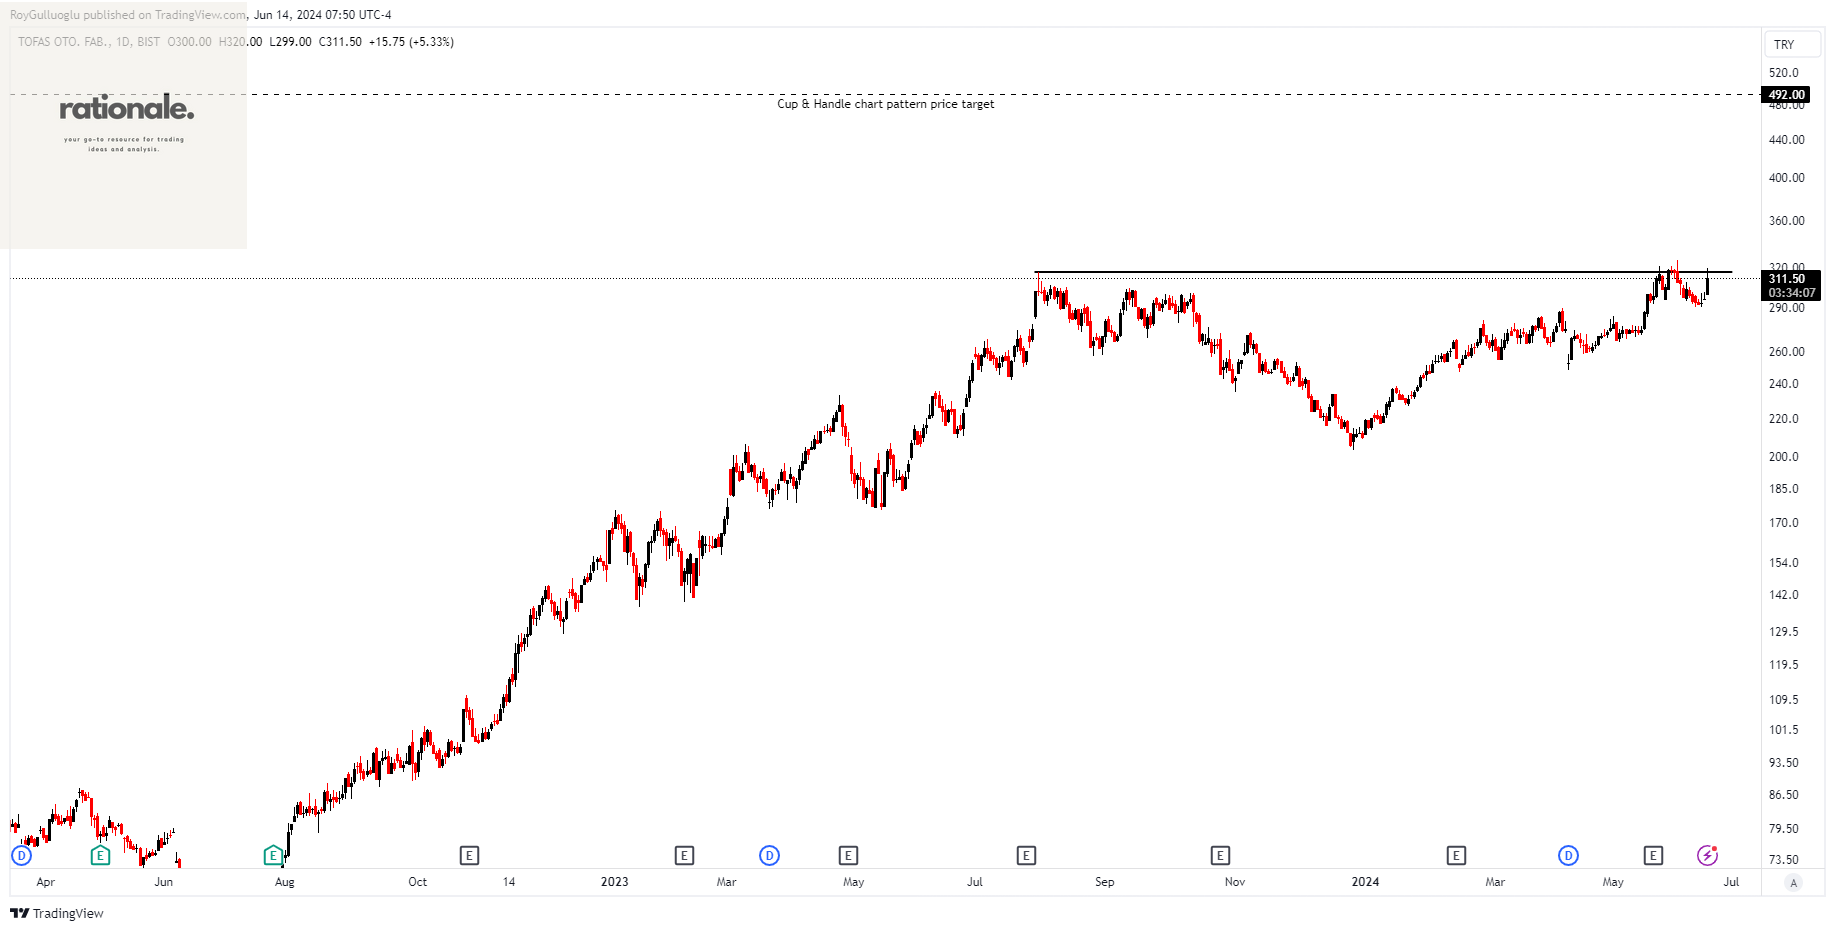
Tofas Türk Otomobil Fabrikasi Anonim Sirketi manufactures and sells passenger cars and light commercial vehicles in Turkey. The company also produces a range of automotive spare parts, engages in the trading of automobiles and spare parts, and offers consumer financing and insurance services.
The above daily chart formed an approximately 7-month-long cup & handle chart pattern as a bullish continuation after an uptrend.
The horizontal boundary at 316.5 levels acts as a resistance within this pattern.
A daily close above 326 levels would validate the breakout from the 7-month-long cup & handle chart pattern.
Based on this chart pattern, the potential price target is 492 levels.
TOASO, classified under the "consumer cyclicals" sector, falls under the “Mid Cap - Growth” stock category.
Eregli Demir ve Çelik Fabrikalari T.A.S.-(EREGL/BIST)-Long Idea
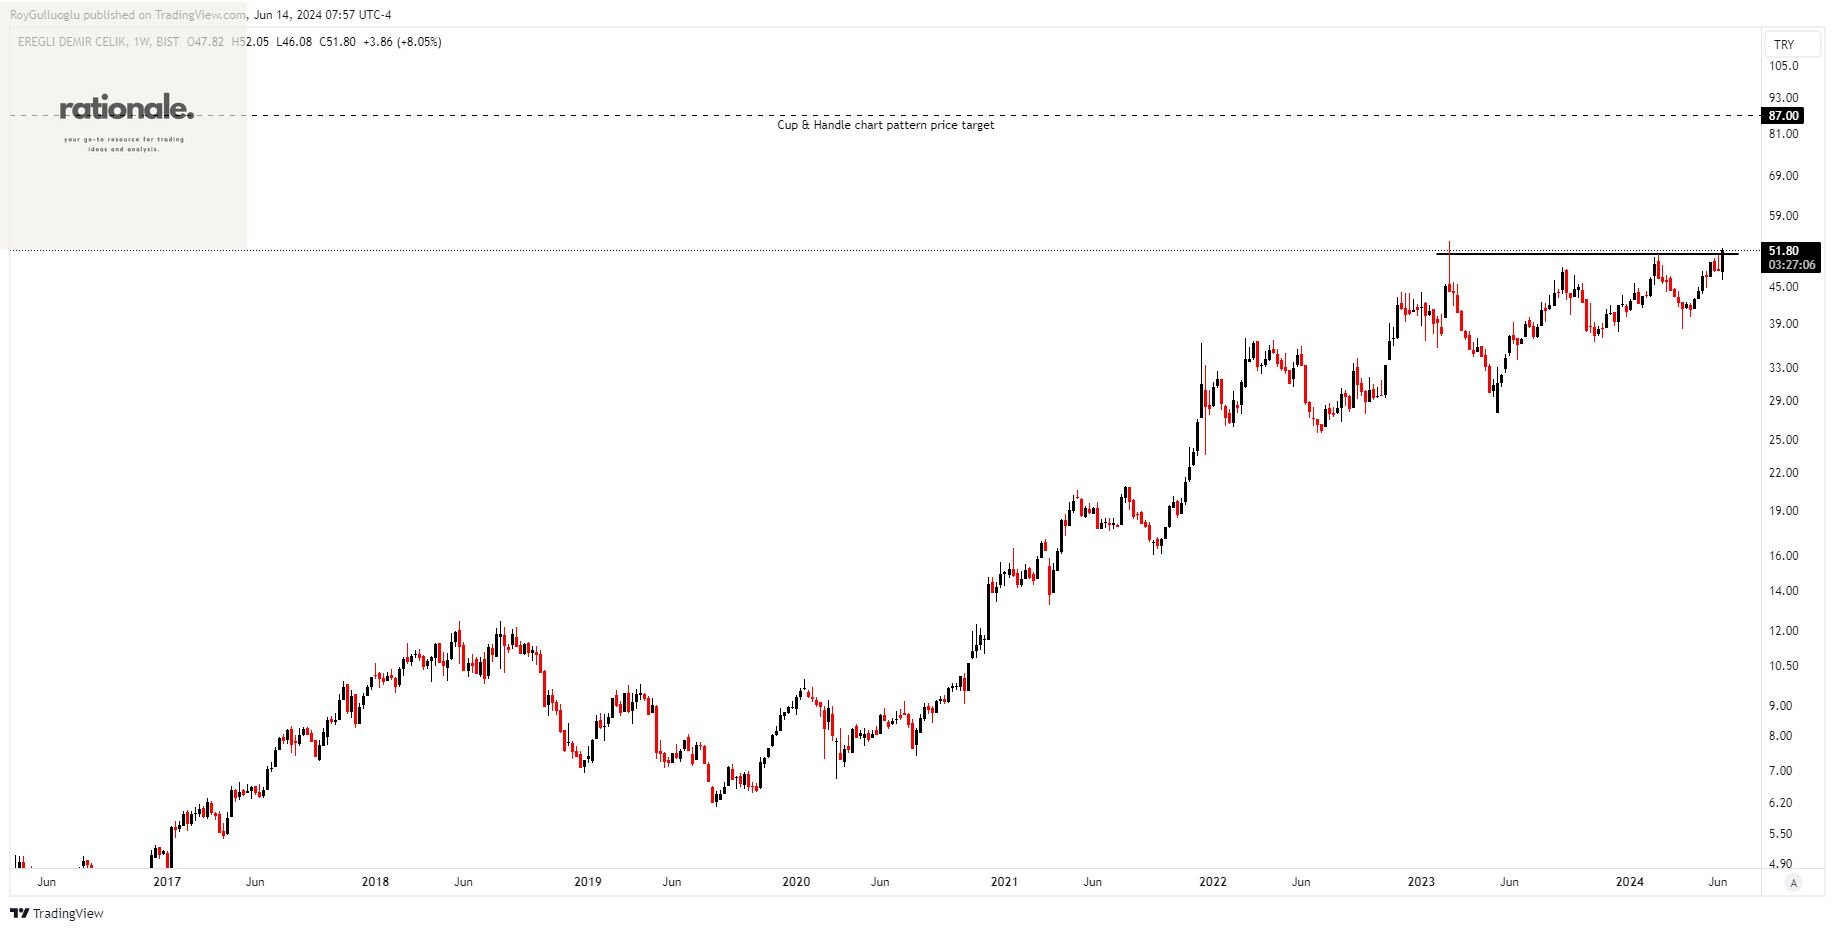
Eregli Demir ve Çelik Fabrikalari T.A.S., along with its subsidiaries, manufactures and sells iron and steel rolled products, alloyed and non-alloyed iron, steel and pig iron castings, cast and pressed products, coke, and by-products in Turkey and internationally.
The above daily chart formed an approximately 3-month-long cup & handle chart pattern as a bullish continuation after an uptrend.
The horizontal boundary at 51 levels acts as a resistance within this pattern.
A daily close above 52.5 levels would validate the breakout from the 3-month-long cup & handle chart pattern.
Based on this chart pattern, the potential price target is 87 levels.
EREGL, classified under the "basic materials" sector, falls under the “Mid Cap - Value” stock category.
Cintas Corporation-(CTAS/NASDAQ)-Long Idea
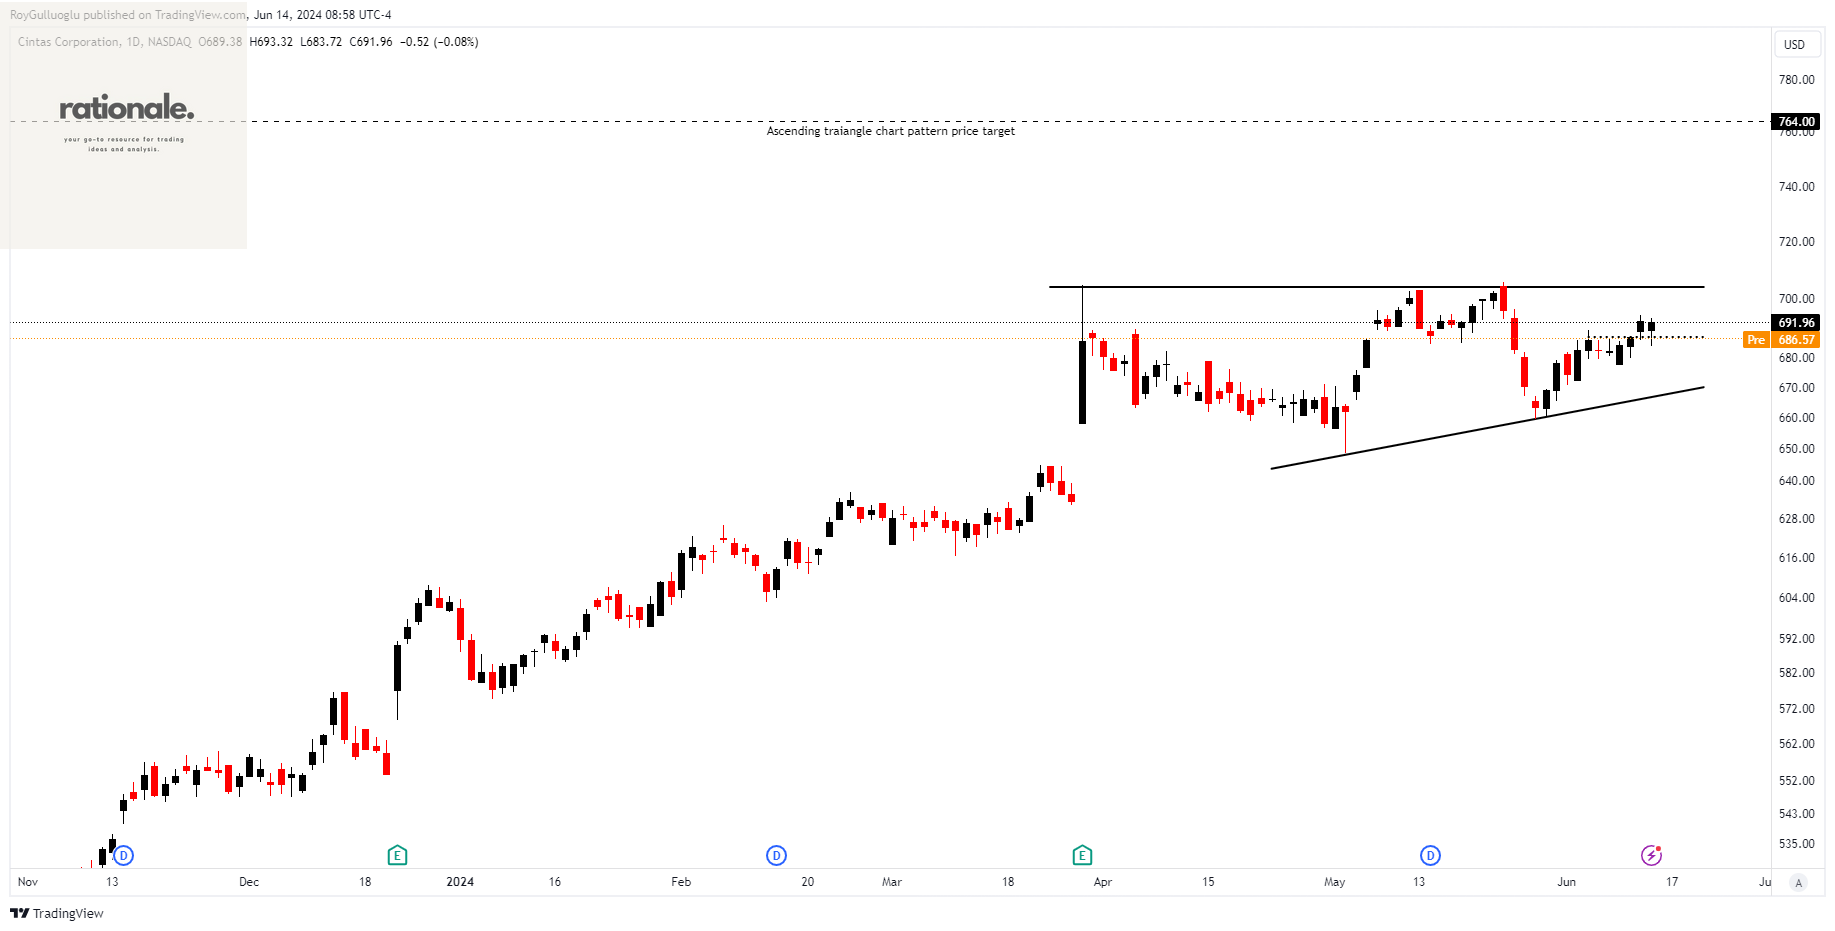
Cintas Corporation offers corporate identity uniforms and related business services primarily in the United States, Canada, and Latin America.
The above daily chart formed an approximately 2-month-long ascending triangle chart pattern as a bullish continuation after an uptrend.
The horizontal boundary at 704 levels acts as a resistance within this pattern.
A daily close above 725 levels would validate the breakout from the 2-month-long ascending triangle chart pattern.
Based on this chart pattern, the potential price target is 764 levels.
CTAS, classified under the "industrials" sector, falls under the “Large Cap - Value” stock category.
PennyMac Financial Services, Inc.-(PFSI/NYSE)-Long Idea
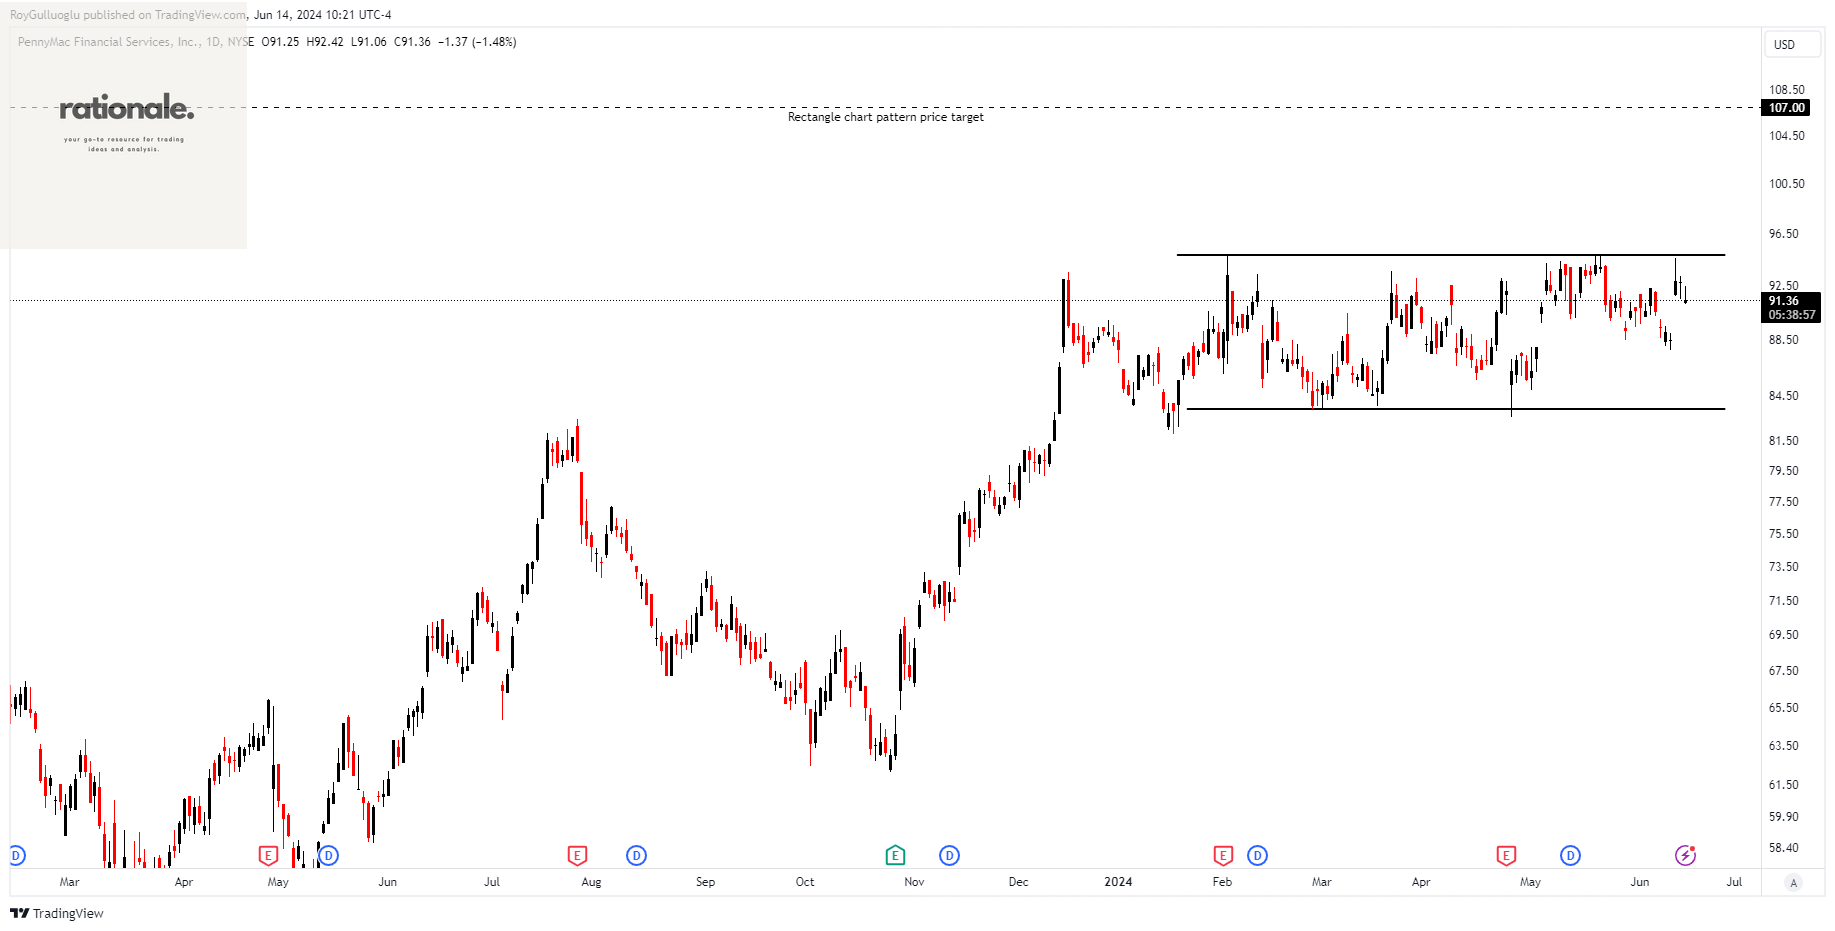
PennyMac Financial Services, Inc., through its subsidiaries, engages in mortgage banking and investment management activities in the United States.
The above daily chart formed an approximately 3-month-long rectangle chart pattern as a bullish continuation after an uptrend.
The horizontal boundary at 94.81 levels acts as a resistance within this pattern.
A daily close above 97.65 levels would validate the breakout from the 3-month-long rectangle chart pattern.
Based on this chart pattern, the potential price target is 107 levels.
PFSI, classified under the "financial services" sector, falls under the “Mid Cap - Income” stock category.
UMB Financial Corporation-(UMBF/NASDAQ)-Long Idea
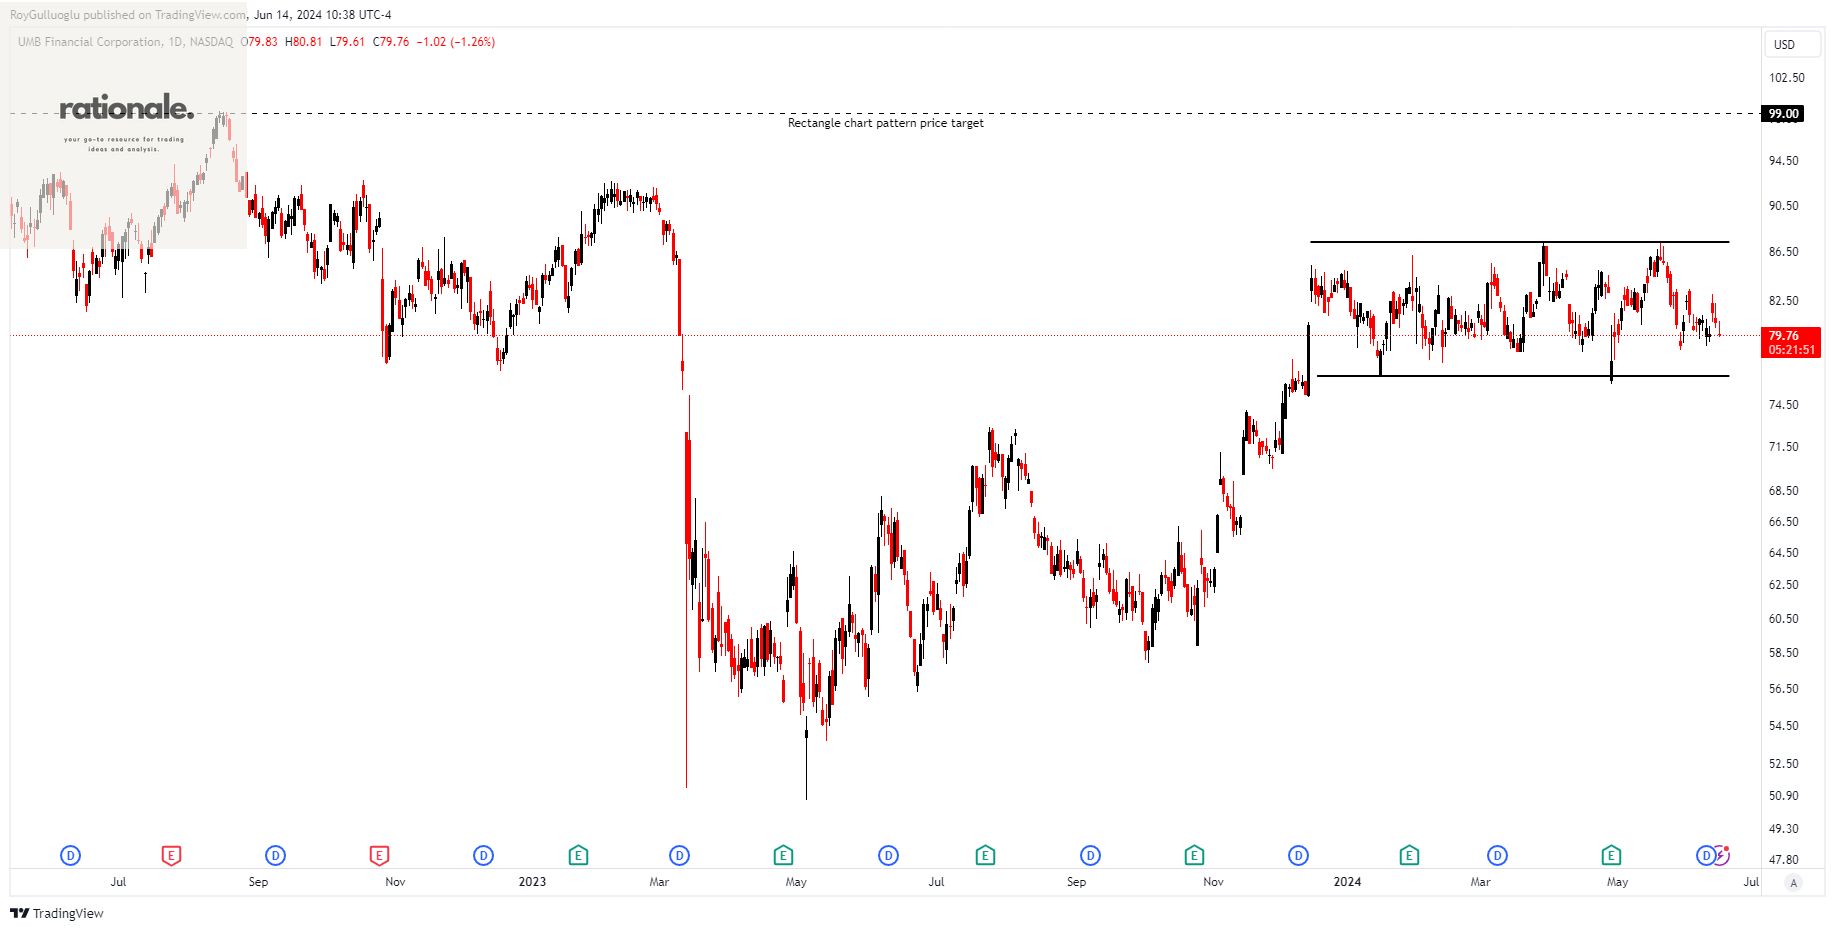
UMB Financial Corporation operates as a bank holding company, offering banking services and asset servicing both in the United States and internationally.
The above daily chart formed an approximately 4-month-long rectangle chart pattern as a bullish continuation after an uptrend.
The horizontal boundary at 87.3 levels acts as a resistance within this pattern.
A daily close above 89.91 levels would validate the breakdown from the 4-month-long rectangle chart pattern.
Based on this chart pattern, the potential price target is 99 levels.
UMBF, classified under the "financial services" sector, falls under the “Mid Cap - Income” stock category.
Atlanta Braves Holdings, Inc.-(BATRA/NASDAQ)-Long Idea
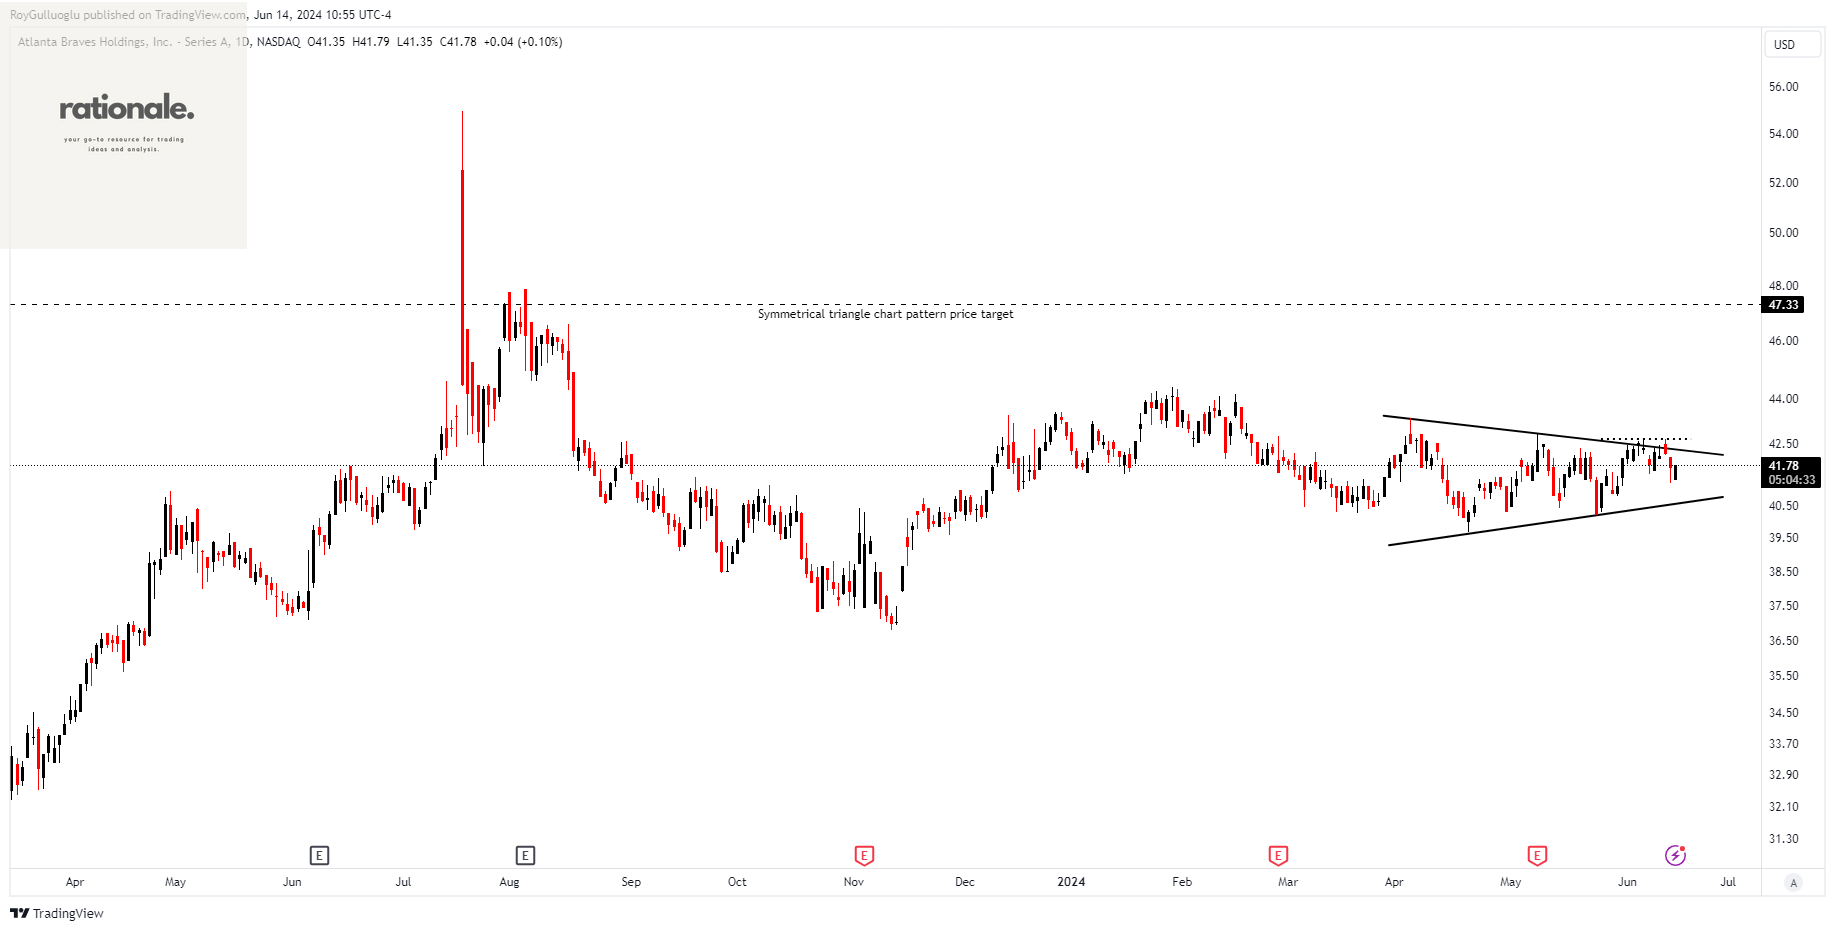
Atlanta Braves Holdings, Inc. owns and operates the Atlanta Braves Major League Baseball club. It also manages a mixed-use development project that includes retail, office, hotel, and entertainment facilities.
The above daily chart formed an approximately 2-month-long symmetrical triangle chart pattern.
The horizontal boundary at 42.64 levels acts as a resistance within this pattern.
A daily close above 43.92 levels would validate the breakdown from the 4-month-long rectangle chart pattern.
Based on this chart pattern, the potential price target is 47.33 levels.
BATRA, classified under the "communication services" sector, falls under the “Mid Cap - Growth” stock category.
Forestar Group Inc.-(FOR/NYSE)-Short Idea
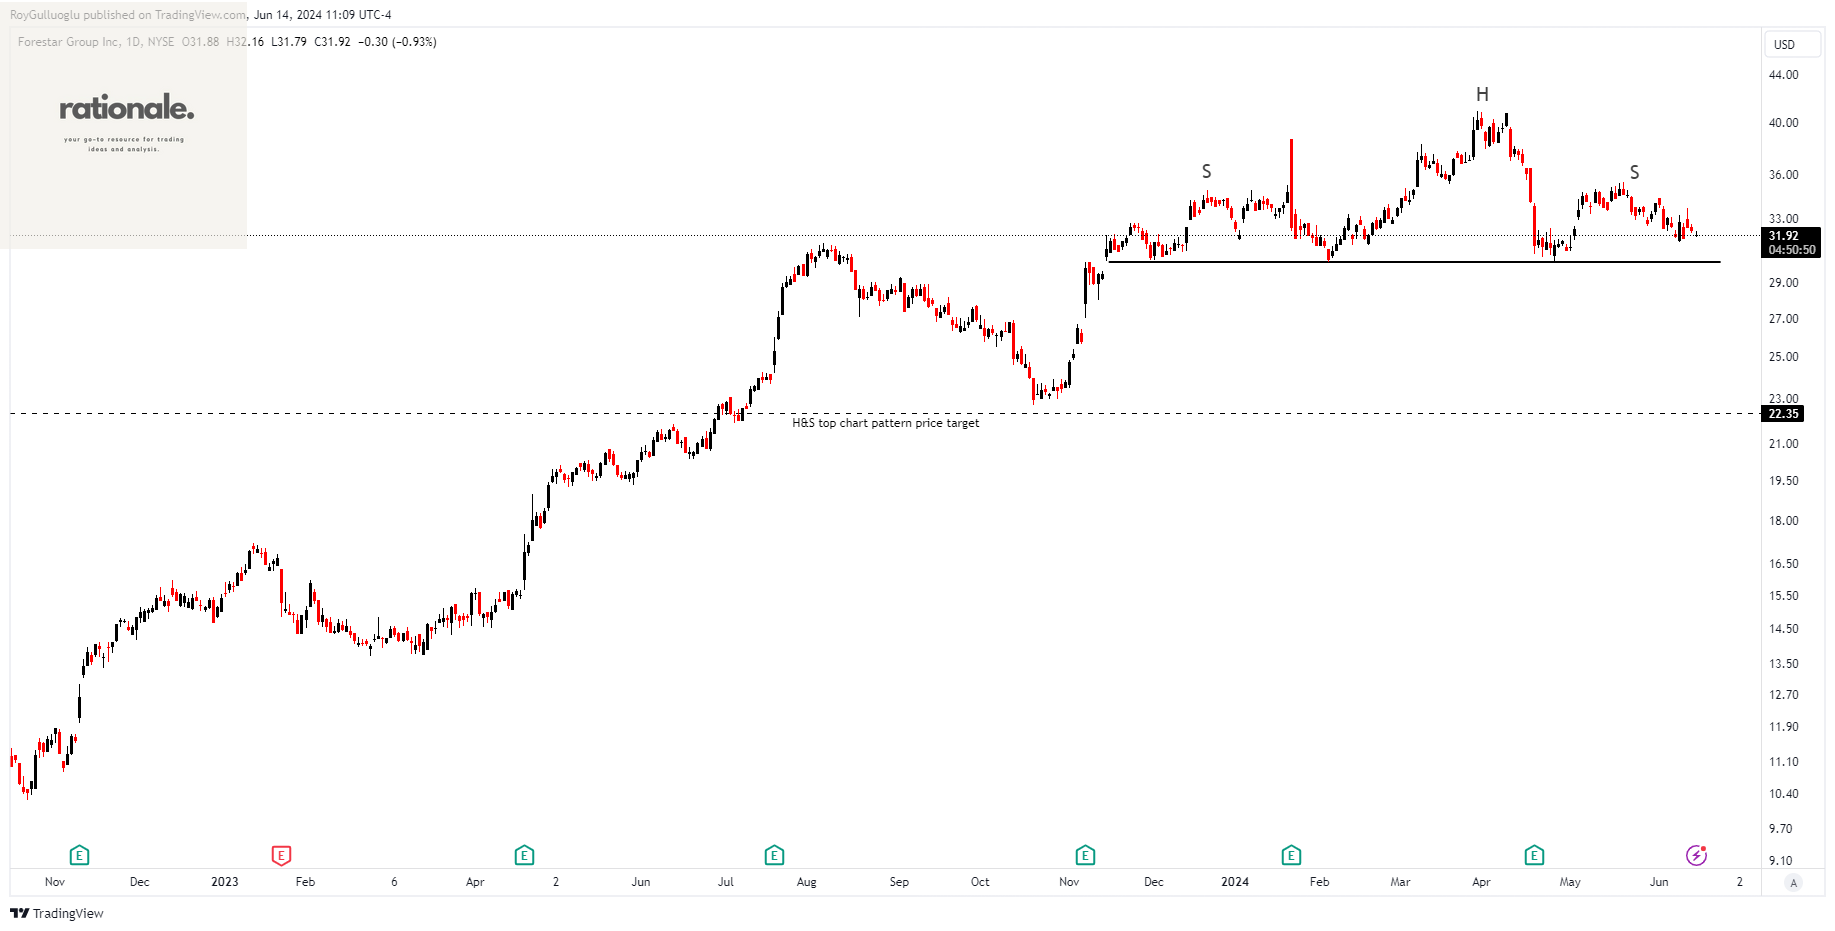
Forestar Group Inc. operates as a residential lot development company in the United States, acquiring land and developing infrastructure for single-family residential communities.
The above daily chart formed an approximately 5-month-long H&S top chart pattern as a bearish reversal after an uptrend.
The horizontal boundary at 30.26 levels acts as a support within this pattern.
A daily close below 29.35 levels would validate the breakdown from the 5-month-long H&S top chart pattern.
Based on this chart pattern, the potential price target is 22.35 levels.
FOR, classified under the "real estate" sector, falls under the “Small Cap - Income” stock category.
Wus Printed Circuit (Kunshan) Co., Ltd.-(002463/SZSE)-Long Idea
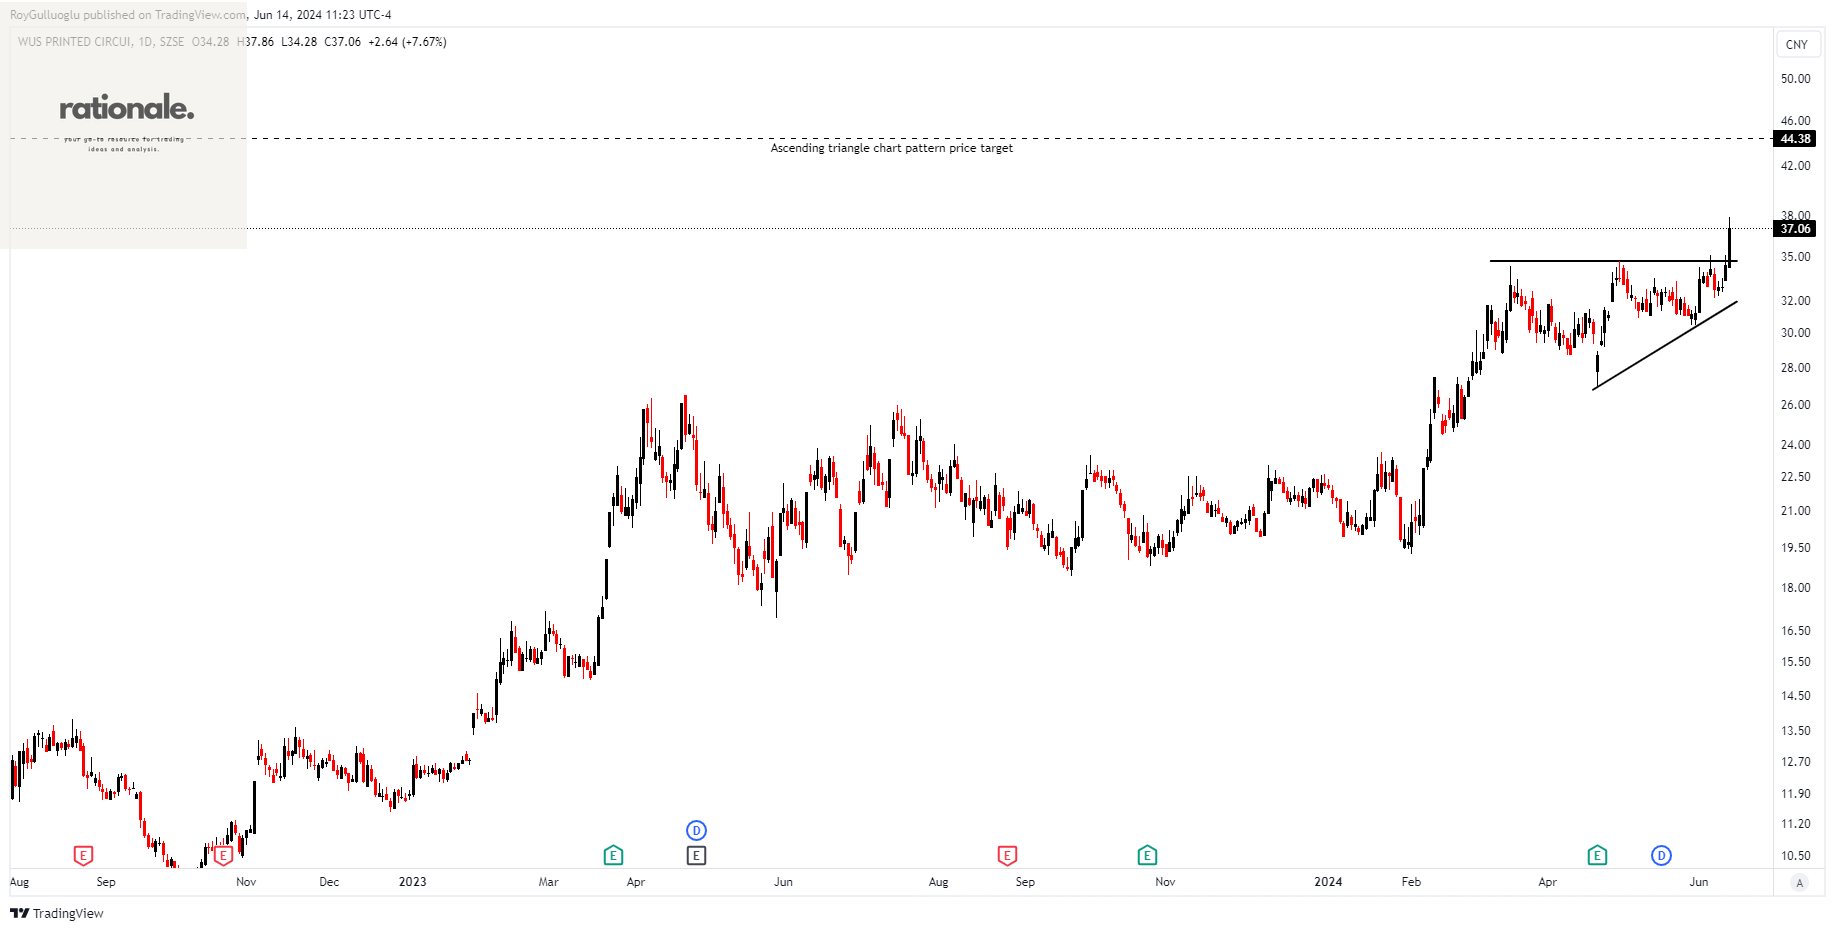
Wus Printed Circuit (Kunshan) Co., Ltd. is involved in the research, development, design, manufacture, and sale of printed circuit boards in China.
The above daily chart formed an approximately 2-month-long ascending triangle chart pattern as a bullish continuation after an uptrend.
The horizontal boundary at 34.66 levels acted as a resistance within this pattern.
A daily close above 35.7 levels would validate the breakout from the 2-month-long ascending triangle chart pattern.
Based on this chart pattern, the potential price target is 44.38 levels.
002463, classified under the "technology" sector, falls under the “Mid Cap - Growth” stock category.
T&D Holdings, Inc.-(8795/TSE)-Long Idea
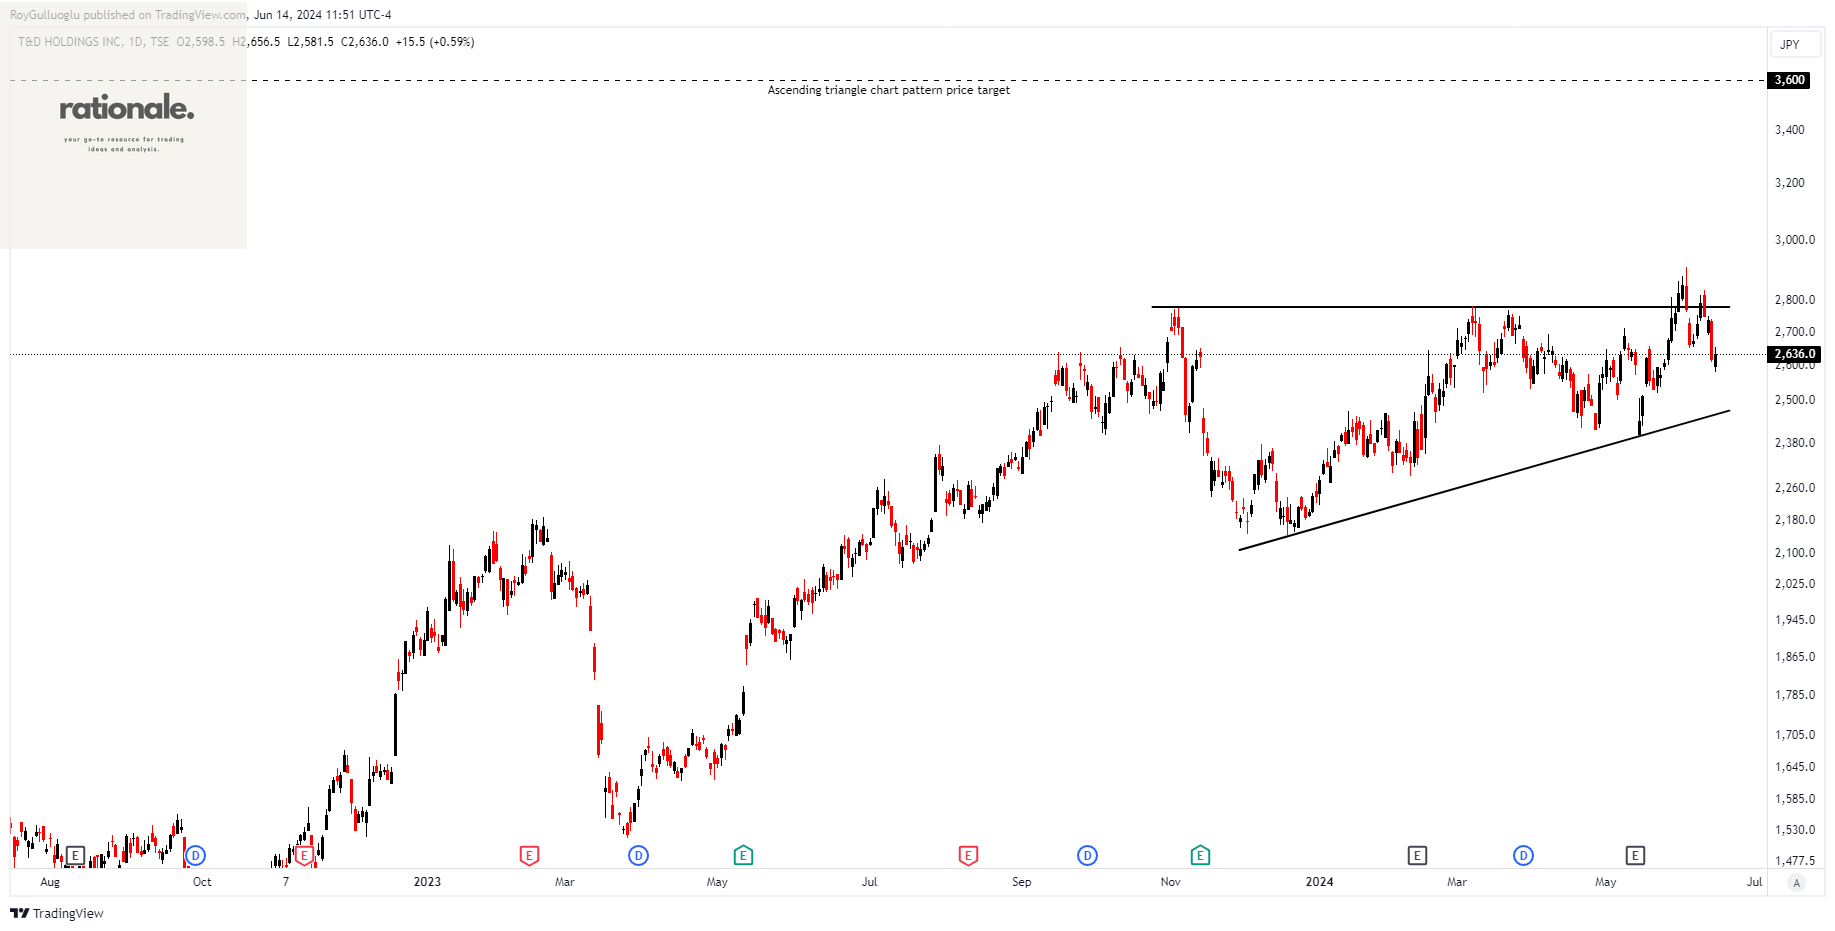
T&D Holdings, Inc., through its subsidiaries, primarily provides insurance products and services in Japan.
The above daily chart formed an approximately 5-month-long ascending triangle chart pattern as a bullish continuation after an uptrend.
The horizontal boundary at 2780 levels acted as a resistance within this pattern.
A daily close above 2863 levels would validate the breakout from the 5-month-long ascending triangle chart pattern.
Based on this chart pattern, the potential price target is 3600 levels.
8795, classified under the "financial services" sector, falls under the “Mid Cap - Income” stock category.
Teşekkürler Roy..