


Opendoor Technologies Inc.-(OPEN/NASDAQ)-Short Idea
Opendoor Technologies Inc. operates a digital platform for residential real estate transactions in the United States.
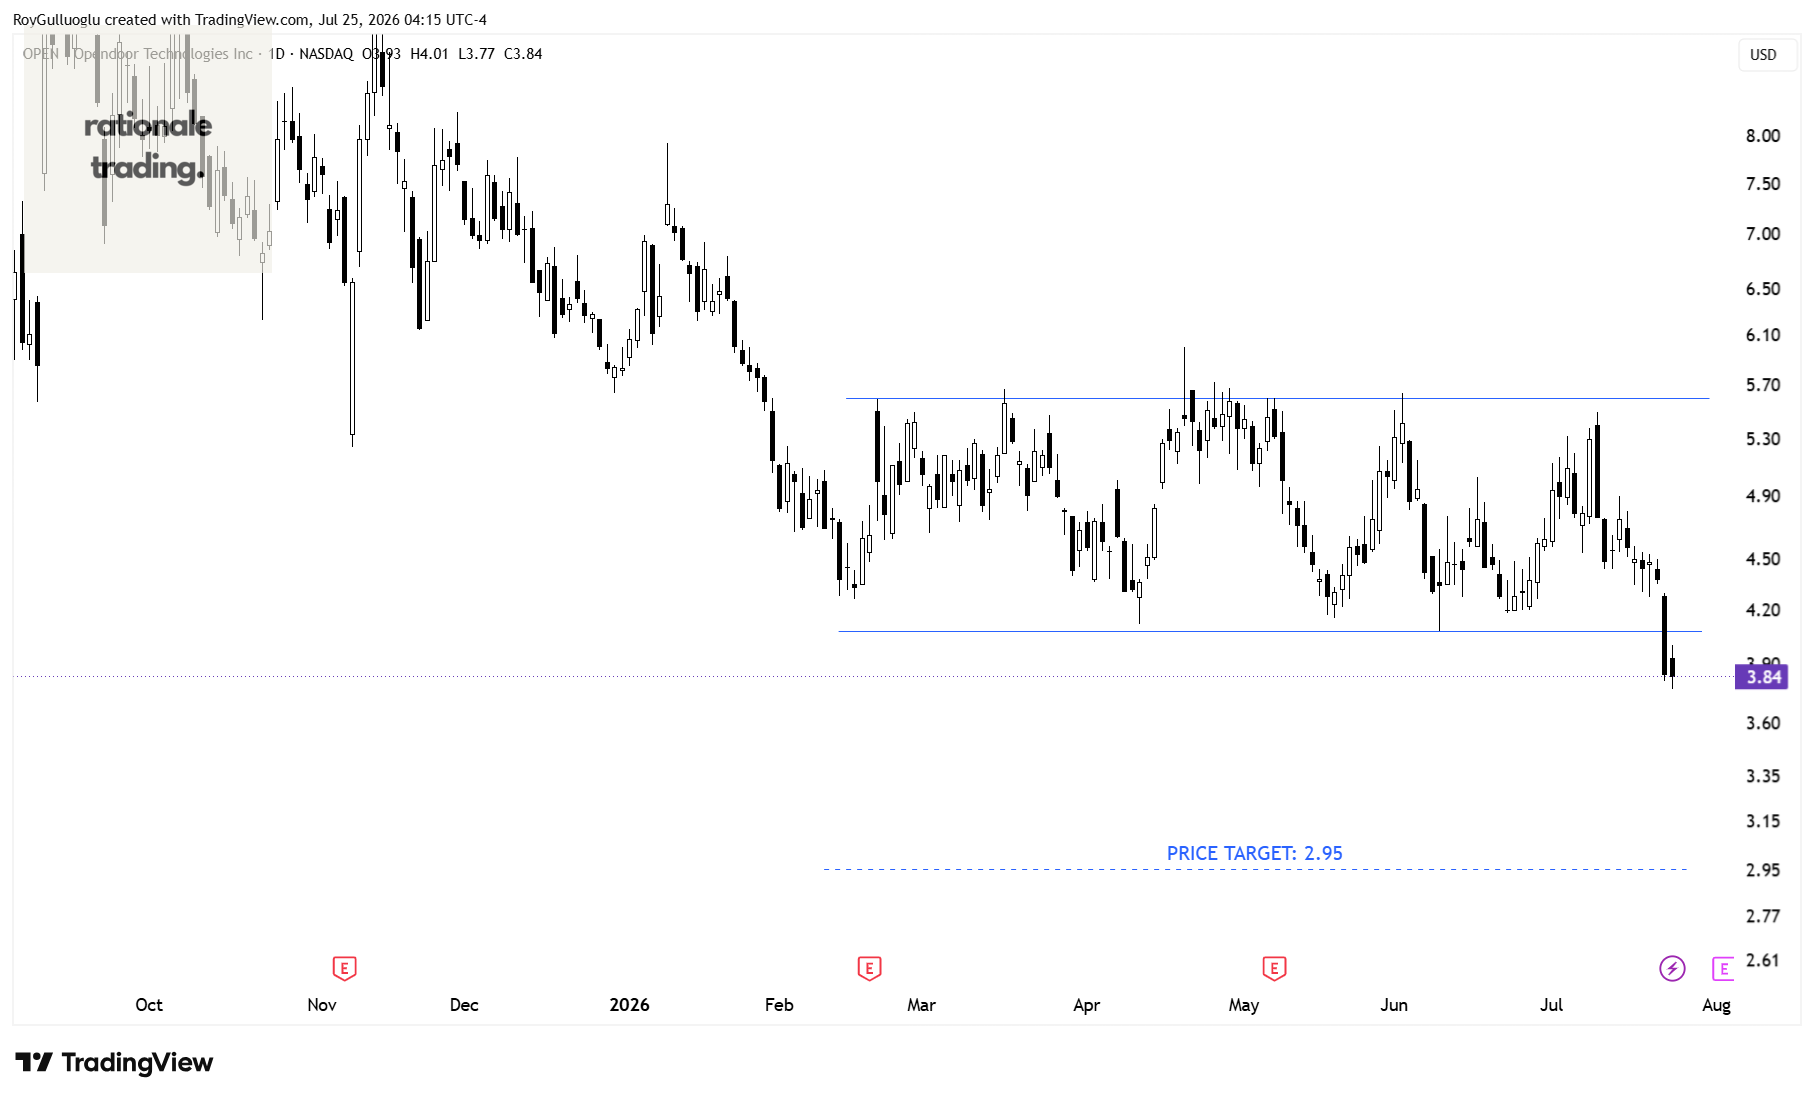
The above daily chart formed an approximately 4-month-long rectangle chart pattern as a bullish continuation after an uptrend.
Within this pattern, the horizontal boundary at 4.08 levels acted as a resistance.
A daily close below 3.97 levels validated the breakout from the 4-month-long rectangle chart pattern.
Based on this chart pattern, the potential price target is 2.95 levels.
Monte Rosa Therapeutics, Inc.-(GLUE/NASDAQ)-Long Idea
Monte Rosa Therapeutics, Inc., a clinical-stage biotechnology company, engages in the development of novel small molecule precision medicines that employ the body’s natural mechanisms to selectively degrade therapeutically relevant proteins.
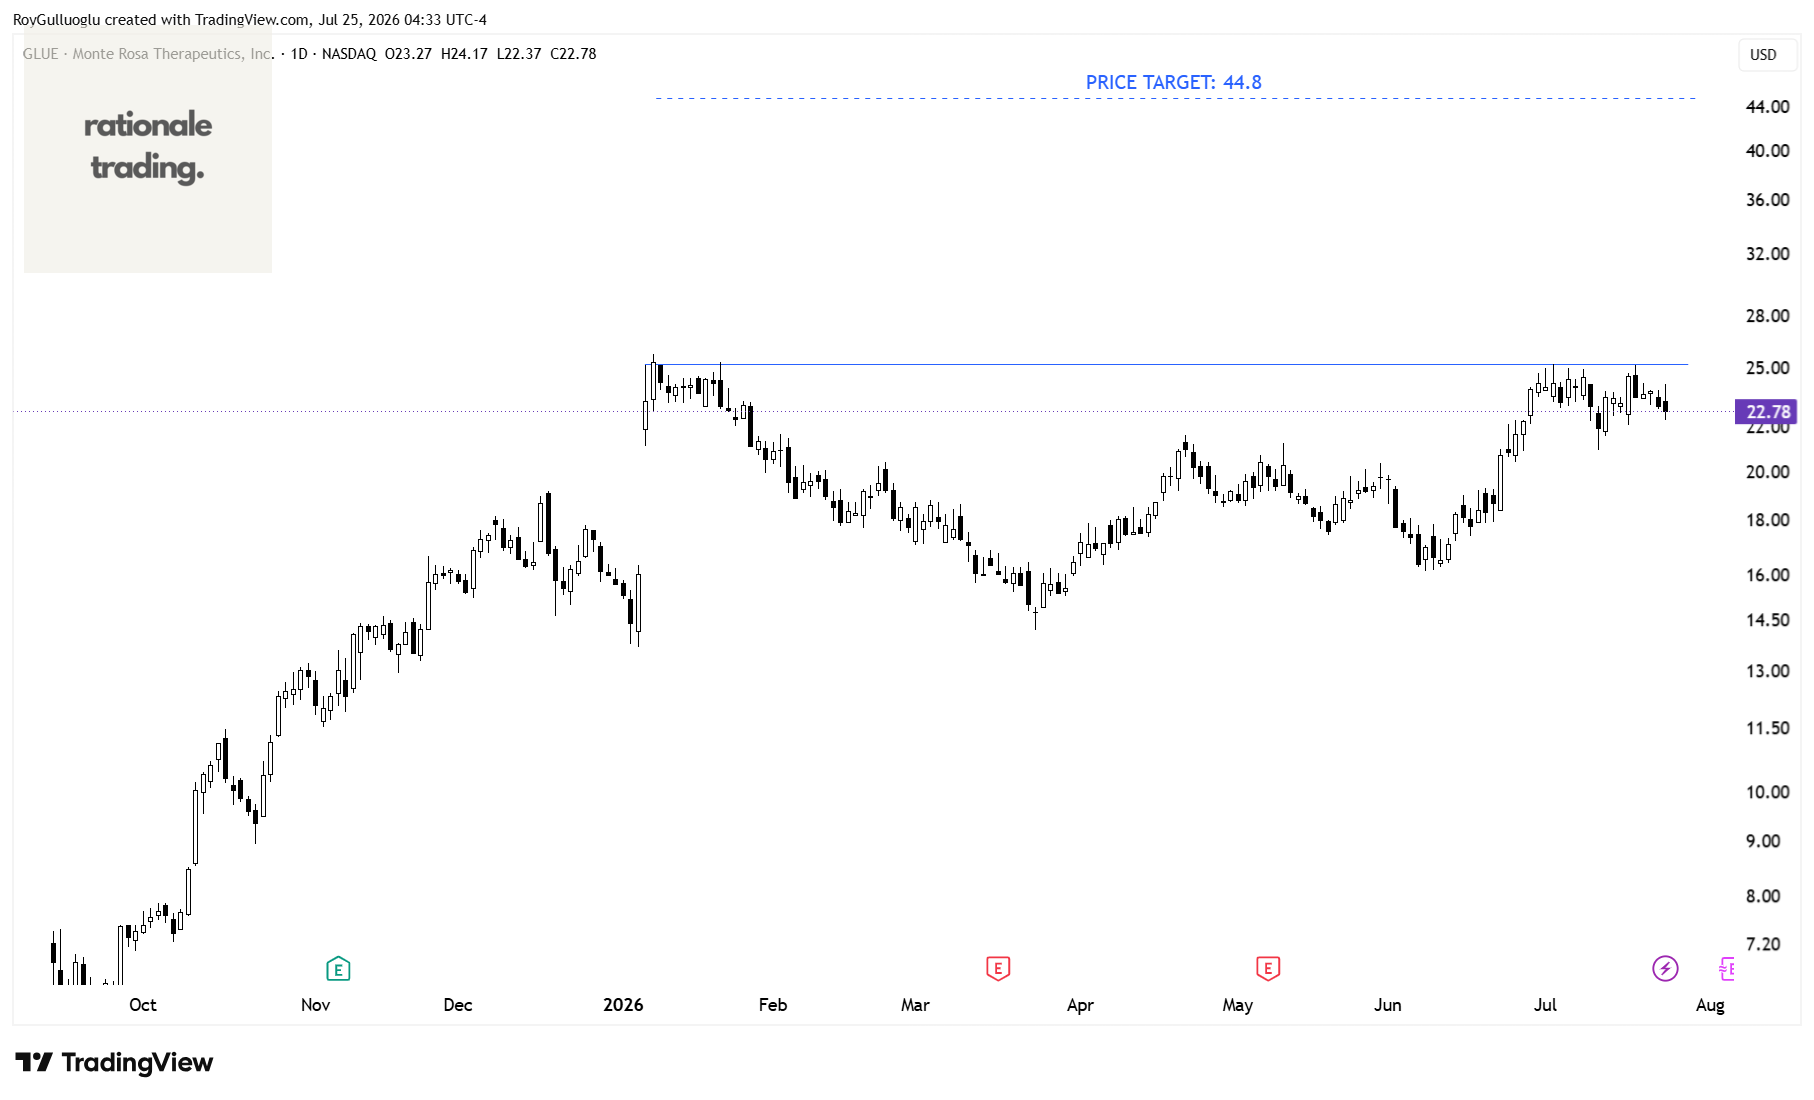
The above daily chart formed an approximately 4-month-long cup & handle chart pattern as a bullish continuation after an uptrend.
Within this pattern, the horizontal boundary at 25.22 levels acts as a resistance.
A daily close above 25.98 levels would validate the breakout from the 4-month-long cup & handle chart pattern.
Based on this chart pattern, the potential price target is 44.8 levels.
Alto Neuroscience, Inc.-(ANRO/NYSE)-Long Idea
Alto Neuroscience, Inc. operates as a clinical-stage biopharmaceutical company in the United States.
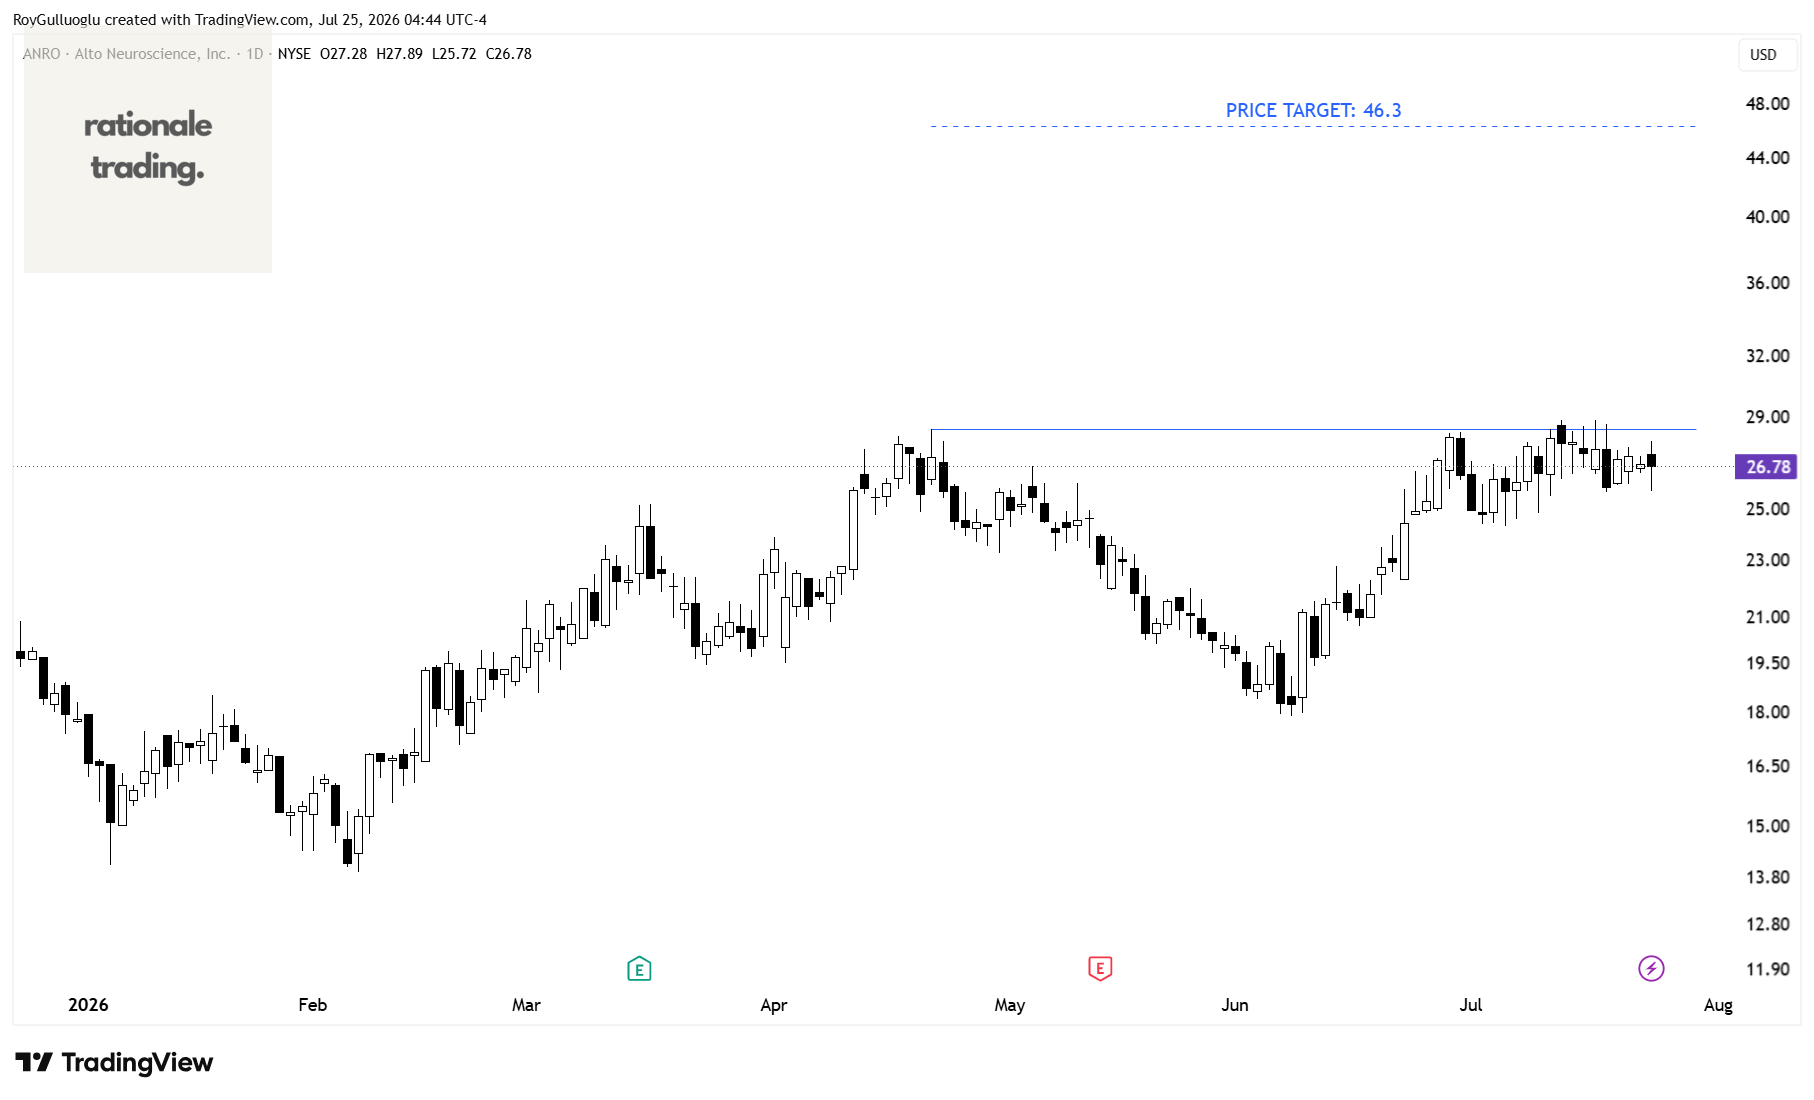
The above daily chart formed an approximately 2-month-long cup & handle chart pattern as a bullish continuation after an uptrend.
Within this pattern, the horizontal boundary at 28.44 levels acts as a resistance.
A daily close above 29.3 levels would validate the breakout from the 2-month-long cup & handle chart pattern.
Based on this chart pattern, the potential price target is 46.3 levels.
Blackstone Inc.-(BX/NYSE)-Long Idea
Blackstone Inc. is an alternative asset management firm specializing in private equity, venture capital, real estate, hedge fund solutions, credit, secondary funds of funds, public debt and equity and multi-asset class strategies.
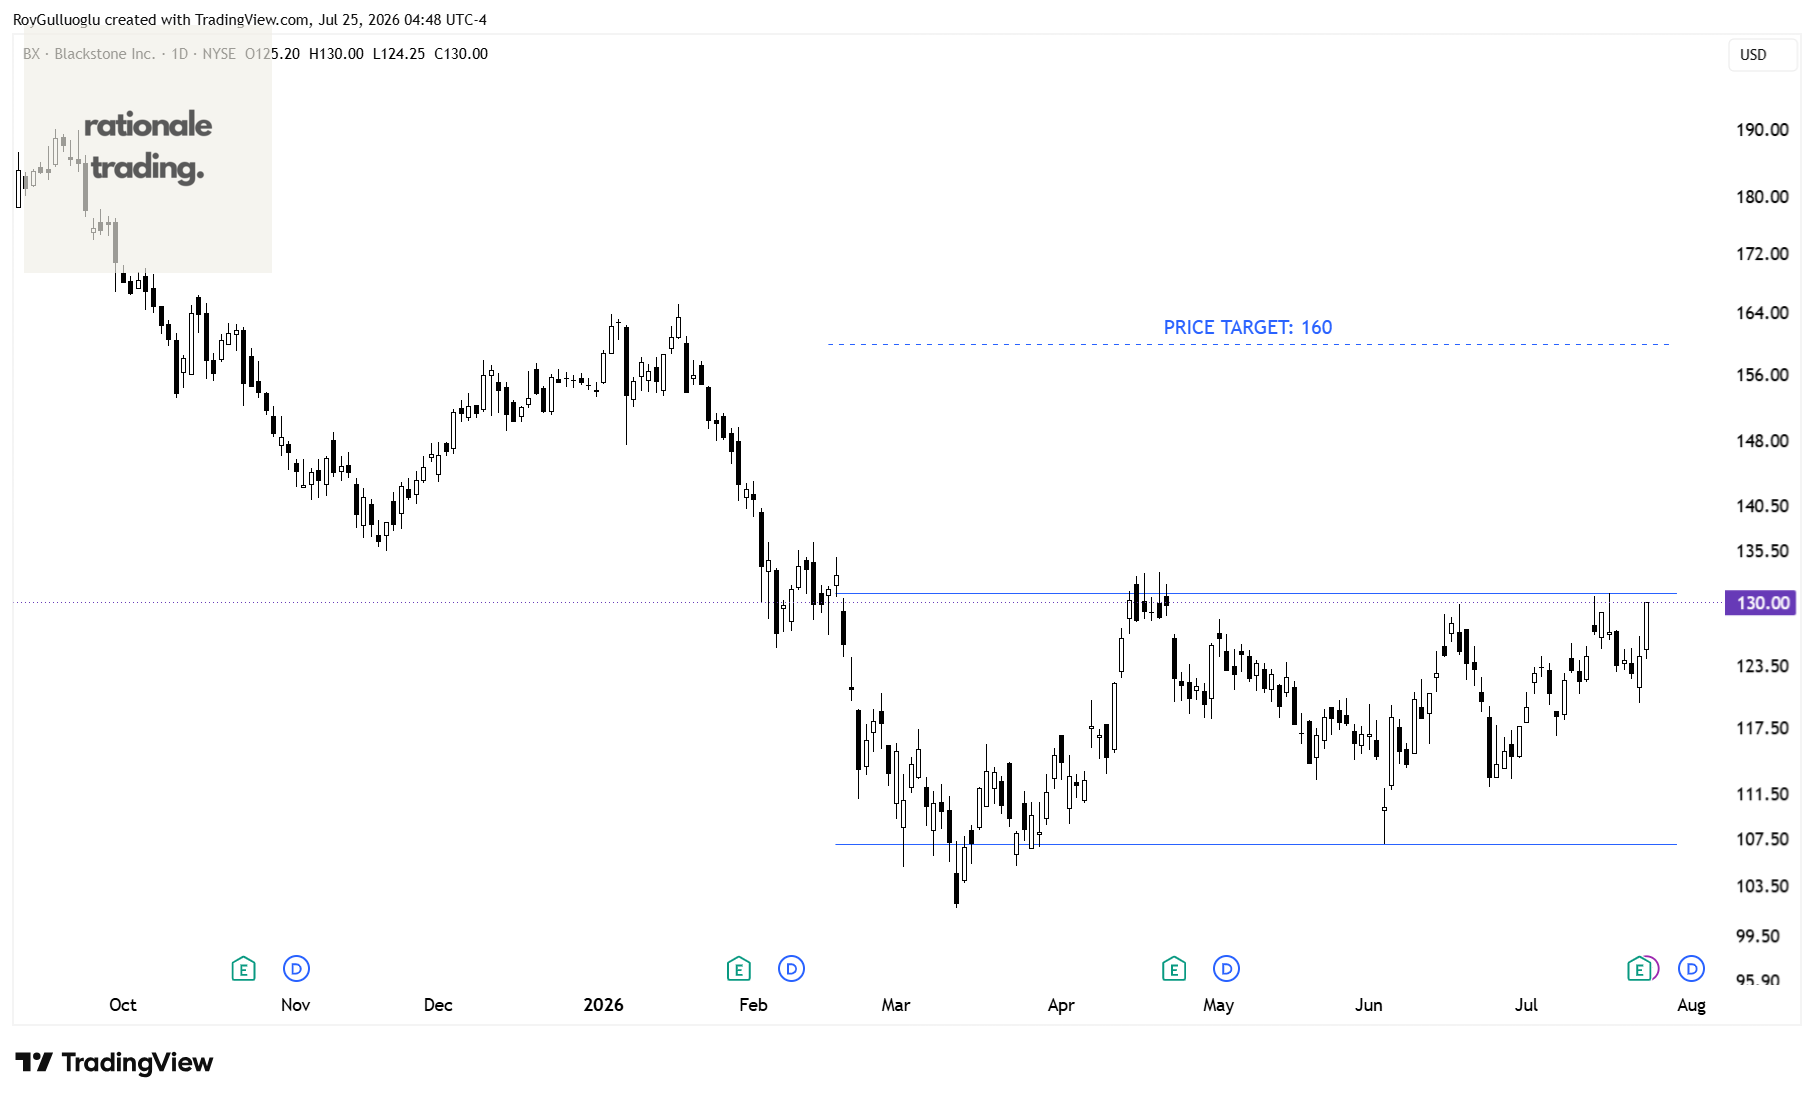
The above daily chart formed an approximately 3-month-long rectangle chart pattern as a bullish reversal after a downtrend.
Within this pattern, the horizontal boundary at 131 levels acts as a resistance.
A daily close above 134.9 levels would validate the breakout from the 3-month-long rectangle chart pattern.
Based on this chart pattern, the potential price target is 160 levels.