


New setups
TICKERS: ALLY(NYSE), SNV(NYSE), TFIN(NASDAQ), ENLC(NYSE), 002371(SZSE), 8593(TSE), 7729(TSE), PSN(LSE), KOZAA(BIST)
Ally Financial Inc.-(ALLY/NYSE)-Long Idea
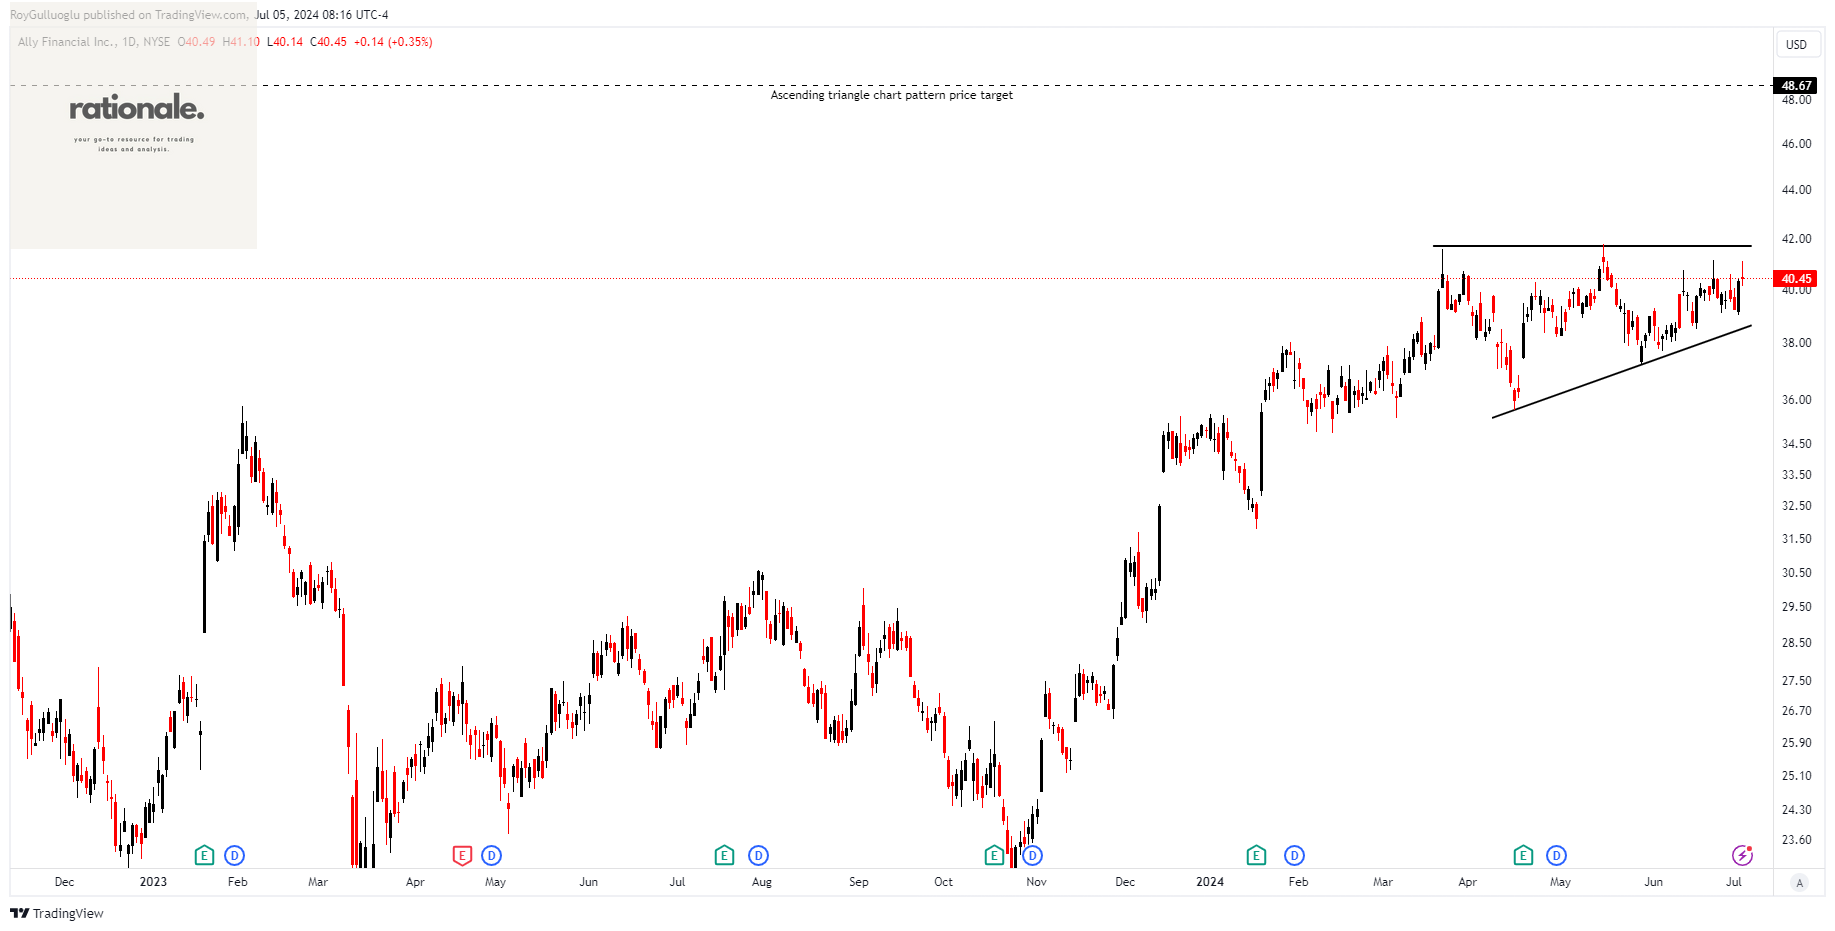
Ally Financial Inc., a digital financial services company, offers a range of digital financial products and services in the United States, Canada, and Bermuda.
The above daily chart formed an approximately 3-month-long ascending triangle chart pattern as a bullish continuation after an uptrend.
The horizontal boundary at 41.68 levels acts as a resistance within this pattern.
A daily close above 42.93 levels would validate the breakdown from the 3-month-long ascending triangle chart pattern.
Based on this chart pattern, the potential price target is 48.67 levels.
ALLY, classified under the "financial services" sector, falls under the “Large Cap - Income” stock category.
Synovus Financial Corp.-(SNV/NYSE)-Long Idea
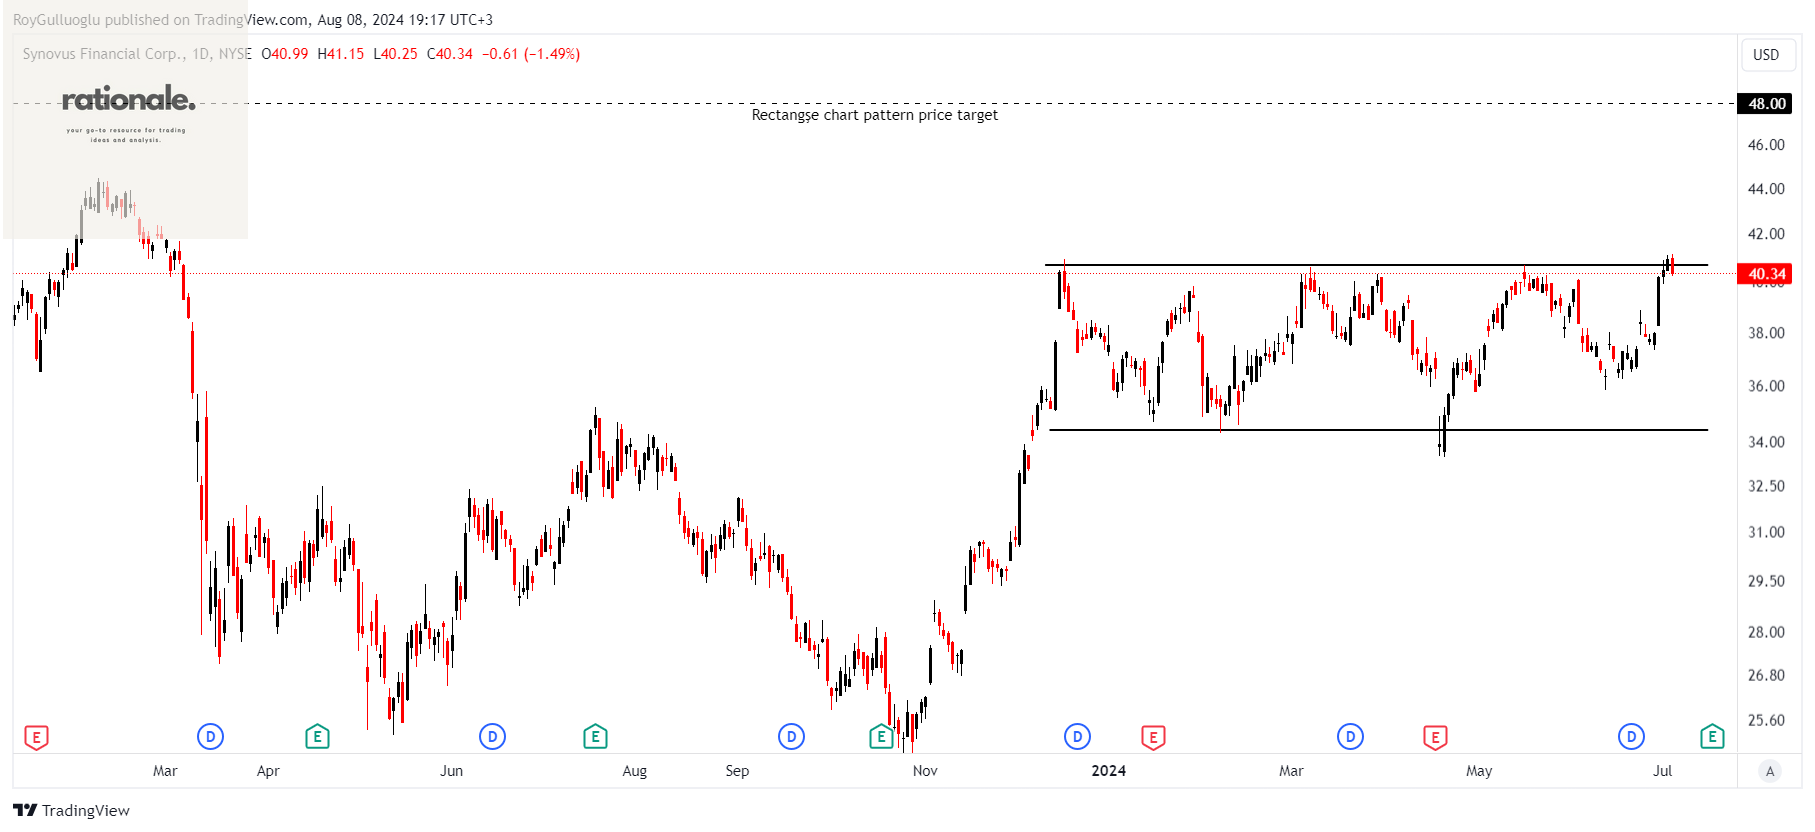
Synovus Financial Corp. serves as the bank holding company for Synovus Bank, offering a range of commercial and consumer banking products and services.
The above daily chart formed an approximately 4-month-long rectangle chart pattern as a bullish continuation after an uptrend.
The horizontal boundary at 40.69 levels acts as a resistance within this pattern.
A daily close above 41.91 levels would validate the breakout from the 4-month-long rectangle chart pattern.
Based on this chart pattern, the potential price target is 47.5 levels.
SNV, classified under the "financial services" sector, falls under the “Mid Cap - Income” stock category.
Triumph Financial, Inc.-(TFIN/NASDAQ)-Long Idea
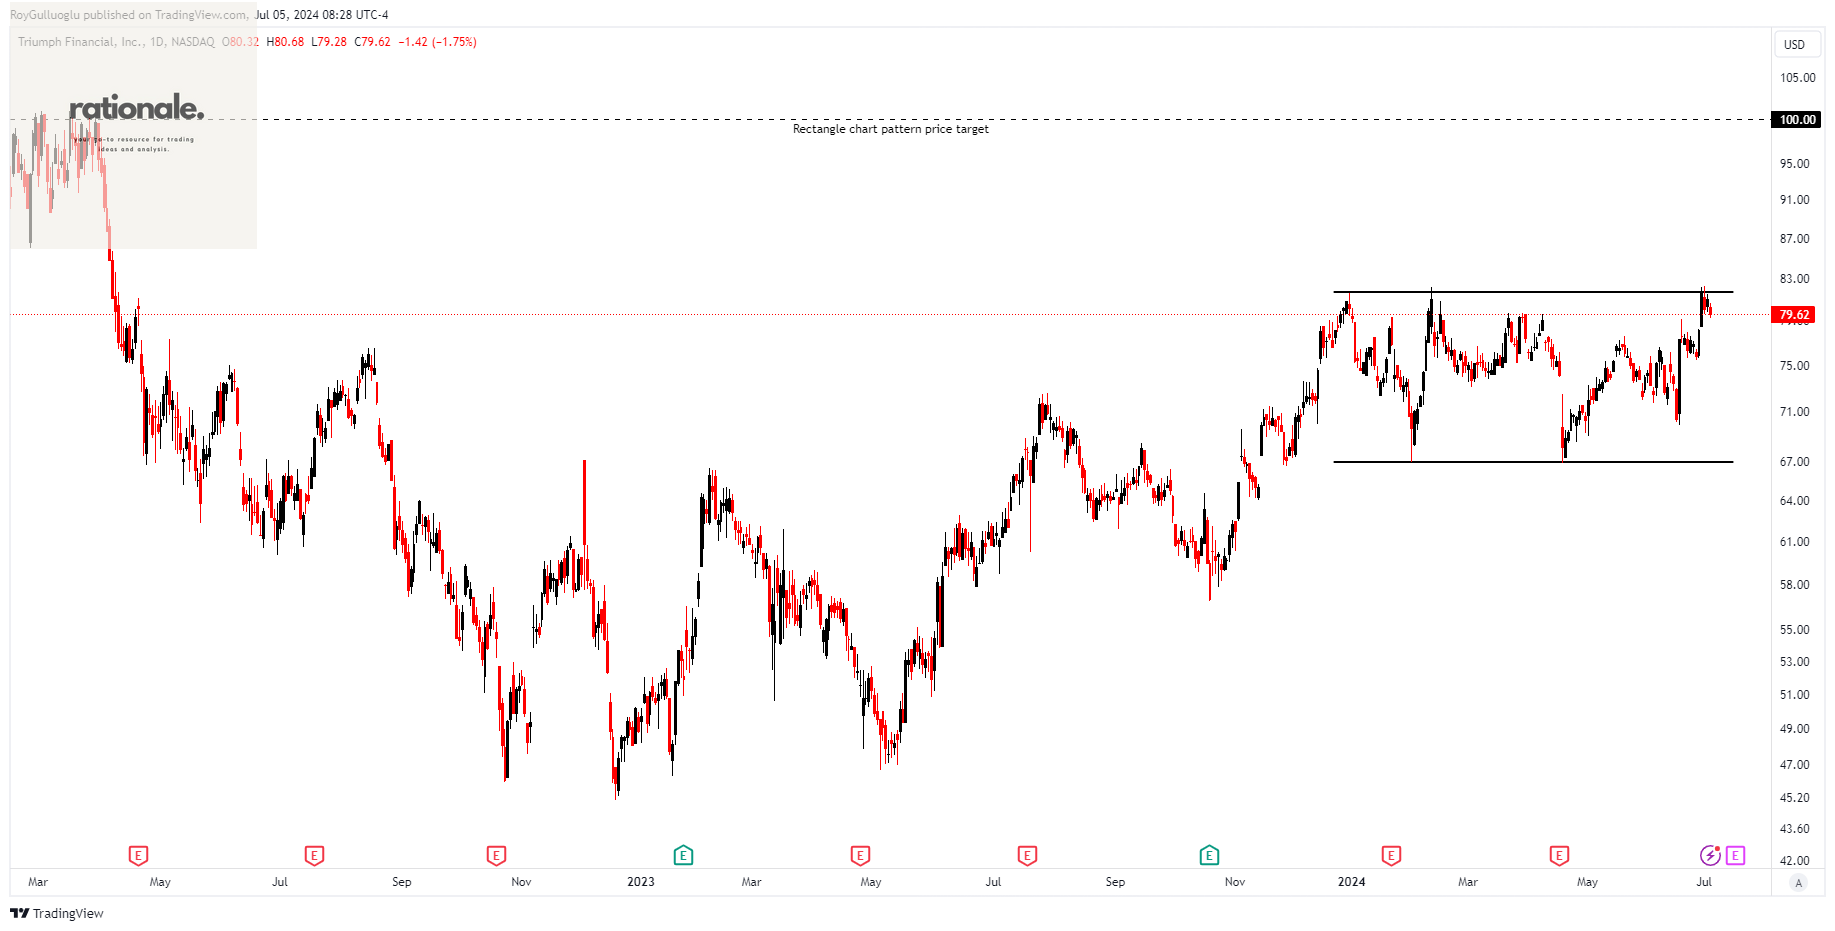
Triumph Financial, Inc., a financial holding company, offers a variety of payments, factoring, and banking services in the United States.
The above daily chart formed an approximately 4-month-long rectangle chart pattern as a bullish continuation after an uptrend.
The horizontal boundary at 81.7 levels acts as a resistance within this pattern.
A daily close above 84.15 levels would validate the breakout from the 4-month-long rectangle chart pattern.
Based on this chart pattern, the potential price target is 100 levels.
TFIN, classified under the "financial services" sector, falls under the “Mid Cap - Income” stock category.
EnLink Midstream, LLC-(ENLC/NYSE)-Long Idea
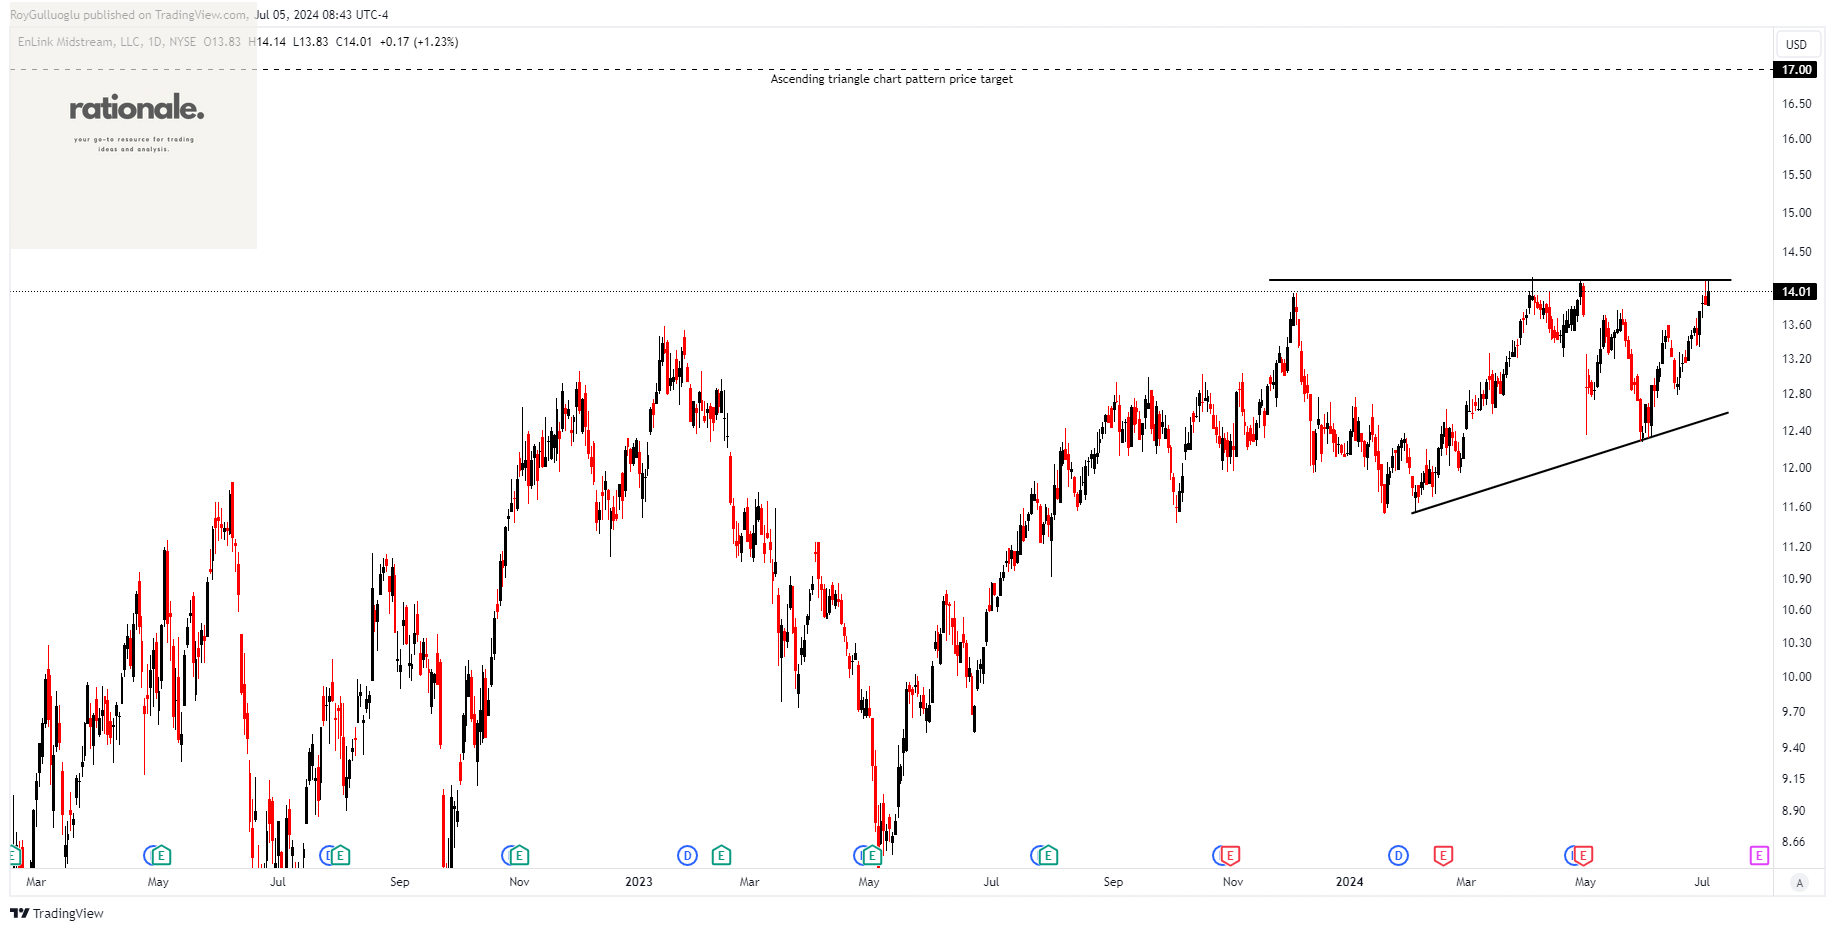
EnLink Midstream, LLC offers midstream energy services across the United States, operating through its Permian, Louisiana, Oklahoma, North Texas, and Corporate segments.
The above daily chart formed an approximately 5-month-long ascending triangle chart pattern as a bearish reversal after an uptrend.
The horizontal boundary at 14.14 levels acts as a support within this pattern.
A daily close below 14.56 levels would validate the breakdown from the 5-month-long ascending triangle chart pattern.
Based on this chart pattern, the potential price target is 17 levels.
ENLC, classified under the "energy" sector, falls under the “Small Cap - Income” stock category.
NAURA Technology Group Co., Ltd.-(002371/SZSE)-Long Idea
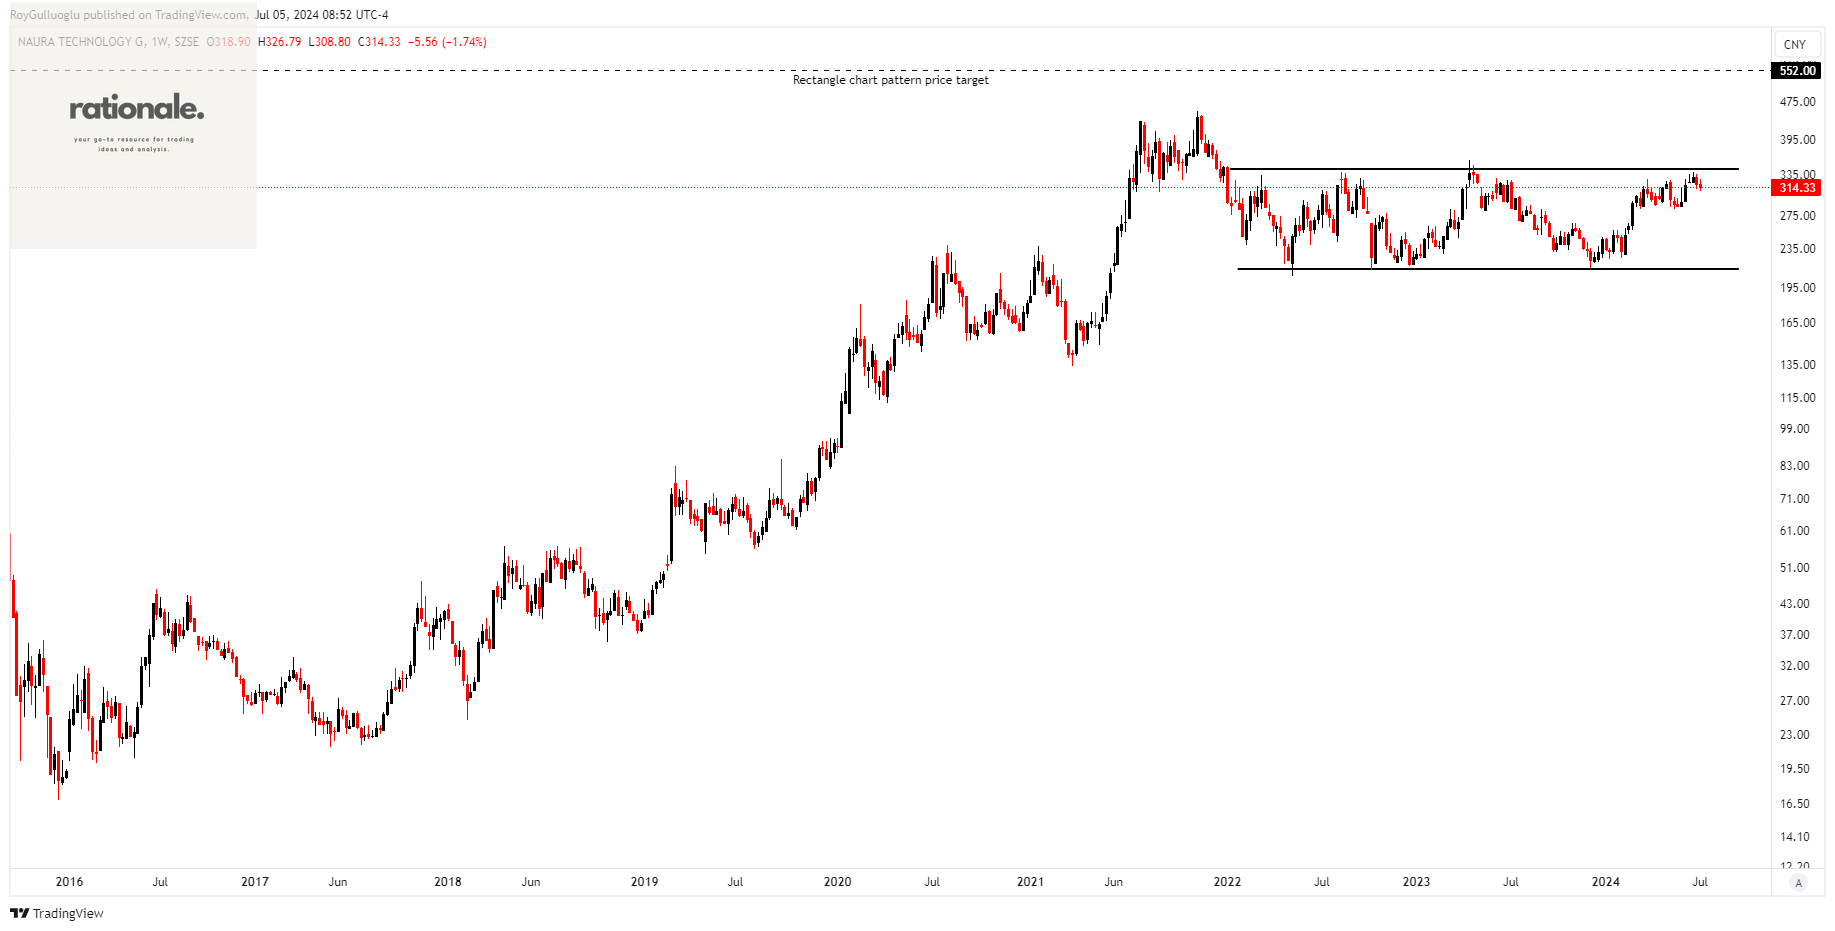
NAURA Technology Group Co., Ltd. is involved in the research and development, production, sales, and technical services of semiconductors in the People's Republic of China.
The above daily chart formed an approximately 3-month-long rectangle chart pattern as a bullish reversal after a downtrend.
The horizontal boundary at 343 levels acts as a resistance within this pattern.
A daily close above 353.33 levels would validate the breakout from the 3-month-long rectangle chart pattern.
Based on this chart pattern, the potential price target is 353.29 levels.
002371, classified under the "technology" sector, falls under the “Large Cap - Growth” stock category.
Mitsubishi HC Capital Inc.-(8593/TSE)-Long Idea
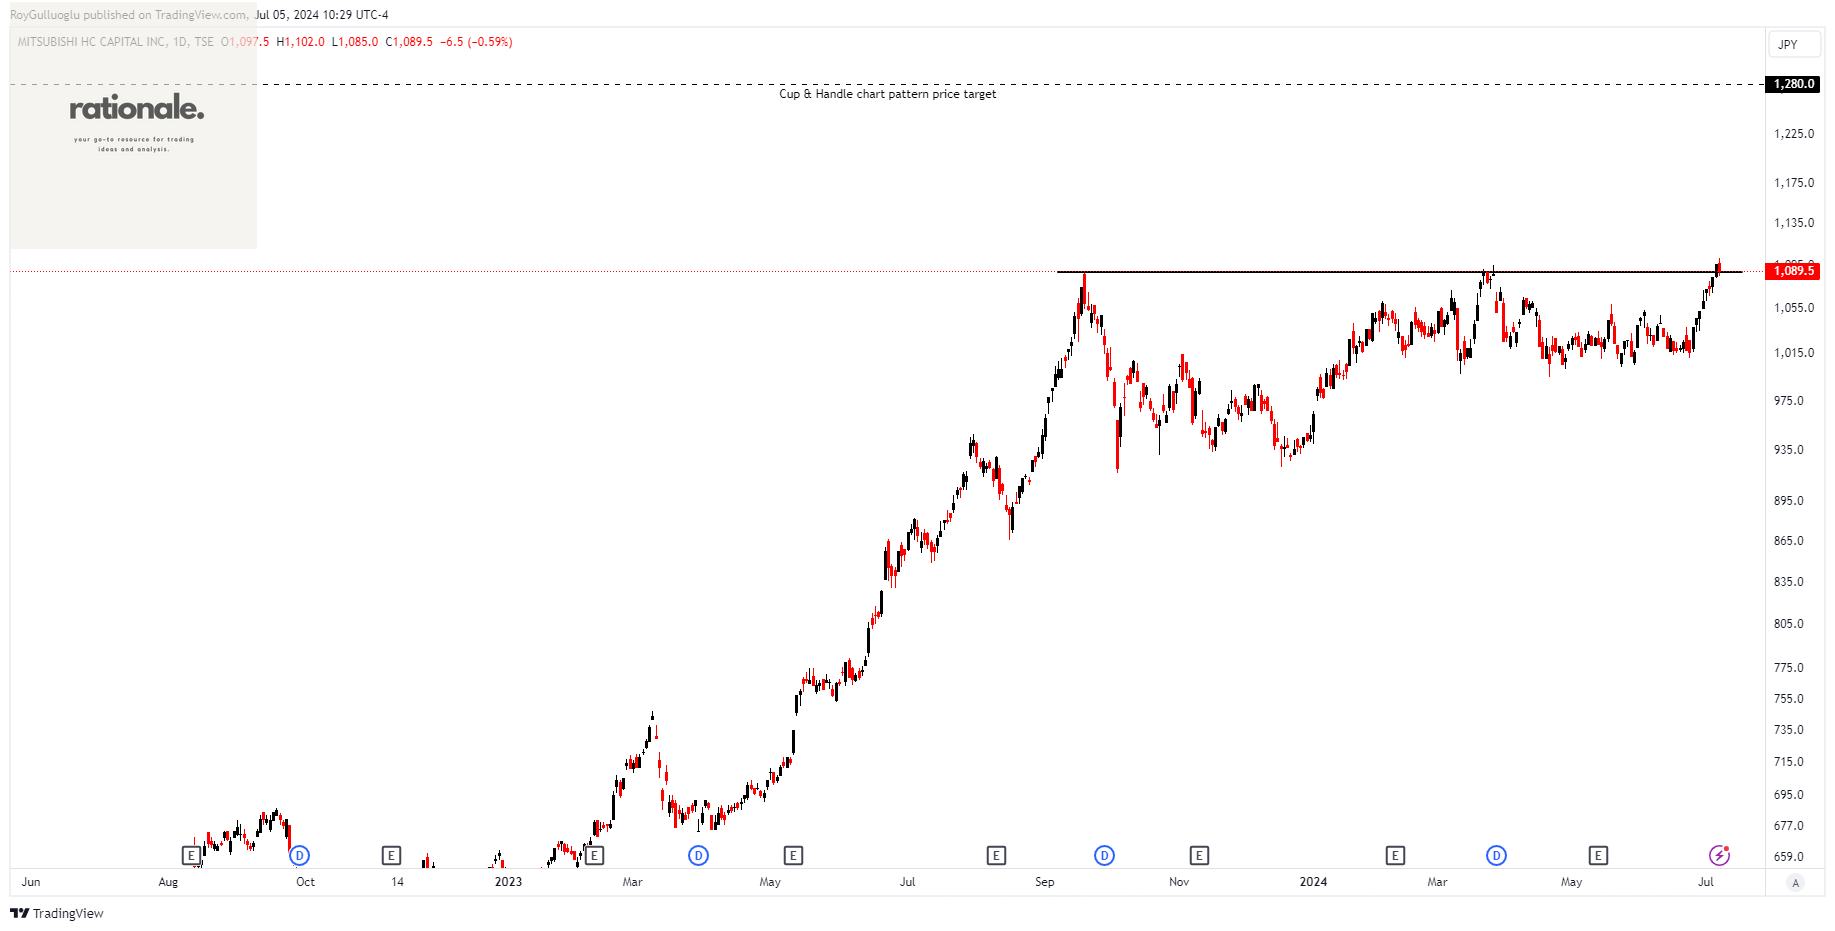
Mitsubishi HC Capital Inc., along with its subsidiaries, engages in leasing, installment sales, and other financing activities across Japan, Europe, the Americas, China, and the ASEAN region.
The above daily chart formed an approximately 6-month-long cup & handle chart pattern as a bullish continuation after an uptrend.
The horizontal boundary at 1089.5 levels acts as a resistance within this pattern.
A daily close above 1122 levels would validate the breakout from the 6-month-long cup & handle chart pattern.
Based on this chart pattern, the potential price target is 1280 levels.
8593, classified under the "financial services" sector, falls under the “Mid Cap - Income” stock category.
Tokyo Seimitsu Co., Ltd.-(7729/TSE)-Long Idea
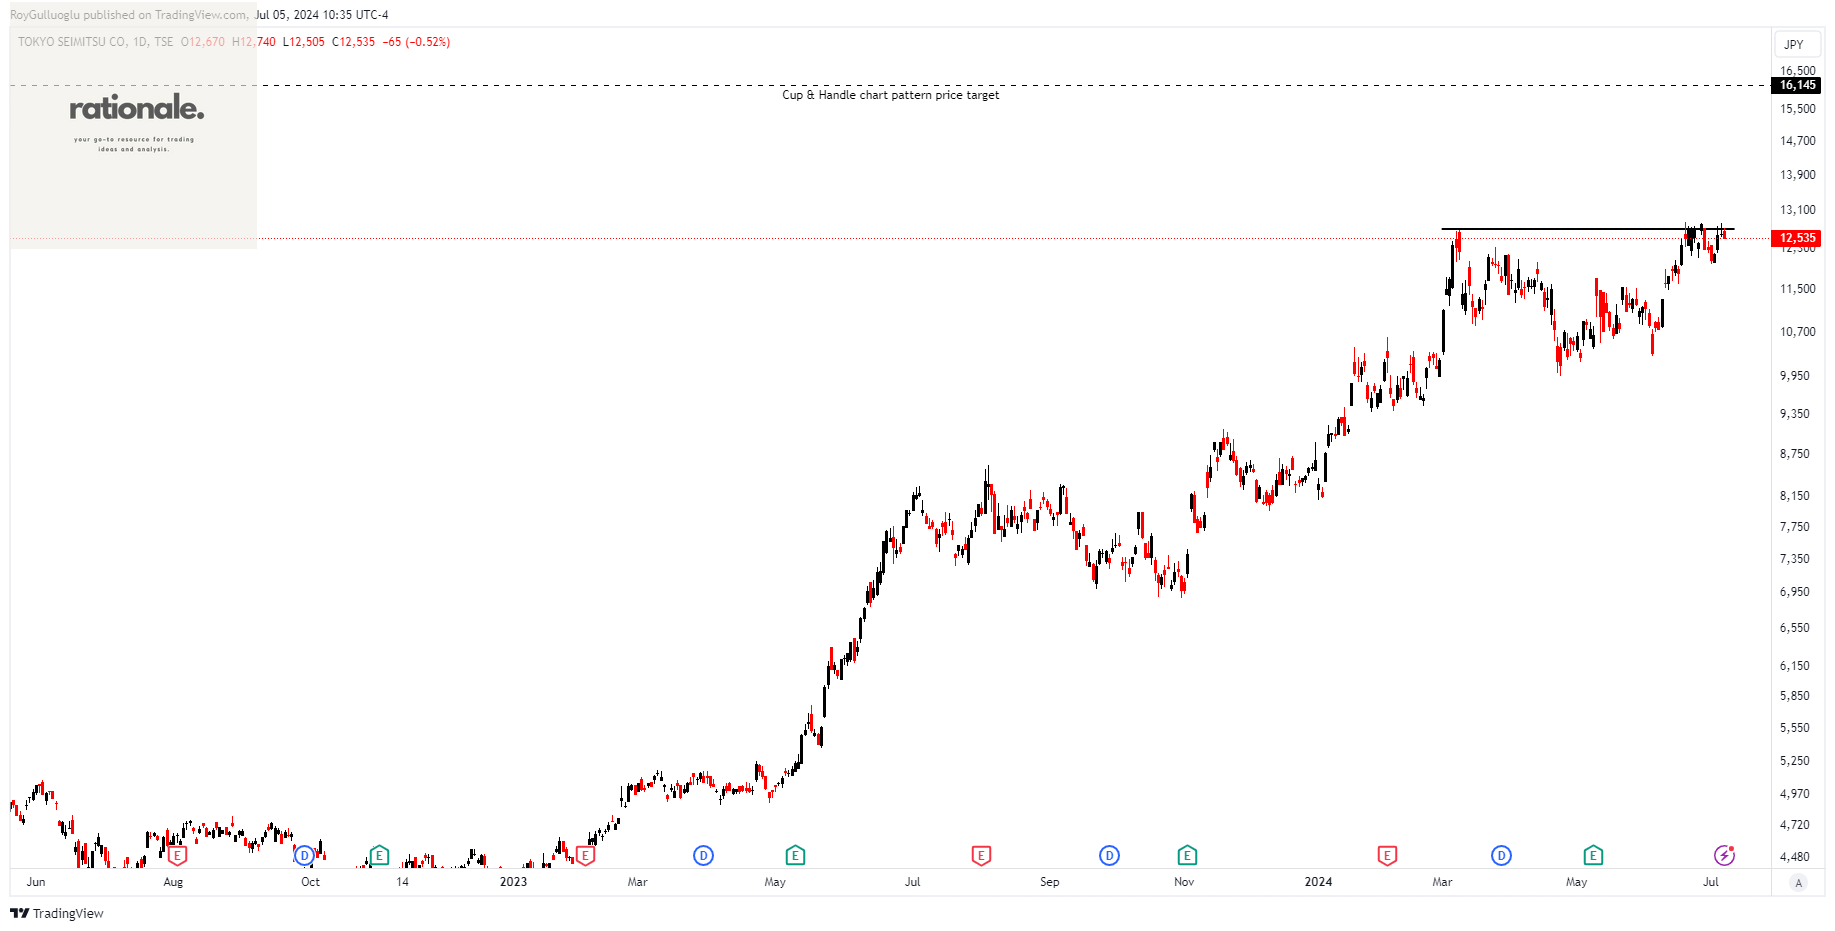
Tokyo Seimitsu Co., Ltd. manufactures and sells semiconductor production equipment (SPE) and measuring instruments in Japan.
The above daily chart formed an approximately 3-month-long cup & handle chart pattern as a bullish continuation after an uptrend.
The horizontal boundary at 12710 levels acts as a resistance within this pattern.
A daily close above 13000 levels would validate the breakout from the 3-month-long cup & handle chart pattern.
Based on this chart pattern, the potential price target is 16145 levels.
7729, classified under the "technology" sector, falls under the “Mid Cap - Growth” stock category.
Persimmon Plc-(PSN/LSE)-Long Idea
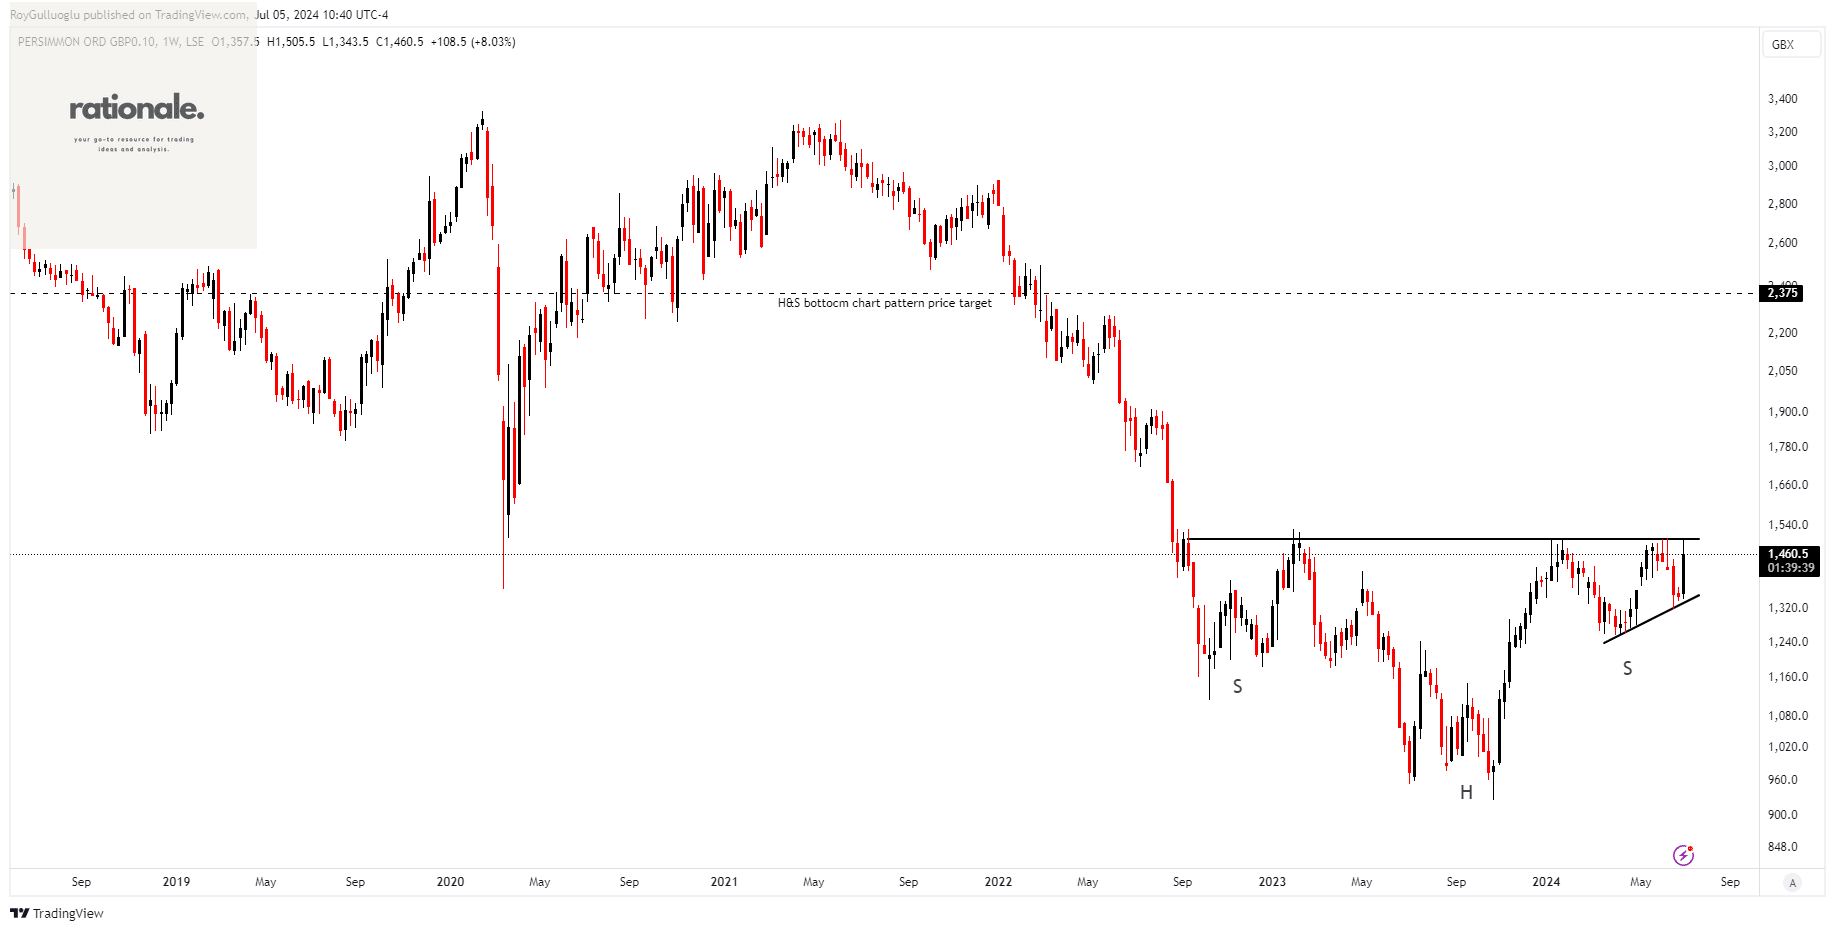
Persimmon Plc, along with its subsidiaries, operates as a house builder in the United Kingdom. The company offers family housing under the Persimmon Homes brand, housing under the Charles Church brand, and social housing under the Westbury Partnerships brand.
The above weekly chart formed an approximately 23-month-long H&S bottom chart pattern as a bullish reversal after a downtrend.
The horizontal boundary at 1503 levels acts as a resistance within this pattern.
A daily close above 1548 levels would validate the breakout from the 3-month-long H&S bottom chart pattern.
Based on this chart pattern, the potential price target is 2375 levels.
PSN, classified under the "consumer cyclical" sector, falls under the “Mid Cap - Growth” stock category.
Koza Anadolu Metal Madencilik Isletmeleri A.S.-(KOZAA/BIST)-Long Idea
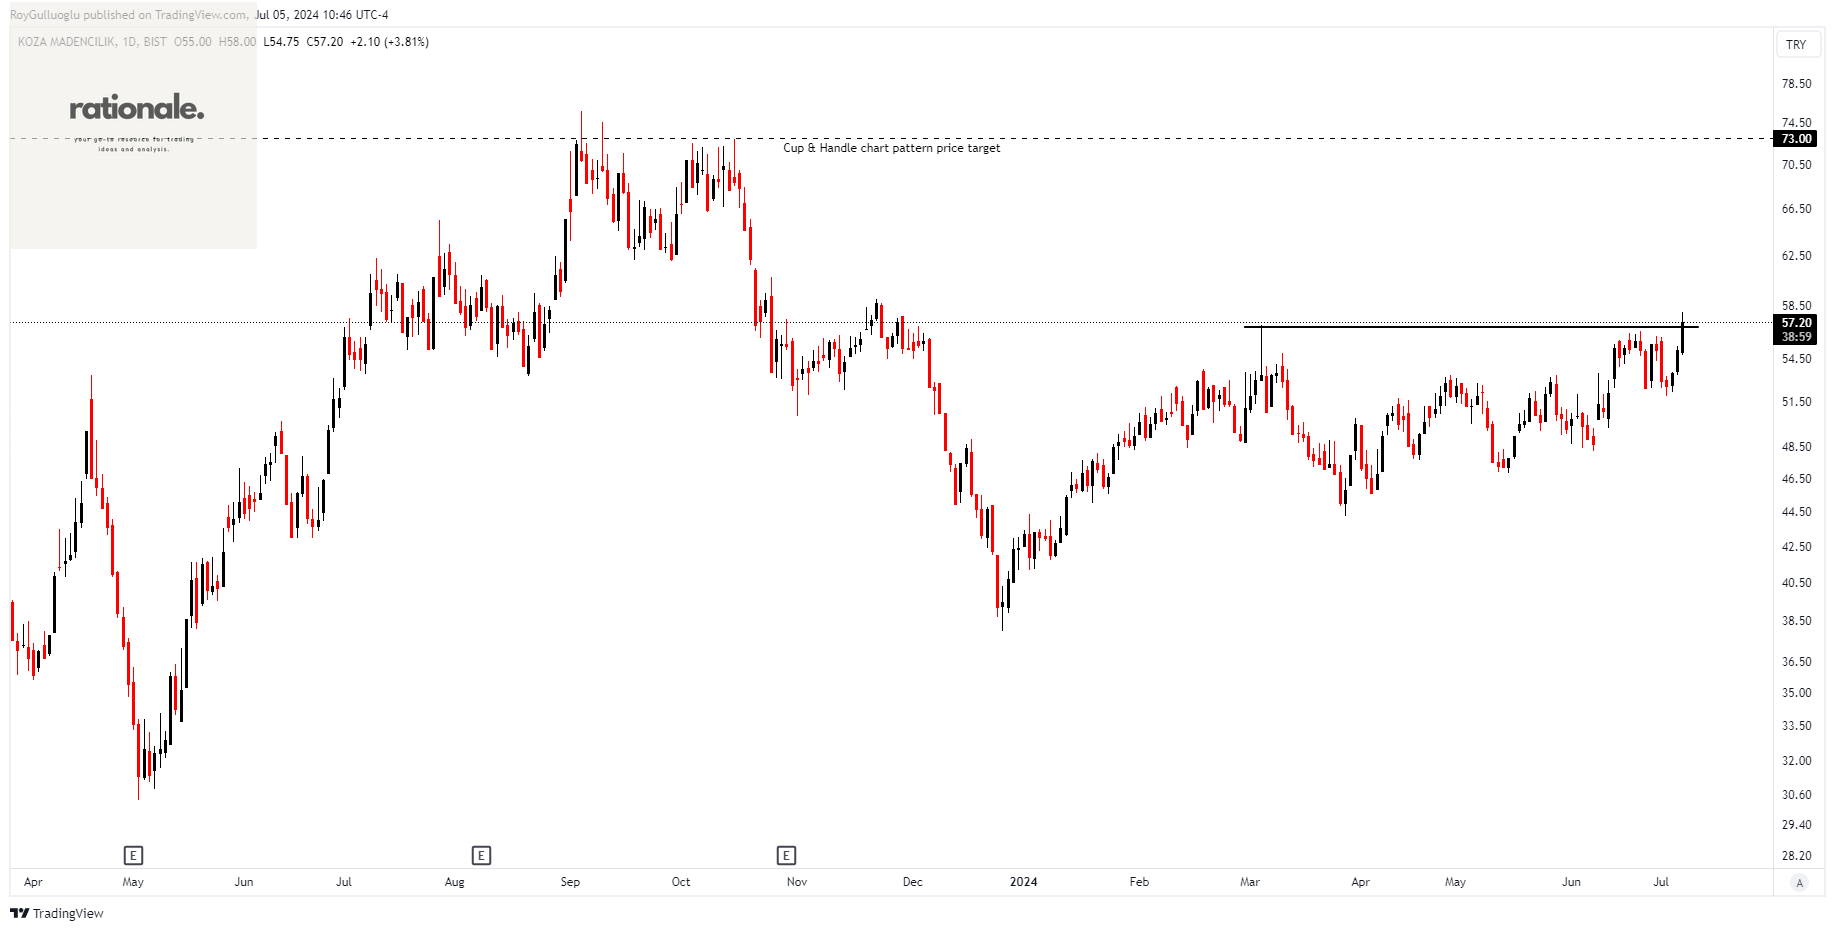
Koza Anadolu Metal Madencilik Isletmeleri A.S., along with its subsidiaries, engages in mining activities in Turkey.
The above daily chart formed an approximately 3-month-long cup & handle chart pattern as a bullish continuation after an uptrend.
The horizontal boundary at 56.85 levels acts as a resistance within this pattern.
A daily close above 58.55 levels would validate the breakout from the 3-month-long cup & handle chart pattern.
Based on this chart pattern, the potential price target is 73 levels.
KOZAA, classified under the "basic materials" sector, falls under the “Small Cap - Value” stock category.
Hello Roy. Just to learn, why did you delete KSS, ENLC (knocking doors now), LH and DKS (handle invalidated, correct?), from your watchlist? Thanks. Ricky.