


Compass Minerals International, Inc.-(CMP/NYSE)-Long Idea
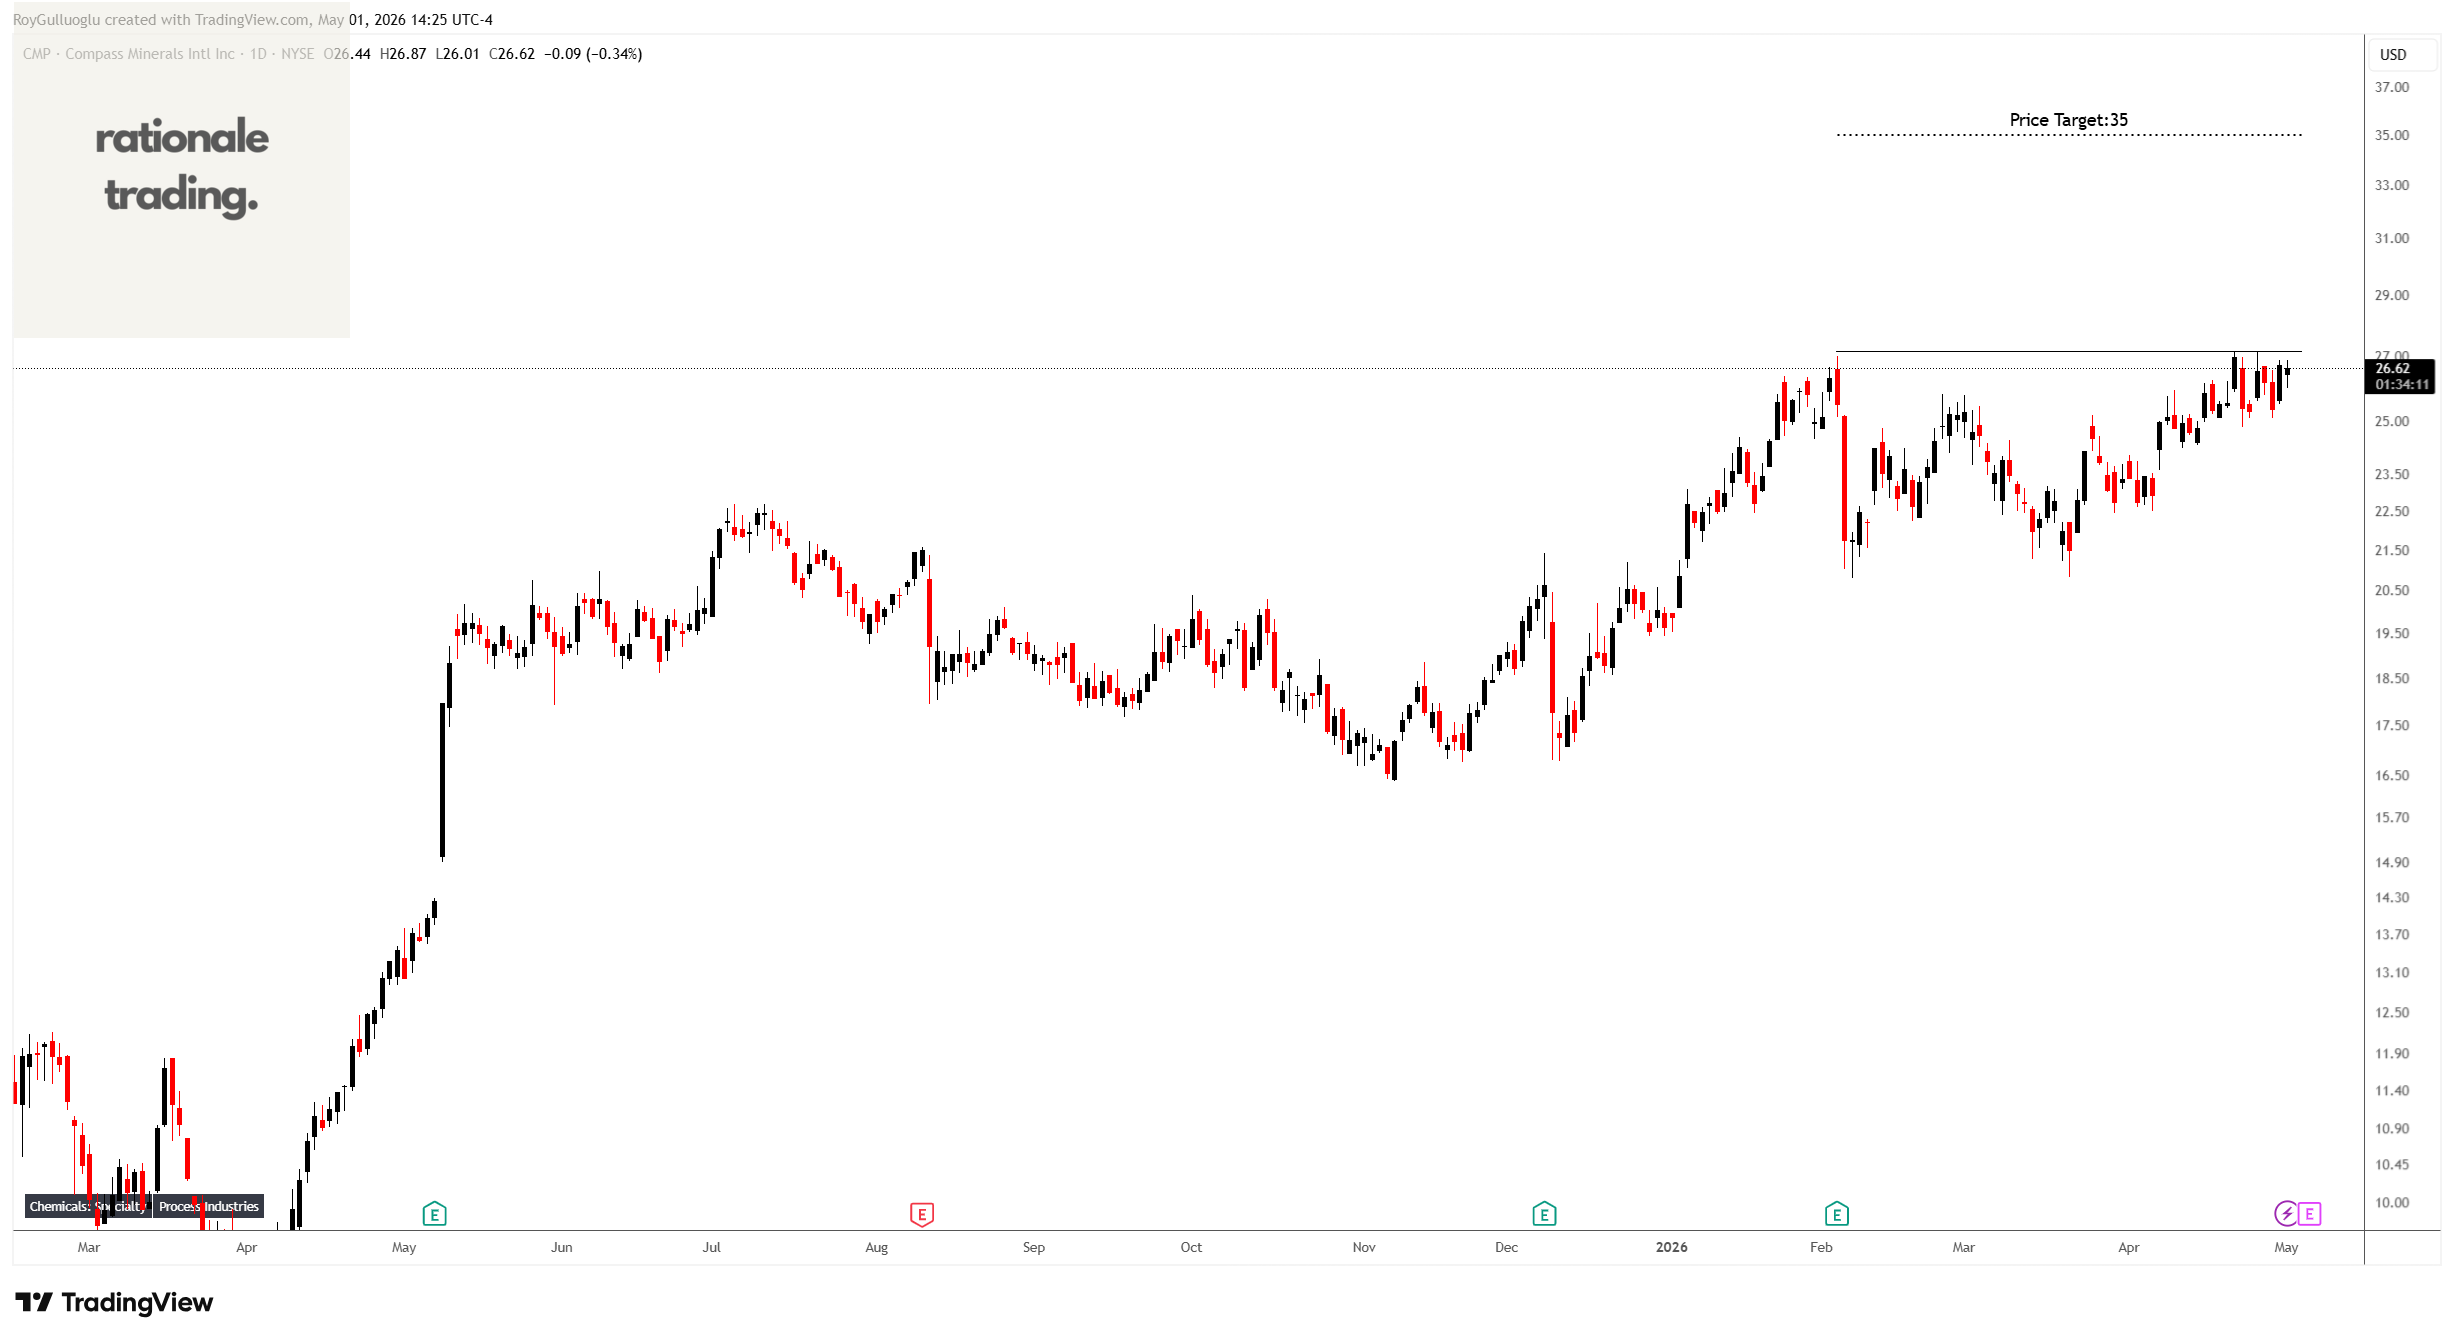
Compass Minerals International, Inc. provides essential minerals in the United States, Canada, the United Kingdom, and internationally.
The above weekly chart formed an approximately 2-month-long cup & handle chart pattern as a bullish continuation after an uptrend.
The horizontal boundary at 27.15 levels acts as a resistance within this pattern.
A daily close above 27.96 levels validated the breakout from the 2-month-long cup & handle chart pattern.
Based on this chart pattern, the potential price target is 35 levels.
TAL Education Group-(TAL/NYSE)-Long Idea
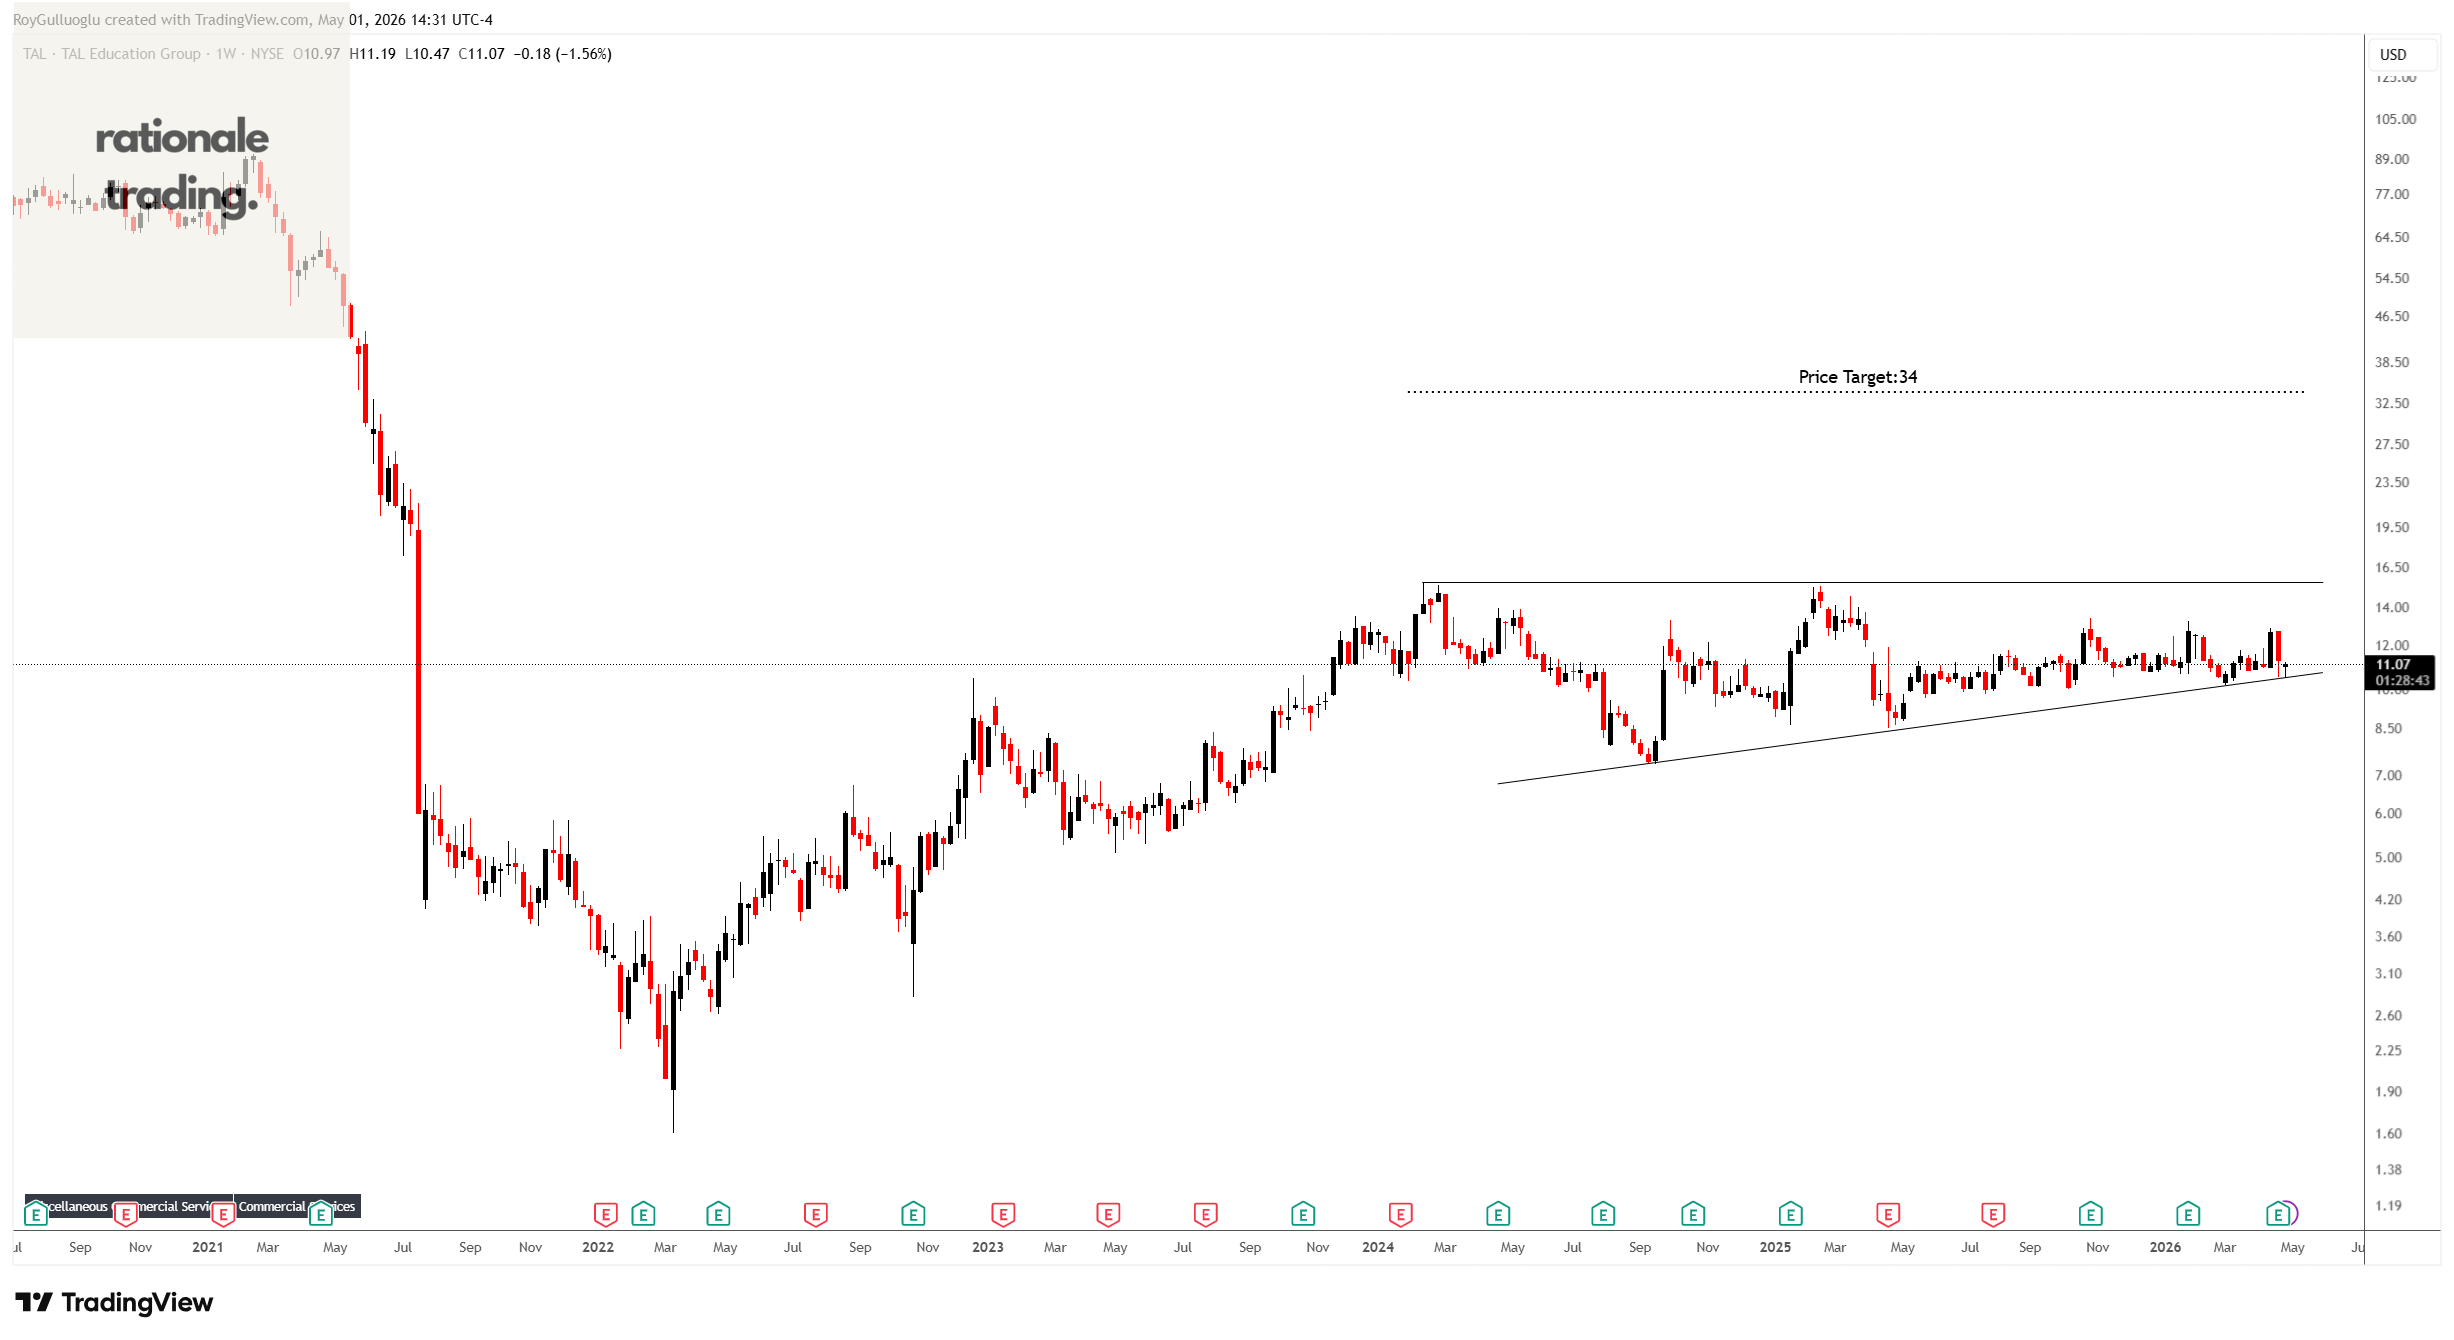
TAL Education Group provides K-12 after-school tutoring services in the People’s Republic of China.
The above weekly chart formed an approximately 28-month-long ascending triangle chart pattern as a bullish continuation after an uptrend.
The horizontal boundary at 15.52 levels acts as a resistance within this pattern.
A daily close above 16 levels would validate the breakout from the 28-month-long ascending triangle chart pattern.
Based on this chart pattern, the potential price target is 34 levels.
Fortinet, Inc. -(FTNT/NASDAQ)-Long Idea
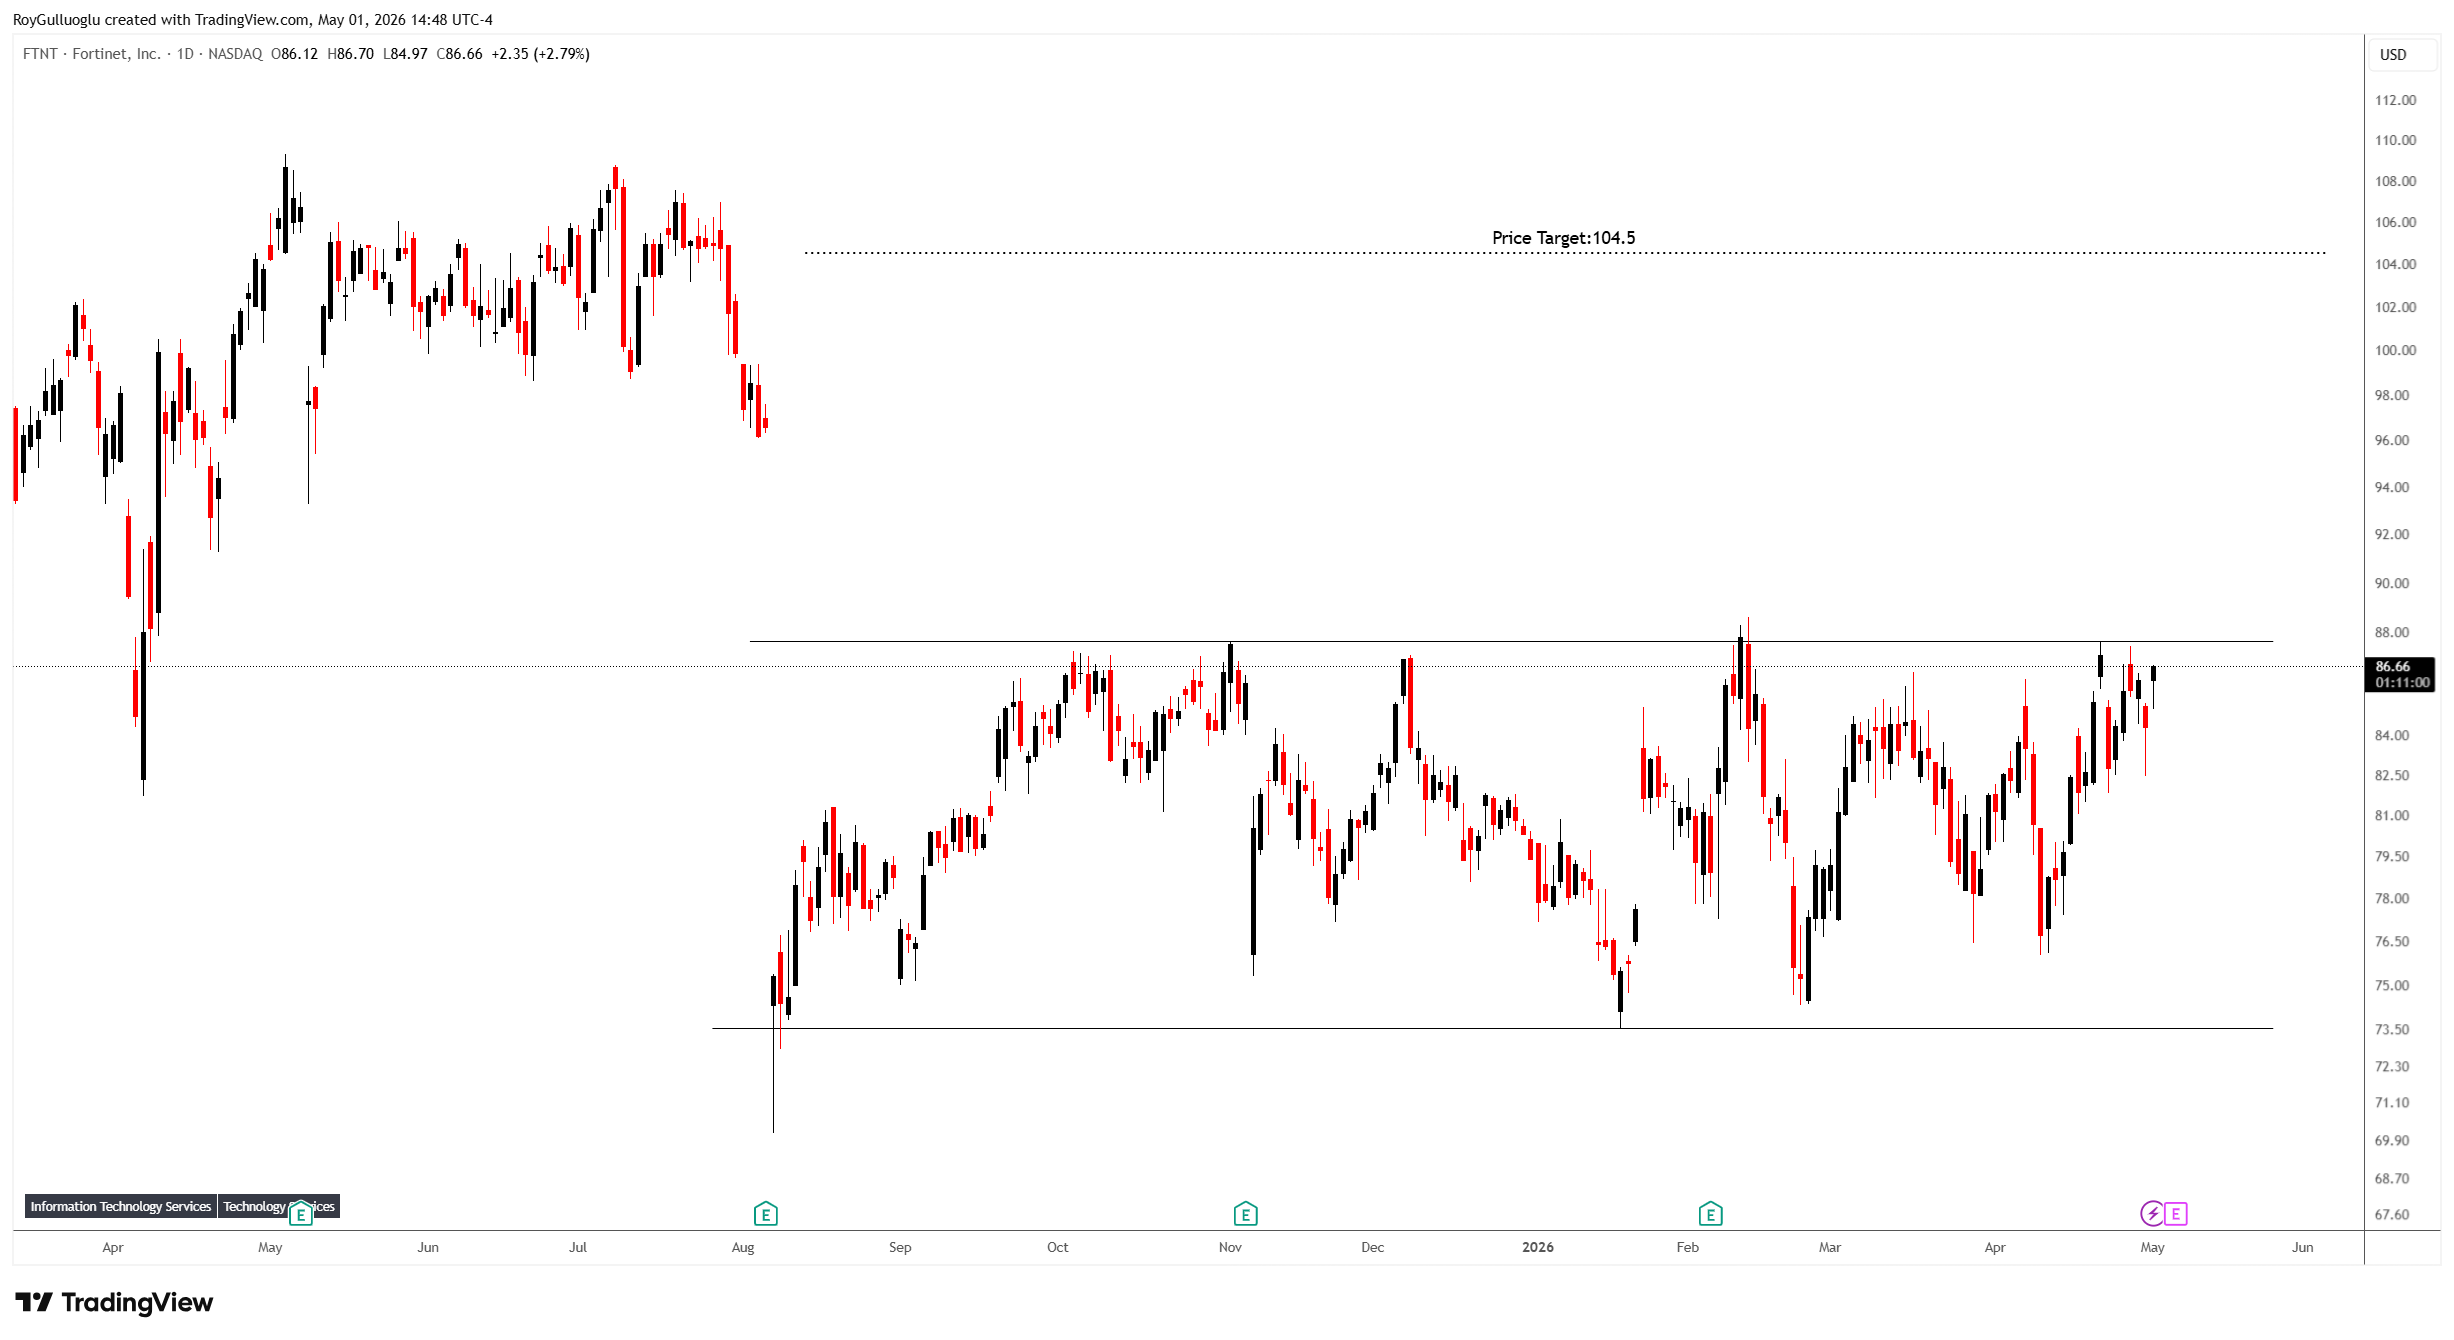
Fortinet, Inc. provides cybersecurity and convergence of networking and security solutions worldwide.
The above daily chart formed an approximately 6-month-long rectangle chart pattern as a bullish reversal after a downtrend.
The horizontal boundary at 87.64 levels acts as a resistance within this pattern.
A daily close above 90.26 levels would validate the breakout from the 6-month-long rectangle chart pattern.
Based on this chart pattern, the potential price target is 104.5 levels.
ConnectOne Bancorp, Inc.-(CNOB/NASDAQ)-Long Idea
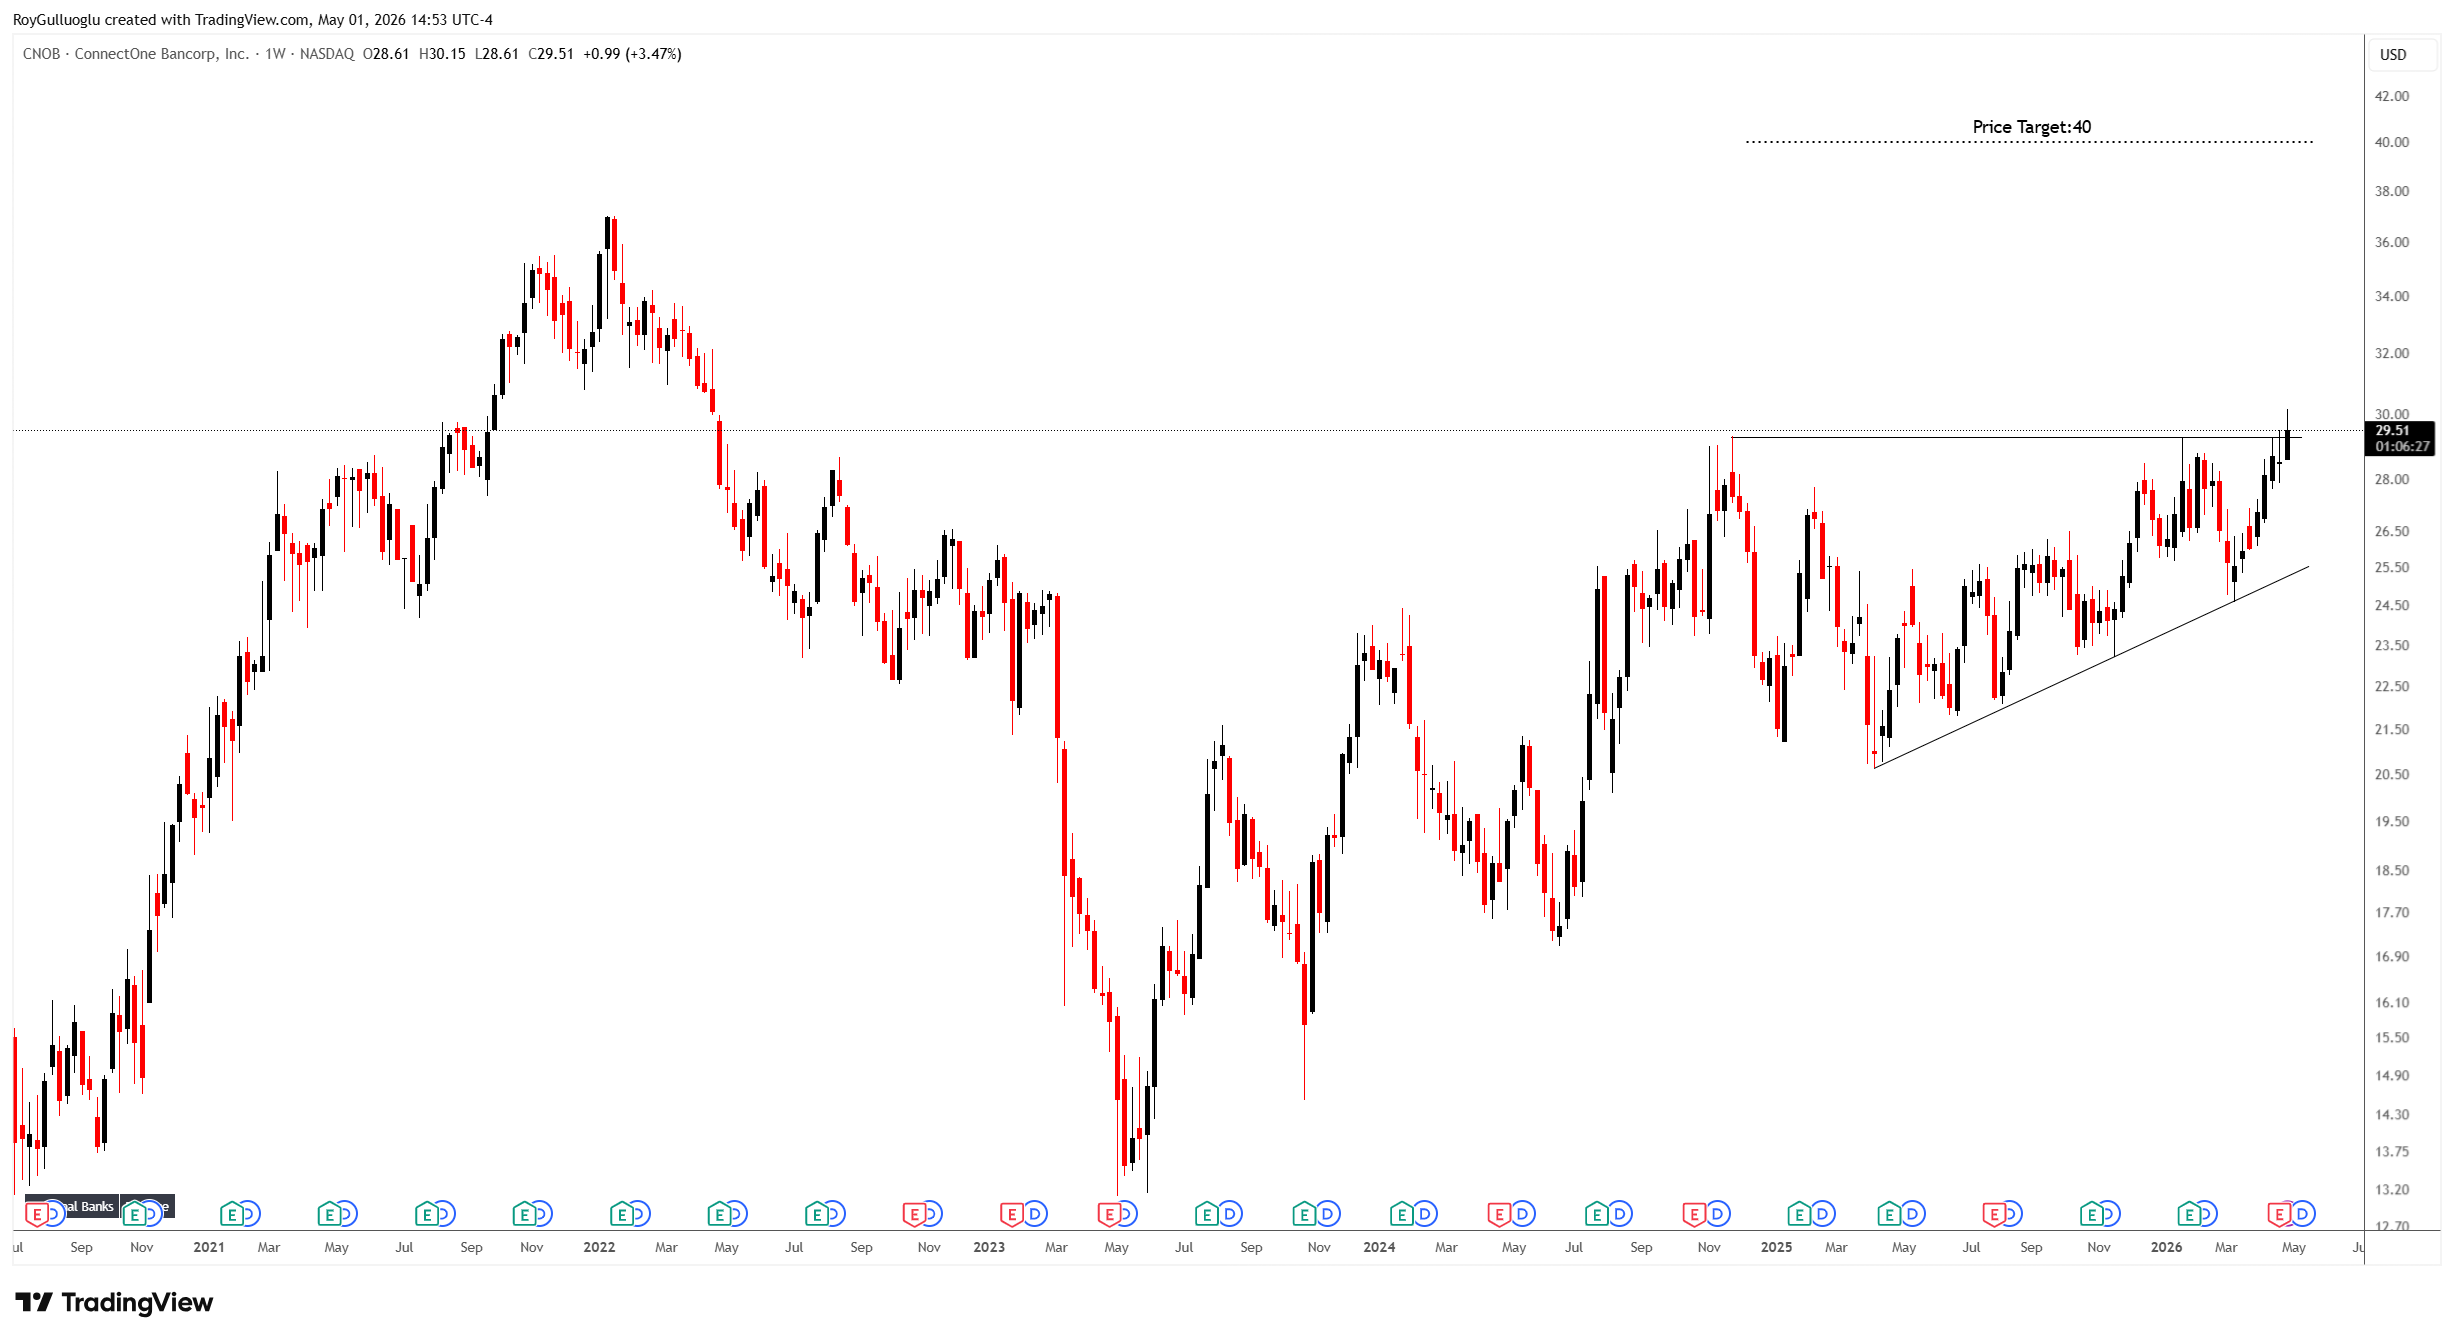
ConnectOne Bancorp, Inc. operates as the bank holding company for ConnectOne Bank that provides commercial banking products and services for small and mid-sized businesses, local professionals, and individuals in the United States.
The above weekly chart formed an approximately 18-month-long ascending triangle chart pattern as a bullish continuation after an uptrend.
The horizontal boundary at 29.28 levels acts as a resistance within this pattern.
A daily close above 30.16 levels would validate the breakout from the 18-month-long ascending triangle chart pattern.
Based on this chart pattern, the potential price target is 40 levels.
Morgan Stanley-(MS/NYSE)-Long Idea
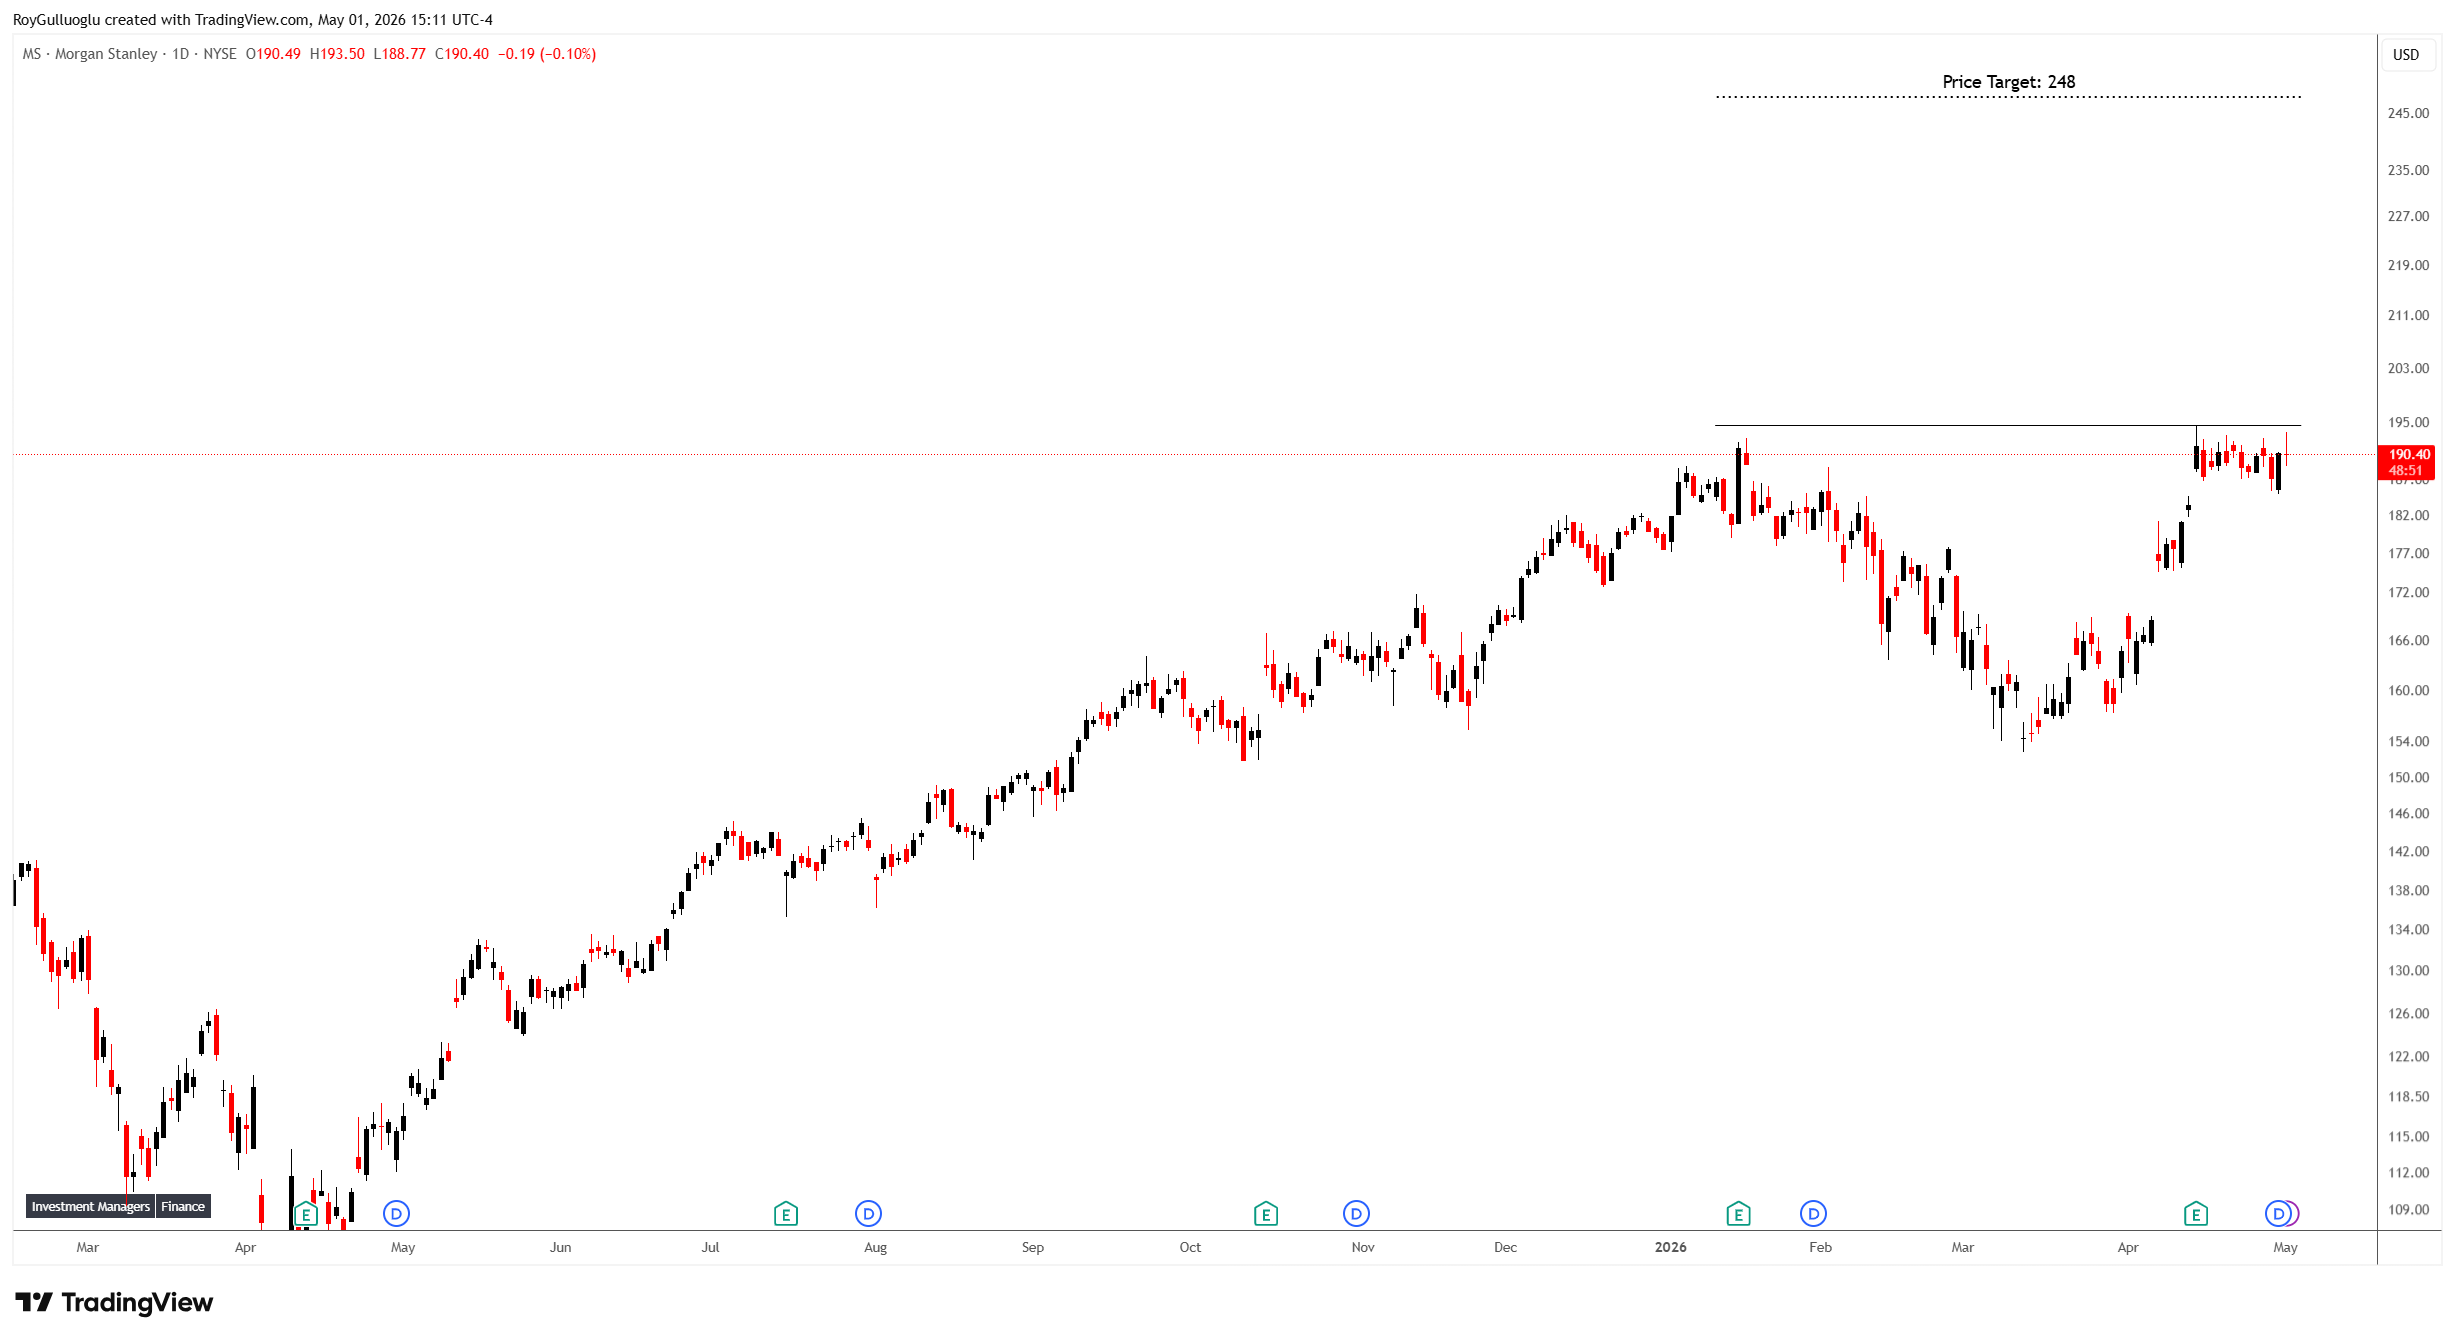
Morgan Stanley, a financial holding company, provides various financial products and services to corporations, governments, financial institutions, and individuals in the Americas, Asia, Europe, the Middle East, and Africa.
The above daily chart formed an approximately 3-month-long cup & handle chart pattern as a bullish continuation after an uptrend.
The horizontal boundary at 194.59 levels acts as a resistance within this pattern.
A daily close above 200.4 levels would validate the breakout from the 3-month-long cup & handle chart pattern.
Based on this chart pattern, the potential price target is 248 levels.