


Public Service Enterprise Group Incorporated-(PEG/NYSE)-Short Idea
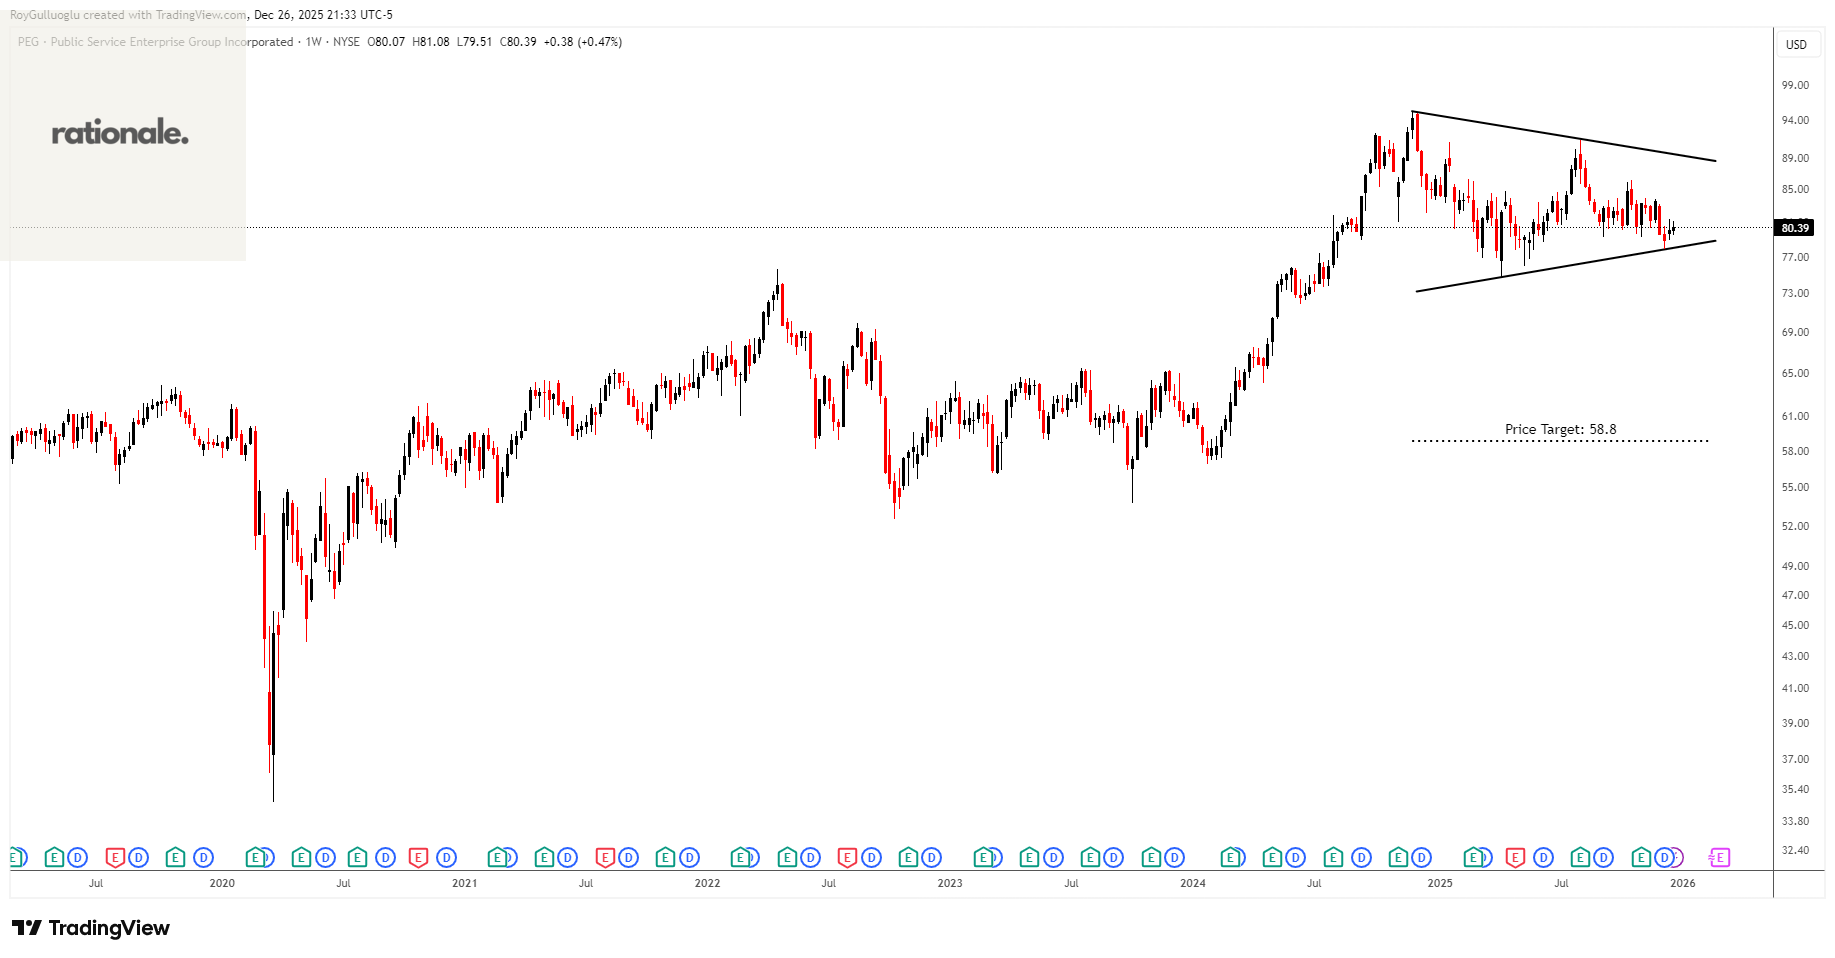
Public Service Enterprise Group Incorporated, through its subsidiaries, operates in electric and gas utility, and nuclear generation businesses in the United States.
The above weekly chart formed an approximately 15-month-long symmetrical triangle chart pattern as a bullish reversal after an uptrend.
A daily close below 75.6 levels would validate the breakdown from the 15-month-long symmetrical triangle chart pattern.
Based on this chart pattern, the potential price target is 58.8 levels.
Futu Holdings Limited-(FUTU/NASDAQ)-Short Idea
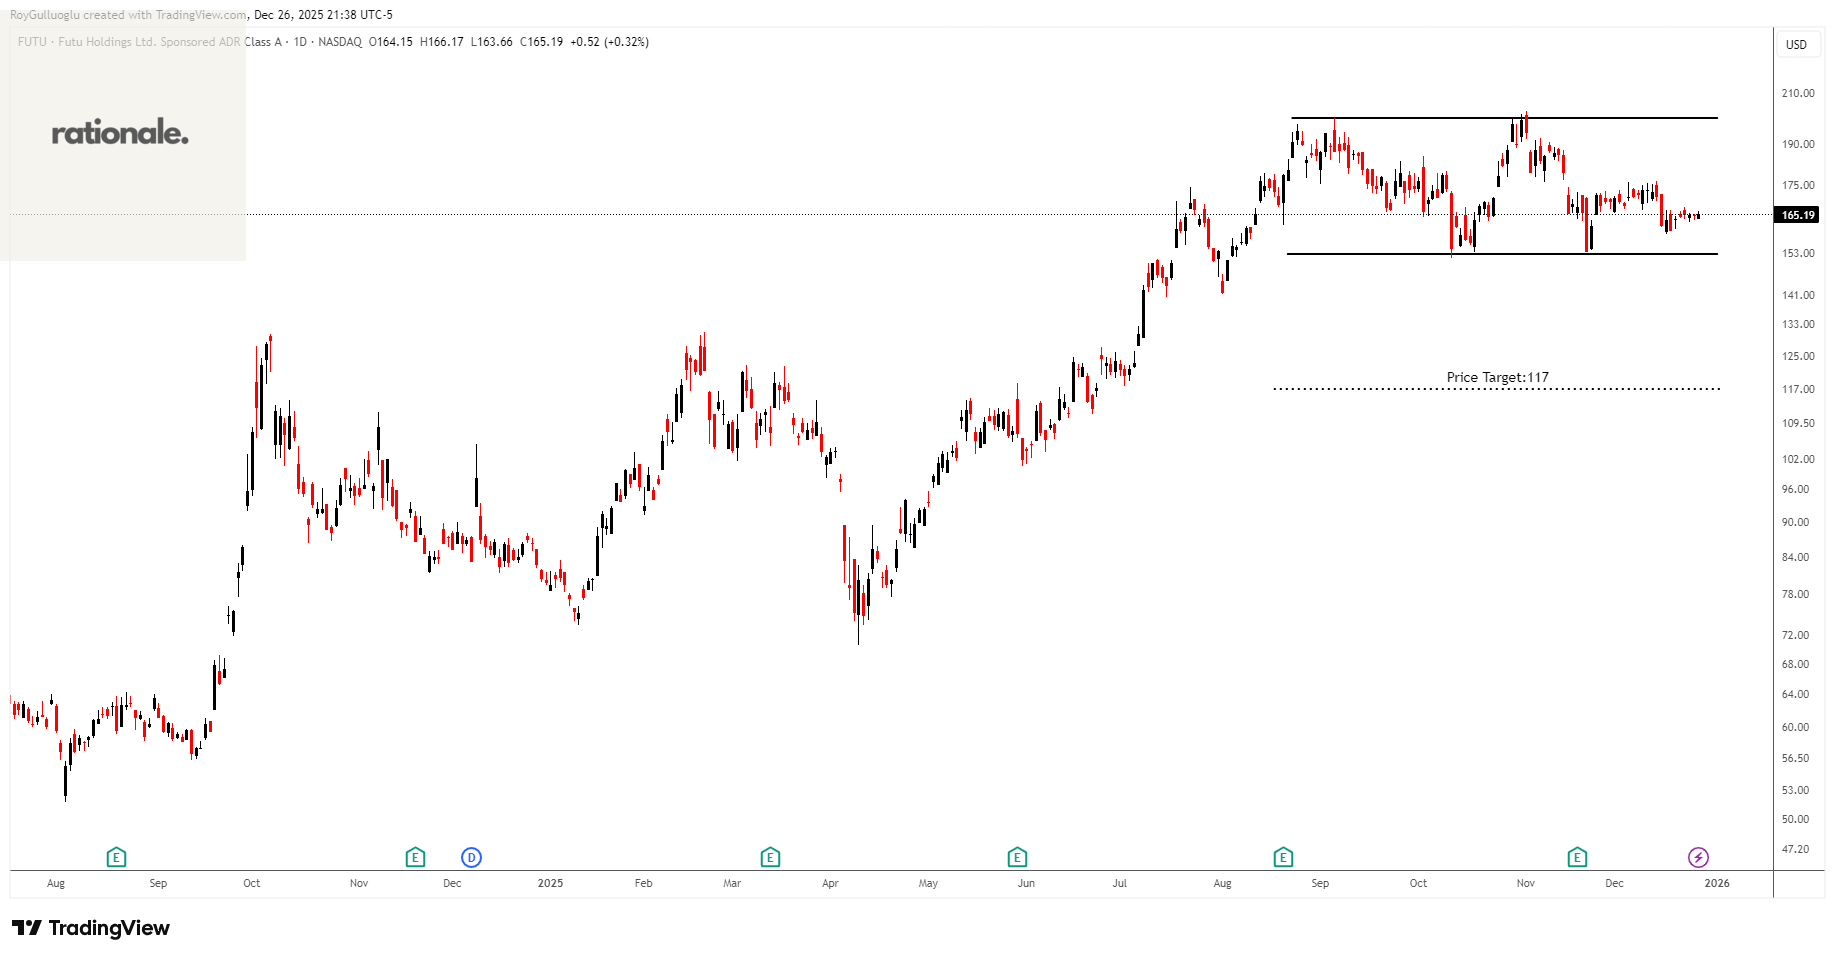
Futu Holdings Limited provides digitalized securities brokerage and wealth management product distribution service in Hong Kong and internationally.
The above daily chart formed an approximately 3-month-long rectangle chart pattern as a bearish reversal after an uptrend.
The horizontal boundary at 152.78 levels acts as a support within this pattern.
A daily close below 148.2 levels would validate the breakdown from the 3-month-long rectangle chart pattern.
Based on this chart pattern, the potential price target is 117 levels.
Becton, Dickinson and Company-(BDX/NYSE)-Long Idea
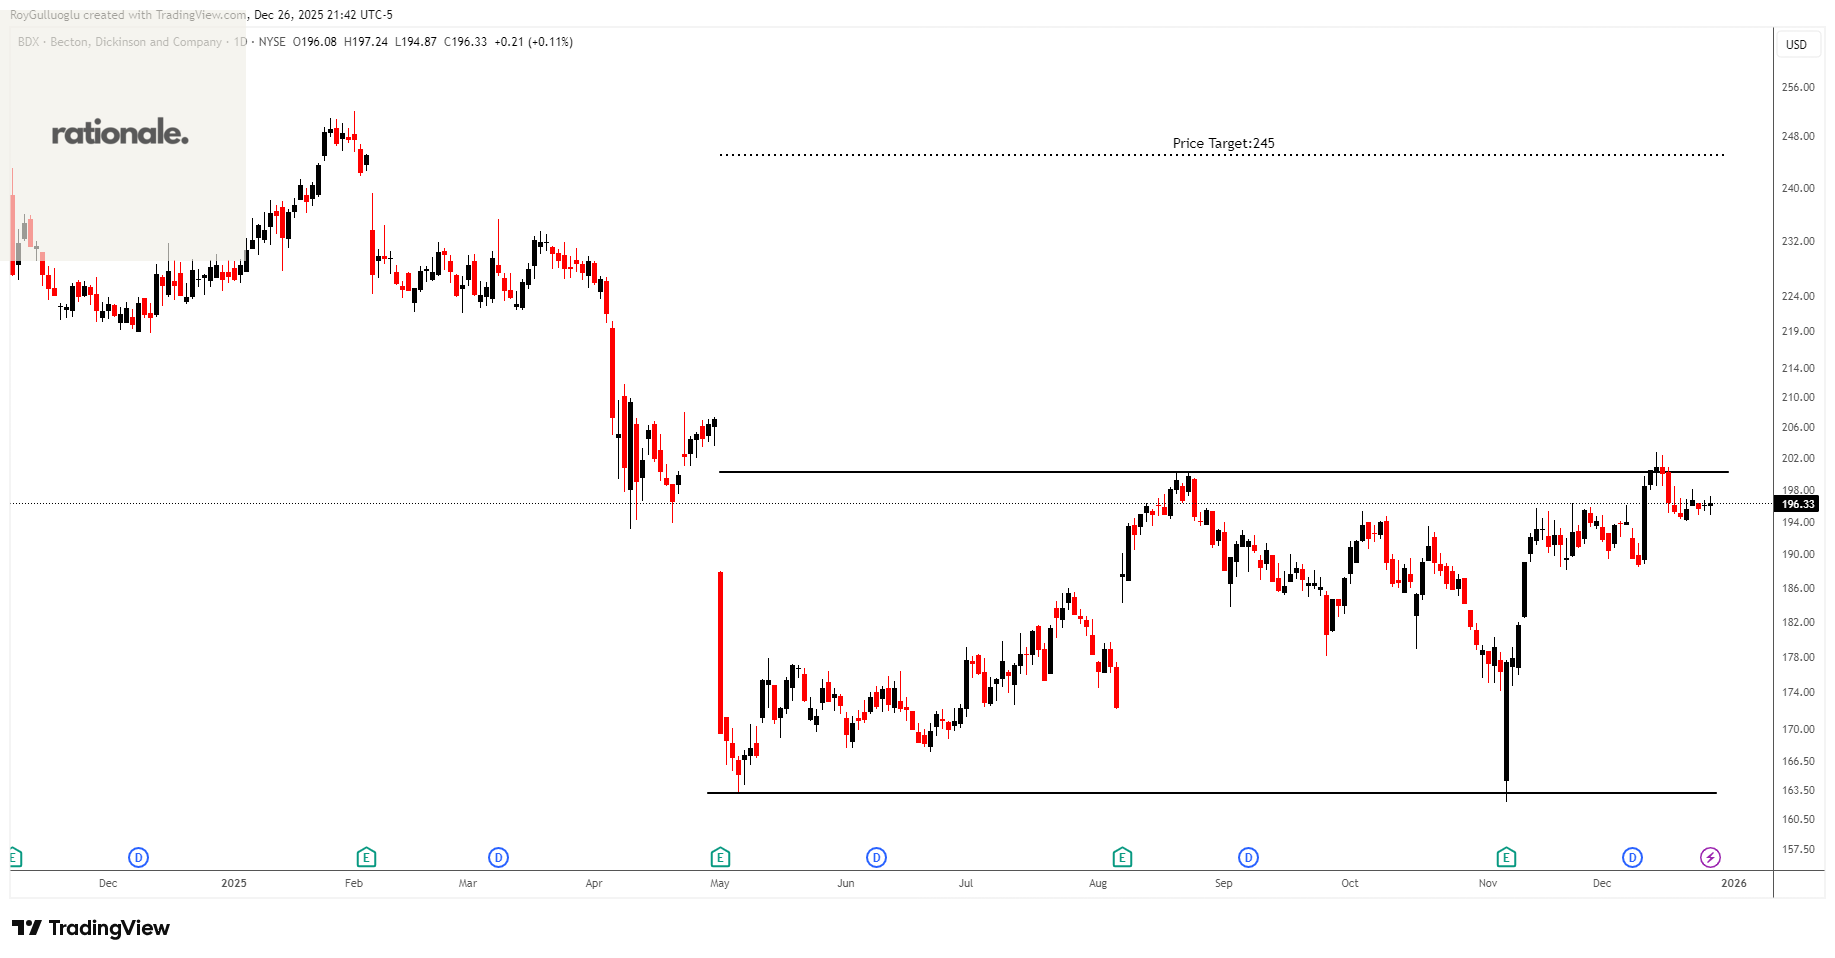
Becton, Dickinson and Company develops, manufactures, and sells medical supplies, devices, laboratory equipment, and diagnostic products for healthcare institutions, physicians, life science researchers, clinical laboratories, pharmaceutical industry, and the general public worldwide.
The above daily chart formed an approximately 5-month-long rectangle chart pattern as a bullish reversal after a downtrend.
The horizontal boundary at 200 levels acts as a resistance within this pattern.
A daily close above 206 levels would validate the breakout from the 5-month-long rectangle chart pattern.
Based on this chart pattern, the potential price target is 245 levels.
AtriCure, Inc.-(ATRC/NASDAQ)-Long Idea
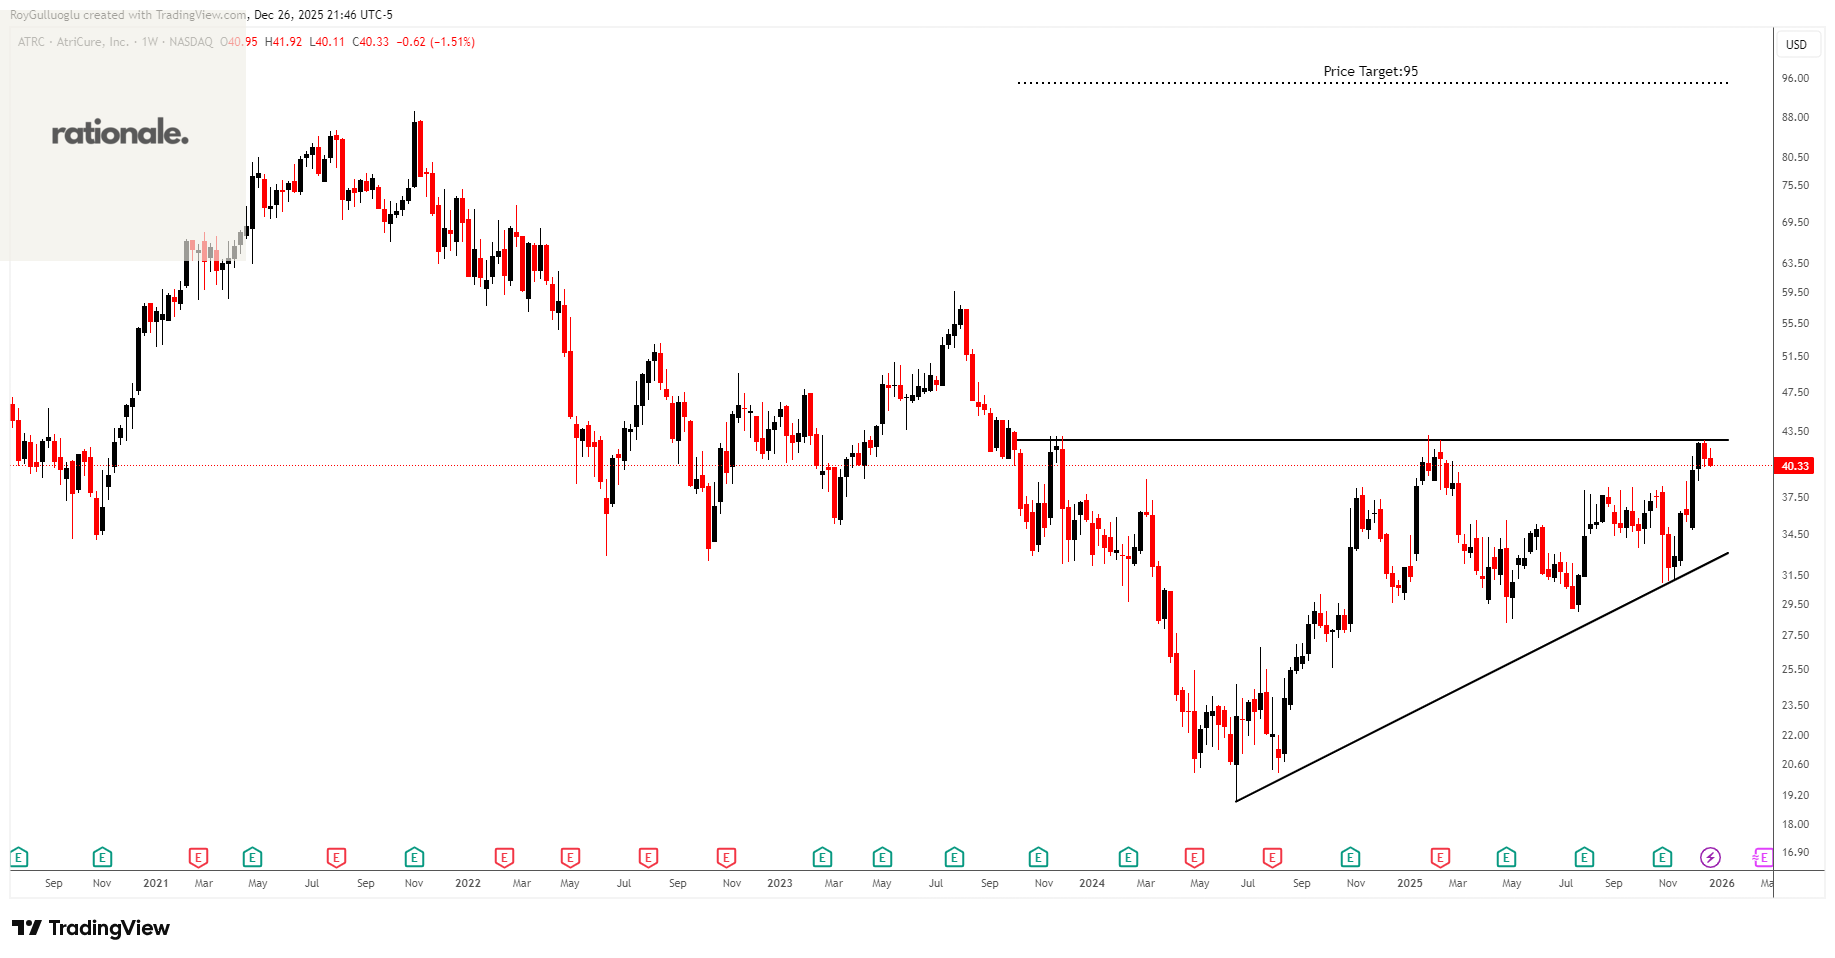
AtriCure, Inc. develops, manufactures, and sells devices for surgical ablation of cardiac tissue, exclusion of the left atrial appendage, and temporarily blocking pain by ablating peripheral nerves to medical centers in the United States, the Asia-Pacific, and internationally.
The above weekly chart formed an approximately 27-month-long ascending triangle chart pattern as a bullish reversal after a downtrend.
The horizontal boundary at 42.6 levels acts as a resistance within this pattern.
A daily close above 43.85 levels would validate the breakout from the 27-month-long ascending triangle chart pattern.
Based on this chart pattern, the potential price target is 95 levels.