

Trade Ideas Equities
MKTX(NASDAQ), RSI(NYSE), BWXT(NYSE), TMDX(NASDAQ), POU(TSX), NKT(OMXCOP), RGYAS(BIST)

MarketAxess Holdings Inc.-(MKTX/NASDAQ)-Long Idea
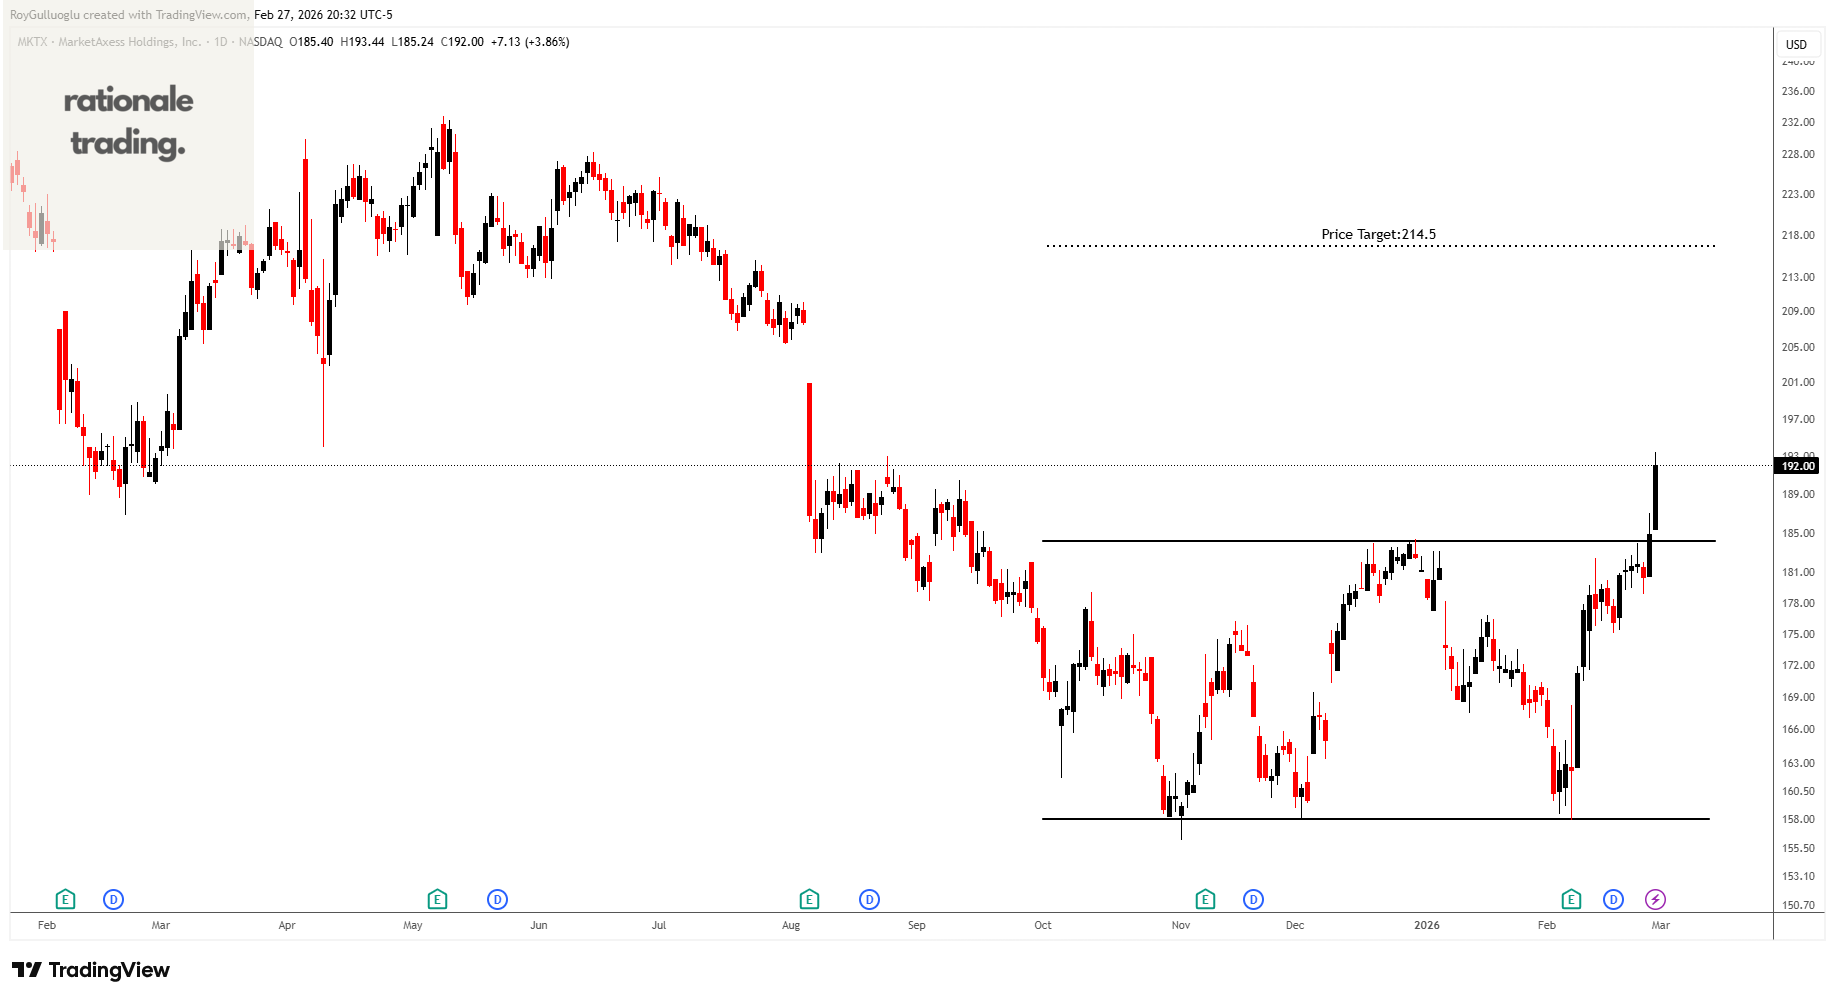
MarketAxess Holdings Inc., together with its subsidiaries, operates an electronic trading platform for institutional investor and broker-dealer firms in the United States, the United Kingdom, and internationally.
The above daily chart formed an approximately 3-month-long rectangle chart pattern as a bullish reversal after a downtrend.
The horizontal boundary at 184.16 levels acted as a resistance within this pattern.
A daily close above 189.7 levels validated the breakout from the 3-month-long rectangle chart pattern.
Based on this chart pattern, the potential price target is 214.5 levels.
Rush Street Interactive, Inc.-(RSI/NYSE)-Long Idea
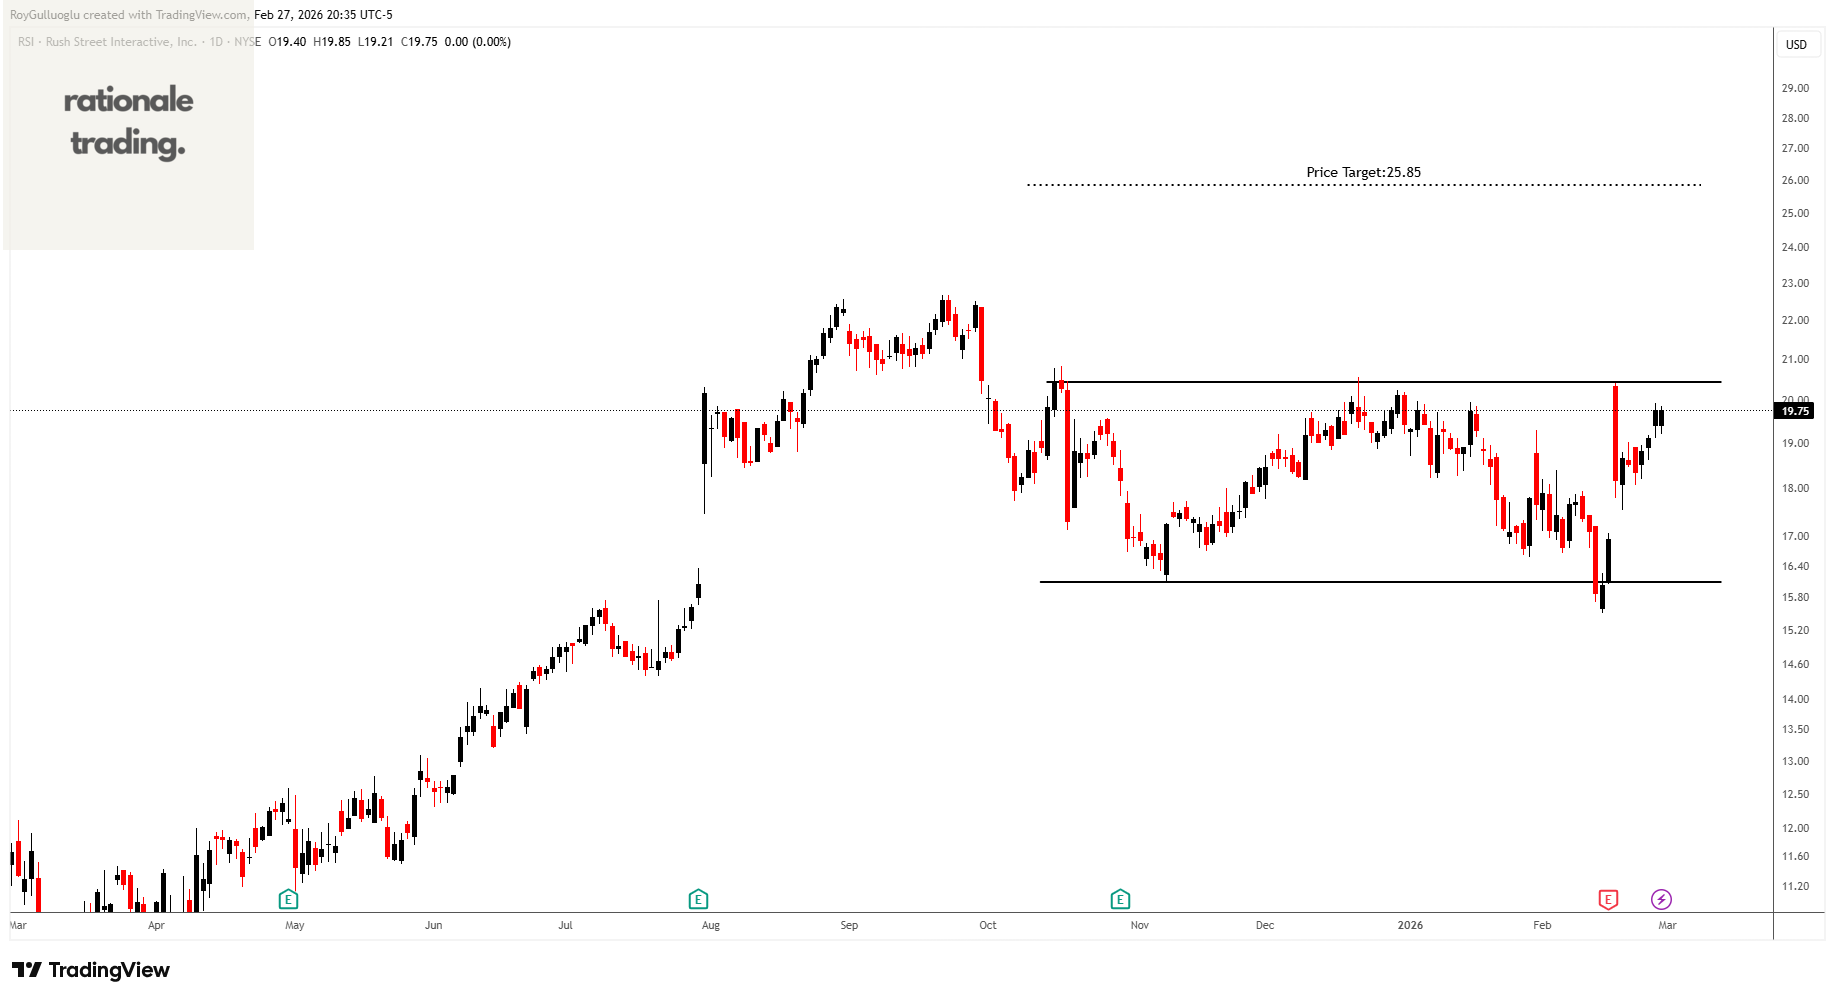
Rush Street Interactive, Inc. operates as an online casino and sports betting company in the United States, Canada, and Latin America.
The above daily chart formed an approximately 3-month-long rectangle chart pattern as a bullish continuation after an uptrend.
The horizontal boundary at 20.42 levels acts as a resistance within this pattern.
A daily close above 21 levels would validate the breakout from the 3-month-long rectangle chart pattern.
Based on this chart pattern, the potential price target is 25.85 levels.
BWX Technologies, Inc.-(BWXT/NYSE)-Long Idea
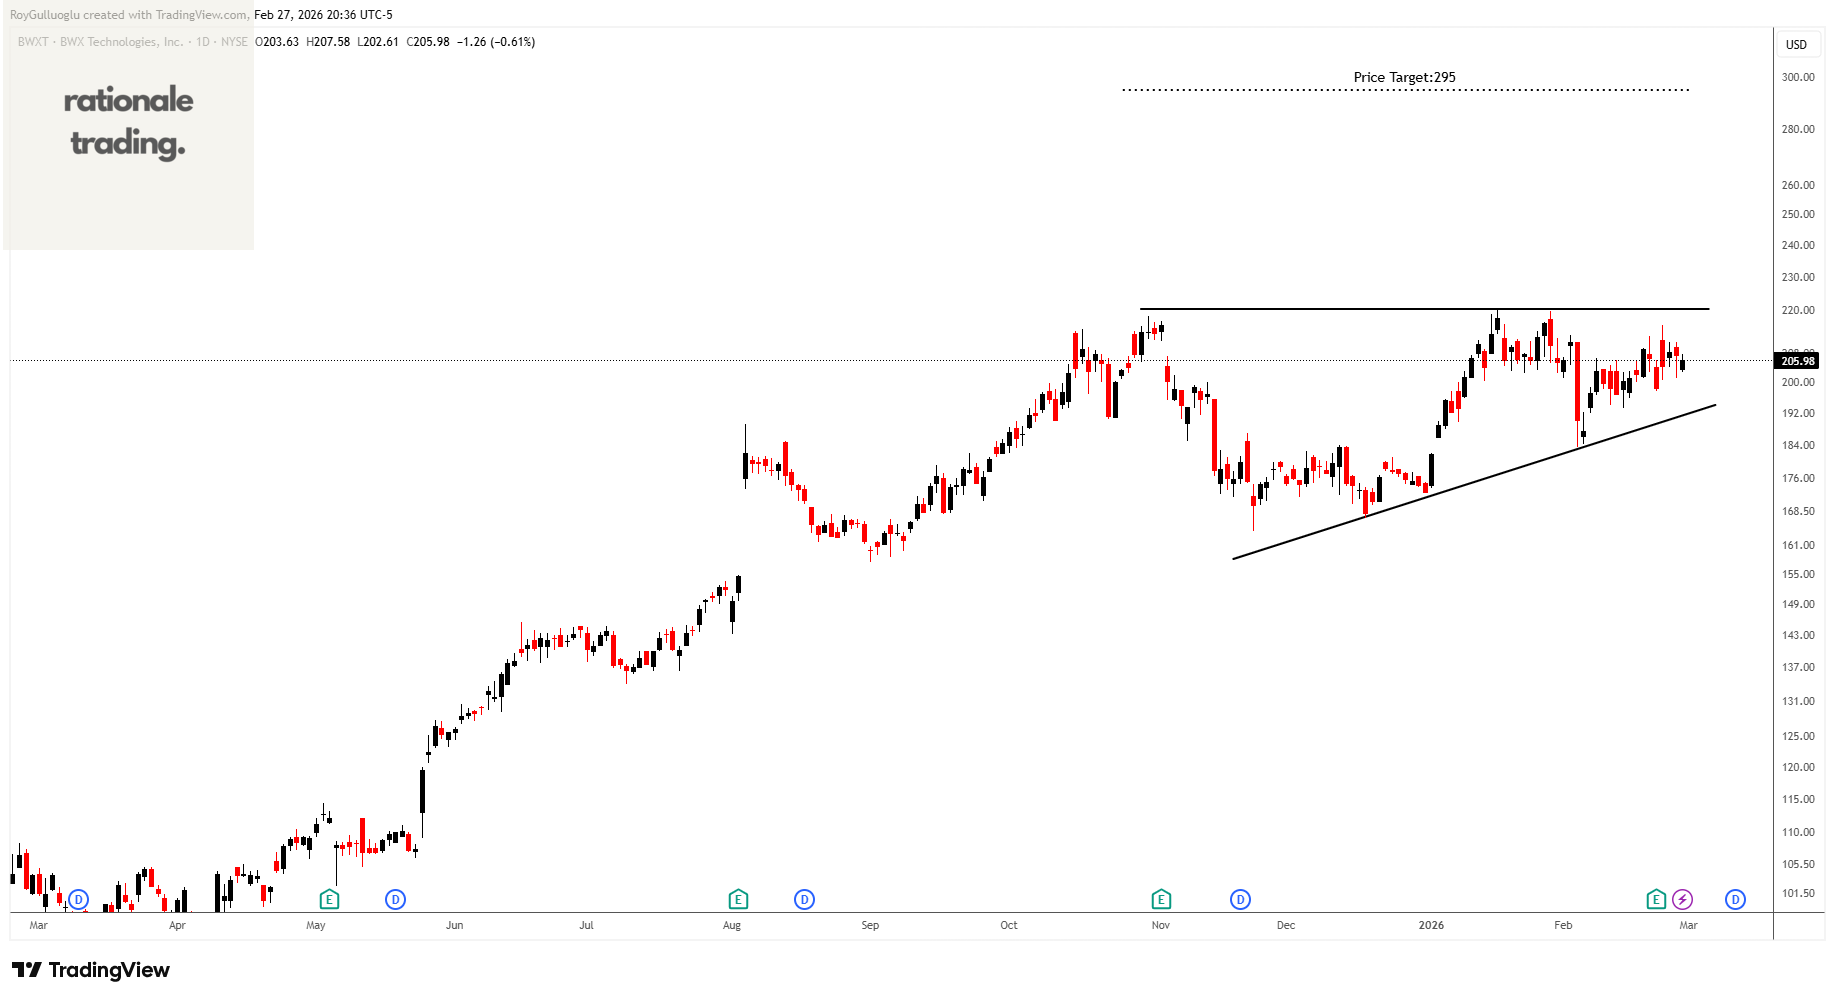
BWX Technologies, Inc. manufactures and sells nuclear components in the United States, Canada, and internationally.
The above daily chart formed an approximately 3-month-long ascending triangle chart pattern as a bullish reversal after a downtrend.
The horizontal boundary at 220.57 levels acts as a resistance within this pattern.
A daily close above 227.18 levels would validate the breakout from the 3-month-long ascending triangle chart pattern.
Based on this chart pattern, the potential price target is 295 levels.
TransMedics Group, Inc.-(TMDX/NASDAQ)-Long Idea
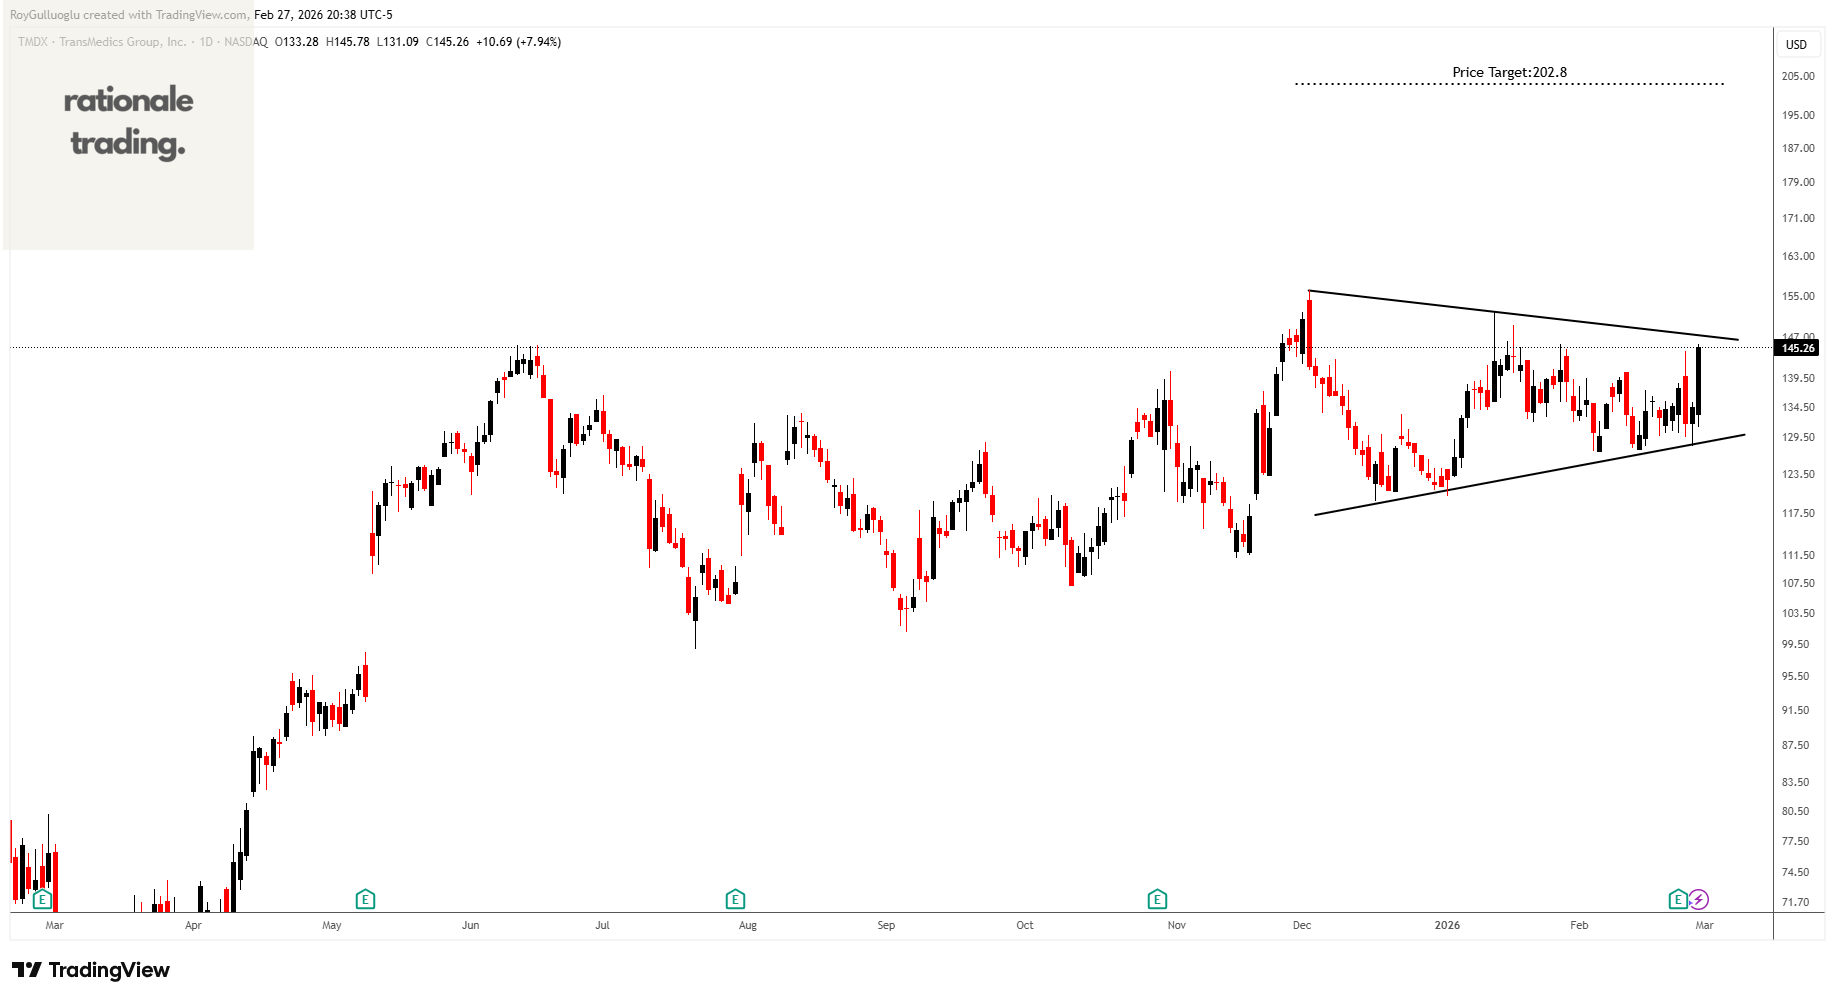
TransMedics Group, Inc., a commercial-stage medical technology company, engages in transforming organ transplant therapy for end-stage organ failure patients in the United States and internationally.
The above daily chart formed an approximately 2-month-long symmetrical triangle chart pattern as a bullish continuation after an uptrend.
A daily close above 152.45 levels would validate the breakout from the 2-month-long ascending triangle chart pattern.
Based on this chart pattern, the potential price target is 202.8 levels.
Paramount Resources Ltd. -(POU/TSX)-Long Idea
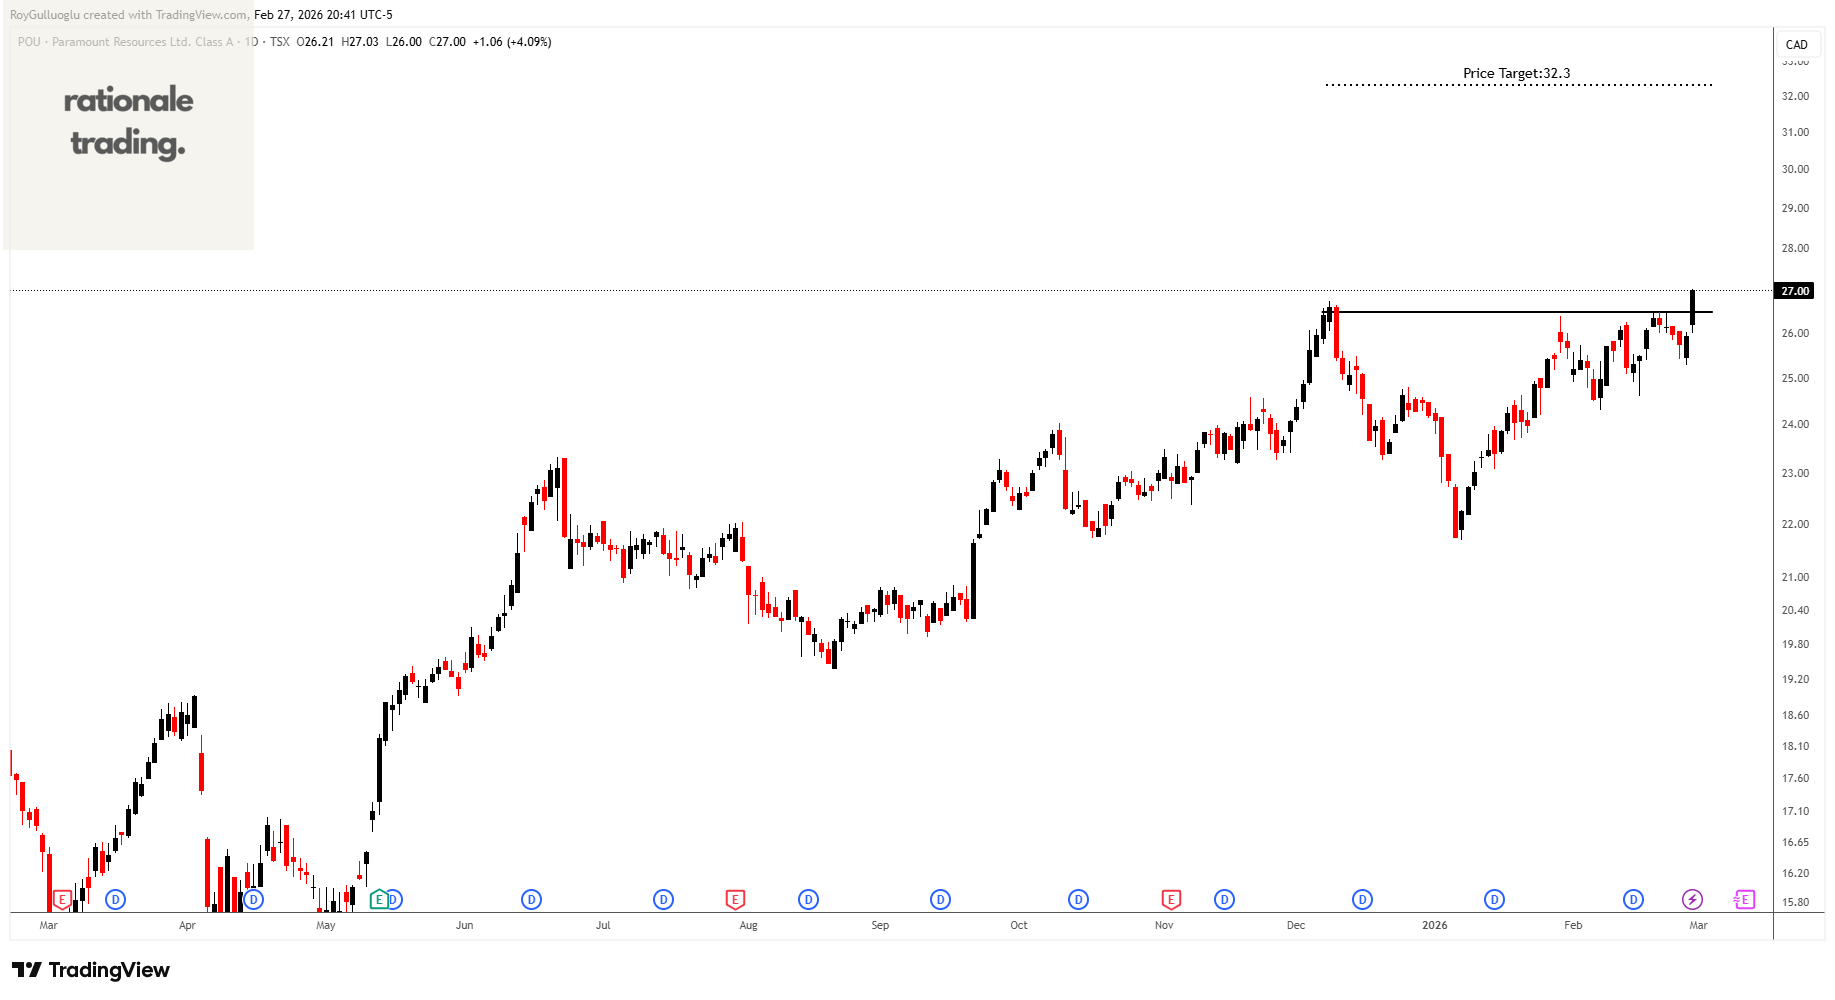
Paramount Resources Ltd., an energy company, explores for and develops conventional and unconventional petroleum and natural gas reserves and resources in Canada.
The above daily chart formed an approximately 2-month-long cup & handle chart pattern as a bullish continuation after an uptrend.
The horizontal boundary at 26.48 levels acts as a resistance within this pattern.
A daily close above 27.27 levels would validate the breakout from the 2-month-long cup & handle chart pattern.
Based on this chart pattern, the potential price target is 32.3 levels.
NKT A/S-(NKT/OMXCOP)-Long Idea
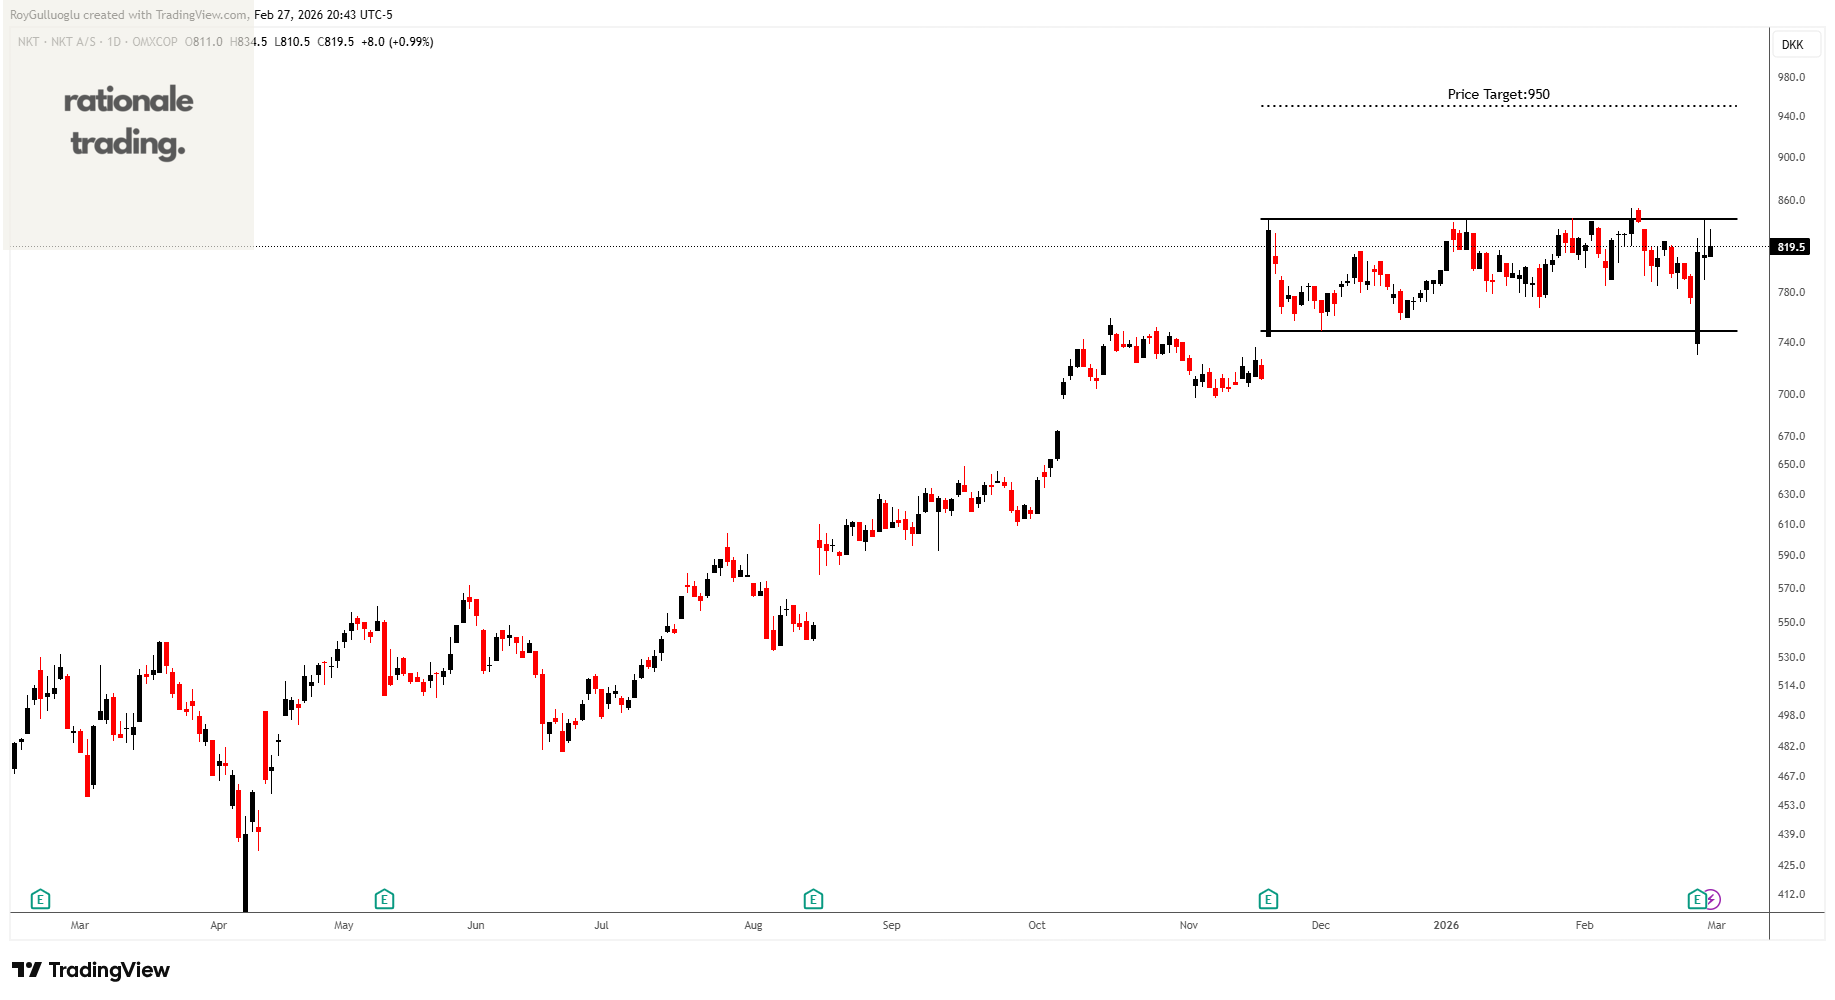
NKT A/S designs, manufactures, and installs low, medium, and high voltage power cable solutions in Denmark. It operates through Solutions, Applications and Service & Accessories segments.
The above daily chart formed an approximately 3-month-long rectangle chart pattern as a bullish continuation after an uptrend.
The horizontal boundary at 843.5 levels acts as a resistance within this pattern.
A daily close above 868.8 levels would validate the breakout from the 3-month-long rectangle chart pattern.
Based on this chart pattern, the potential price target is 950 levels.
RONESANS GAYRIMENKUL YAT.-(RGYAS/BIST)-Long Idea
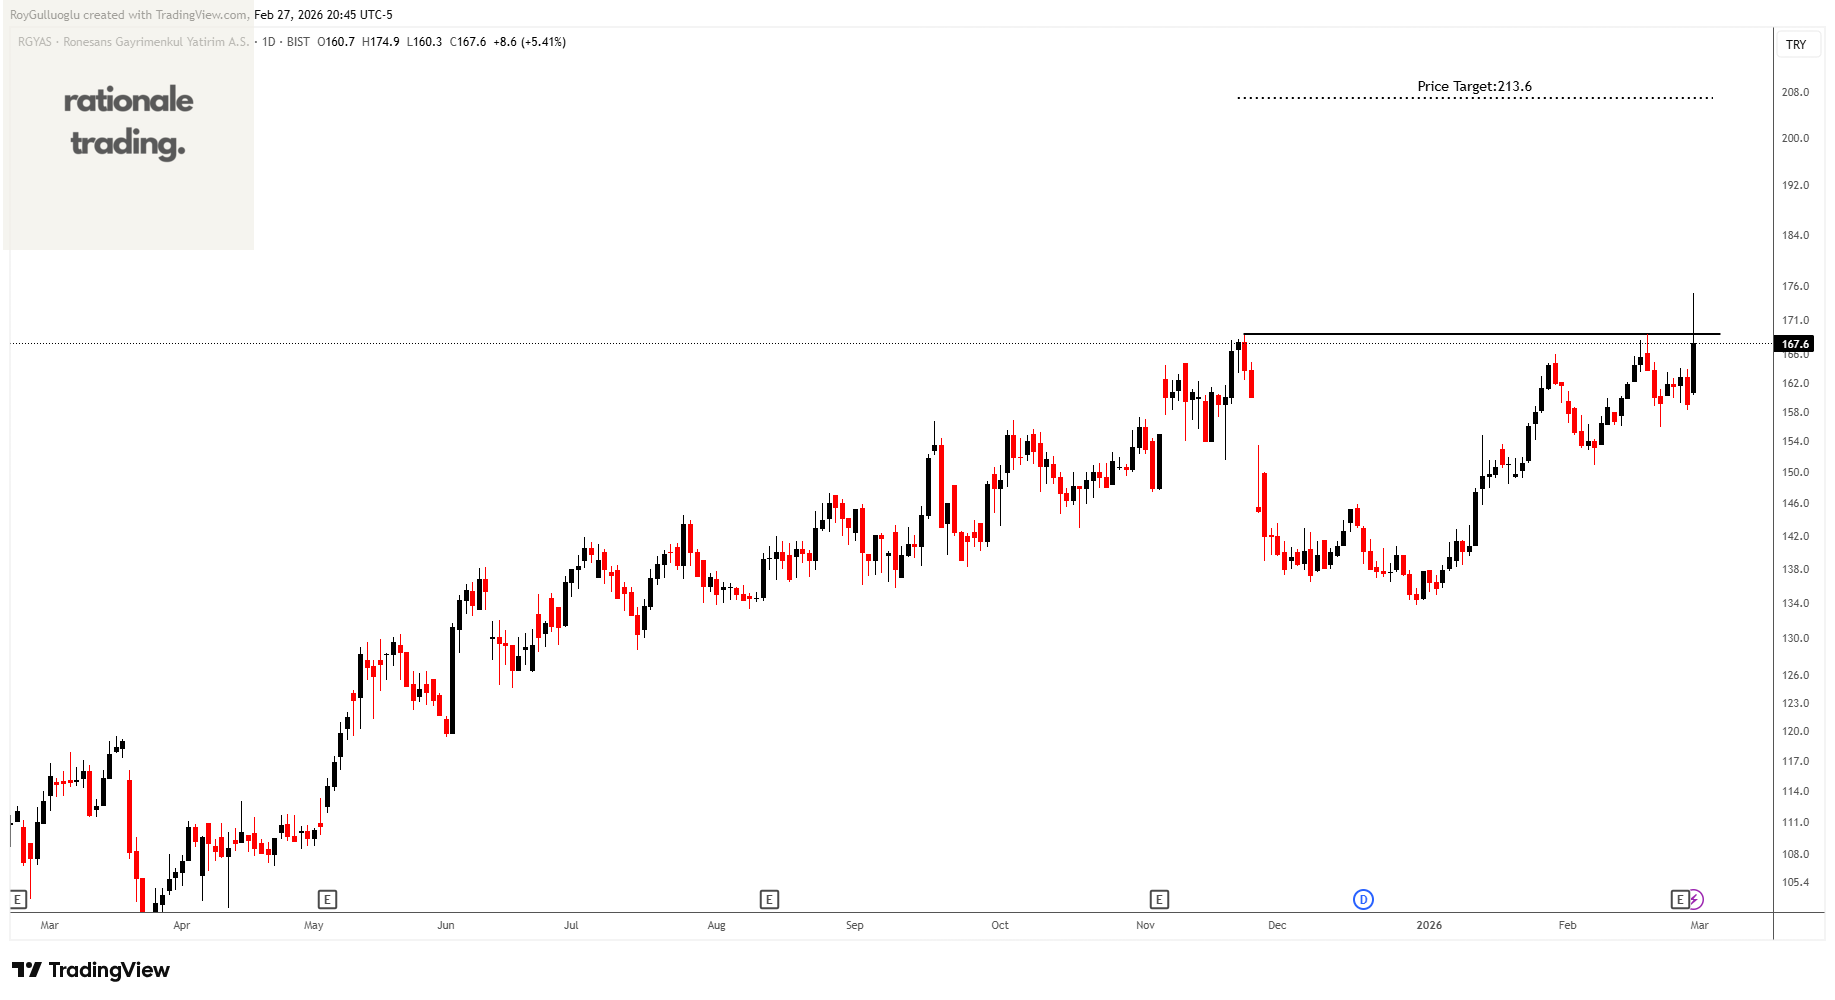
Ronesans Gayrimenkul Yatirim A.S., together with its subsidiaries, operates as the commercial real estate development and investment company in Türkiye.
The above daily chart formed an approximately 3-month-long cup & handle chart pattern as a bullish continuation after an uptrend.
The horizontal boundary at 168.9 levels acts as a resistance within this pattern.
A daily close above 174 levels would validate the breakout from the 3-month-long cup & handle chart pattern.
Based on this chart pattern, the potential price target is 213.6 levels.
Teşekkürler Roy