

Trade Ideas Equities
NVDA(NASDAQ), FN(NYSE), ATS(NYSE), ASC(NYSE), CLS(NASDAQ), PLD(NYSE)

NVIDIA Corporation-(NVDA/NASDAQ)-Long Idea
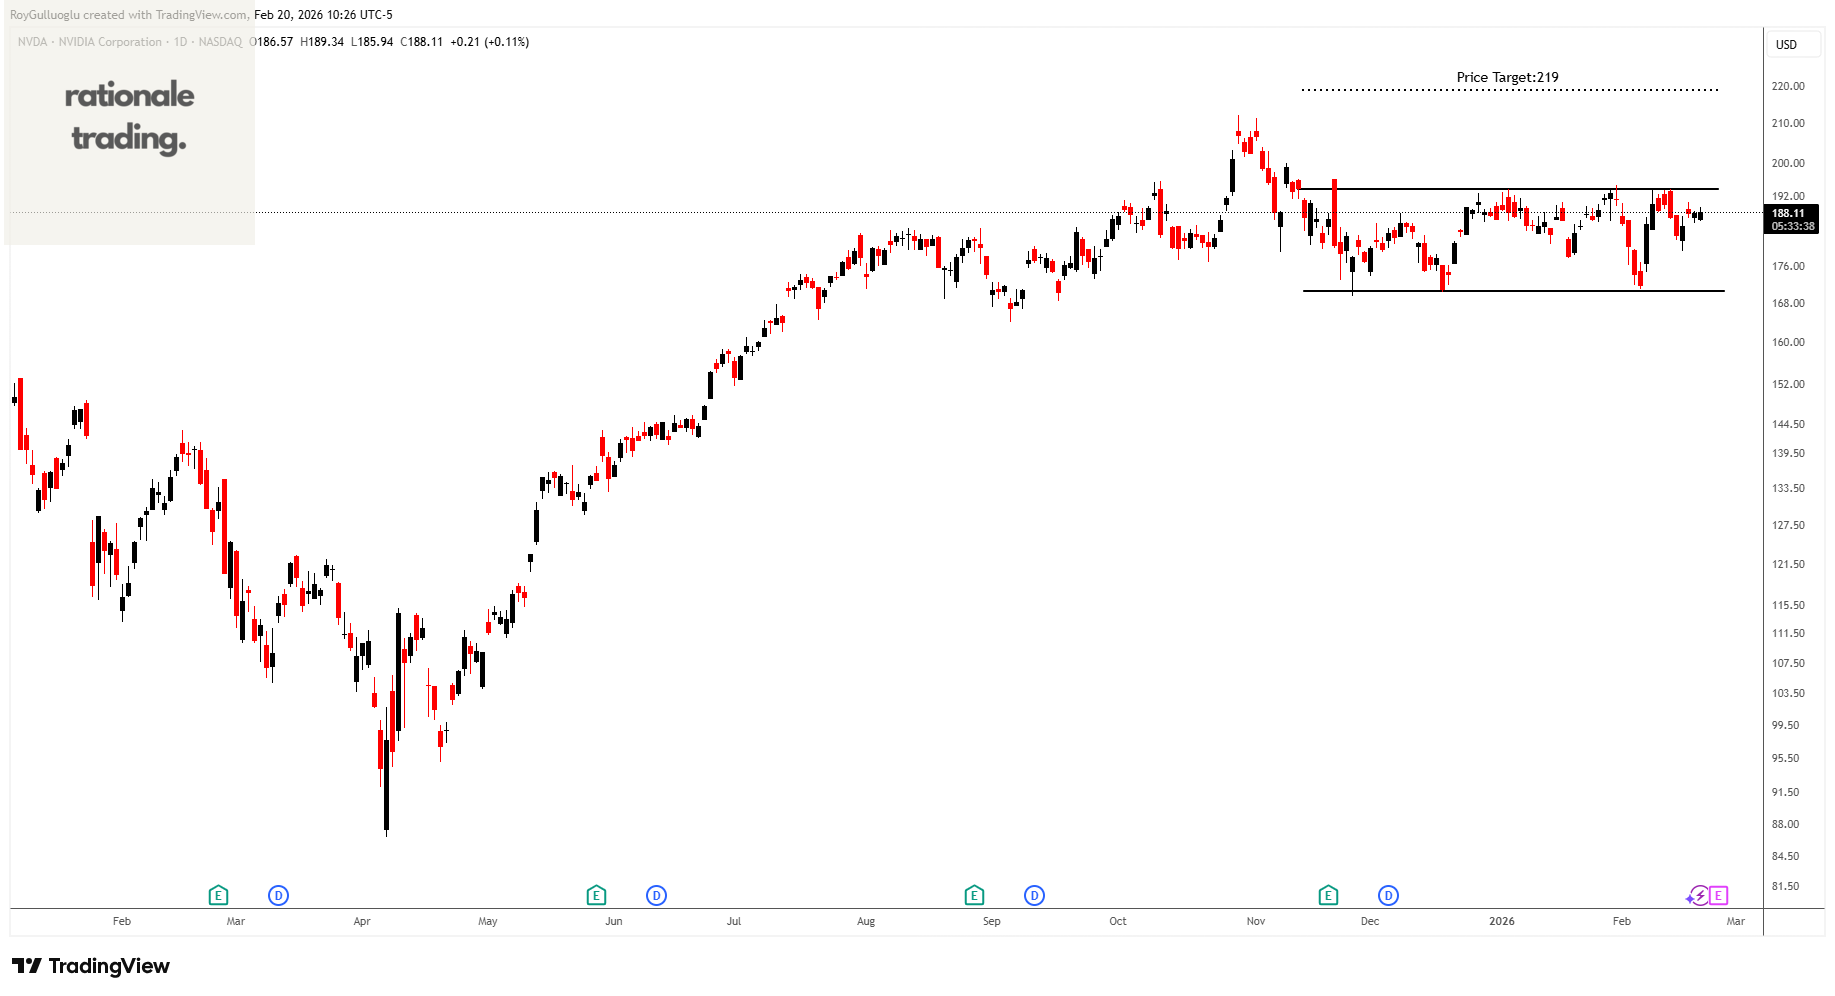
NVIDIA Corporation, a computing infrastructure company, provides graphics and compute and networking solutions in the United States, Singapore, Taiwan, China, Hong Kong, and internationally
The above daily chart formed an approximately 2-month-long rectangle chart pattern as a bullish reversal after a downtrend.
The horizontal boundary at 193.66 levels acts as a resistance within this pattern.
A daily close above 199.4 levels would validate the breakout from the 2-month-long rectangle chart pattern.
Based on this chart pattern, the potential price target is 219 levels.
Fabrinet-(FN/NYSE)-Long Idea
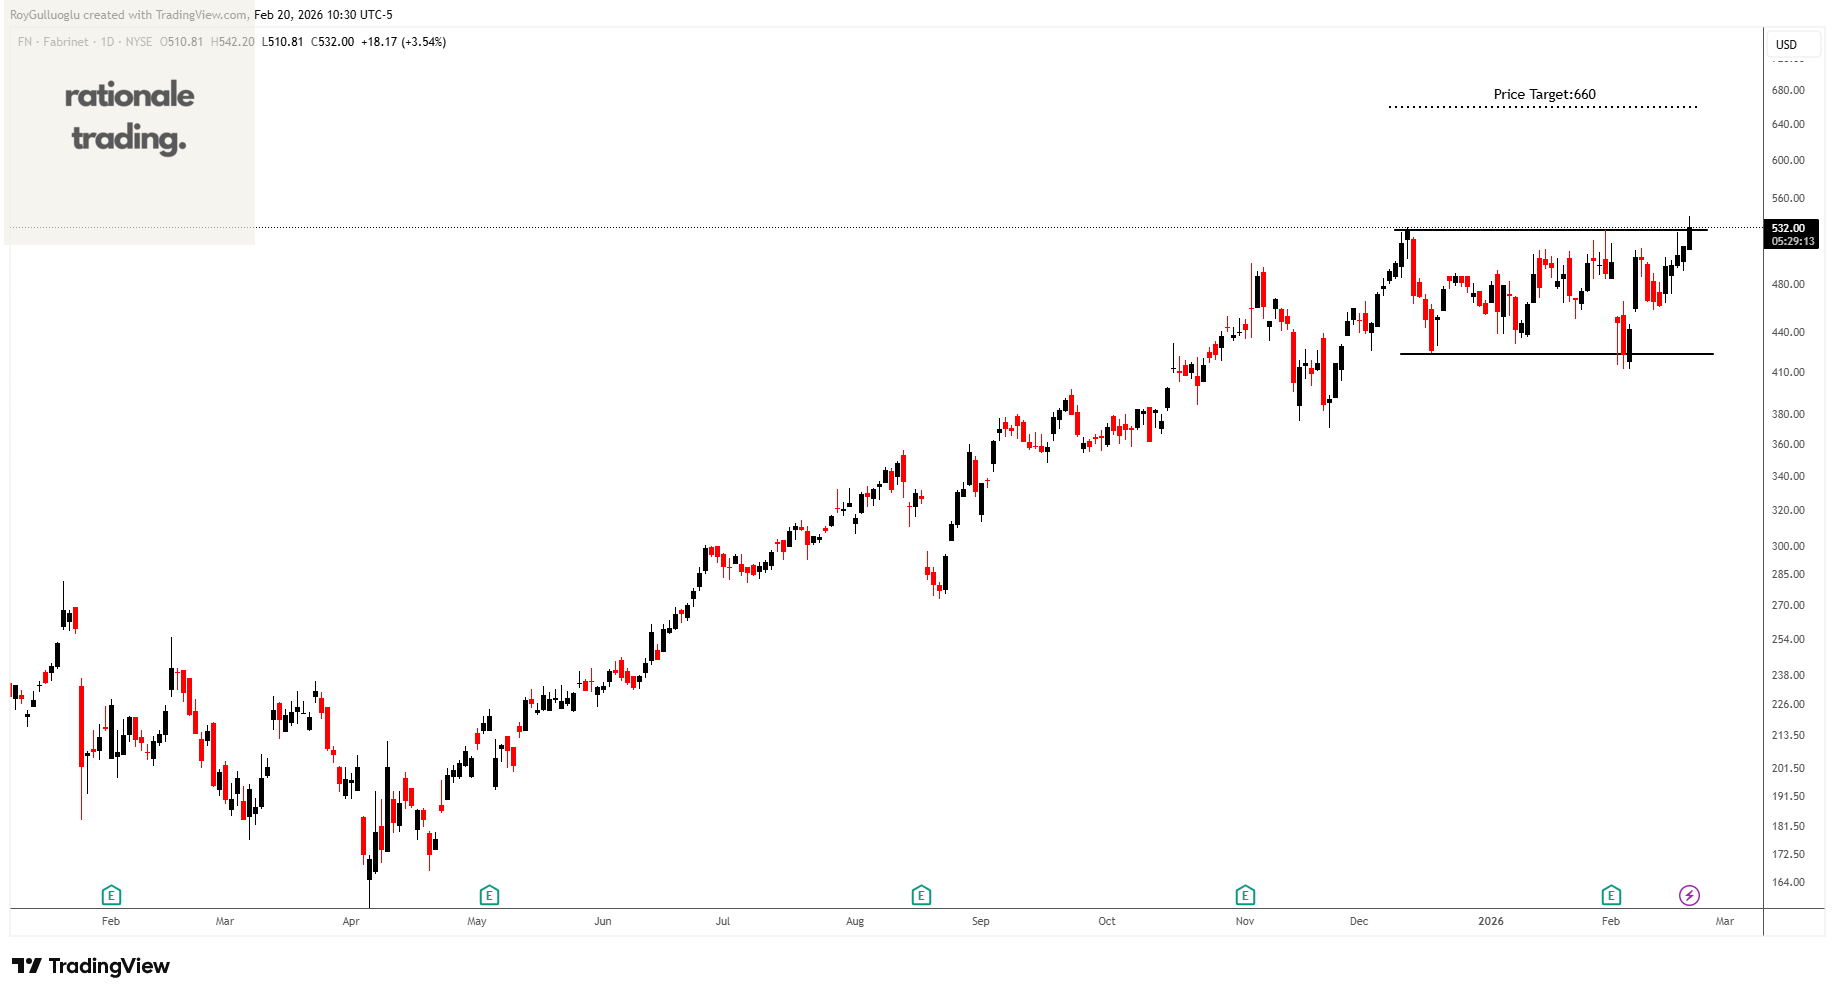
Fabrinet provides optical packaging and precision optical, electro-mechanical, and electronic manufacturing services in North America, the Asia-Pacific, and Europe.
The above daily chart formed an approximately 2-month-long rectangle chart pattern as a bullish continuation after an uptrend.
The horizontal boundary at 528.8 levels acts as a resistance within this pattern.
A daily close above 544.6 levels would validate the breakout from the 2-month-long rectangle chart pattern.
Based on this chart pattern, the potential price target is 660 levels.
ATS Corporation-(ATS/NYSE)-Long Idea
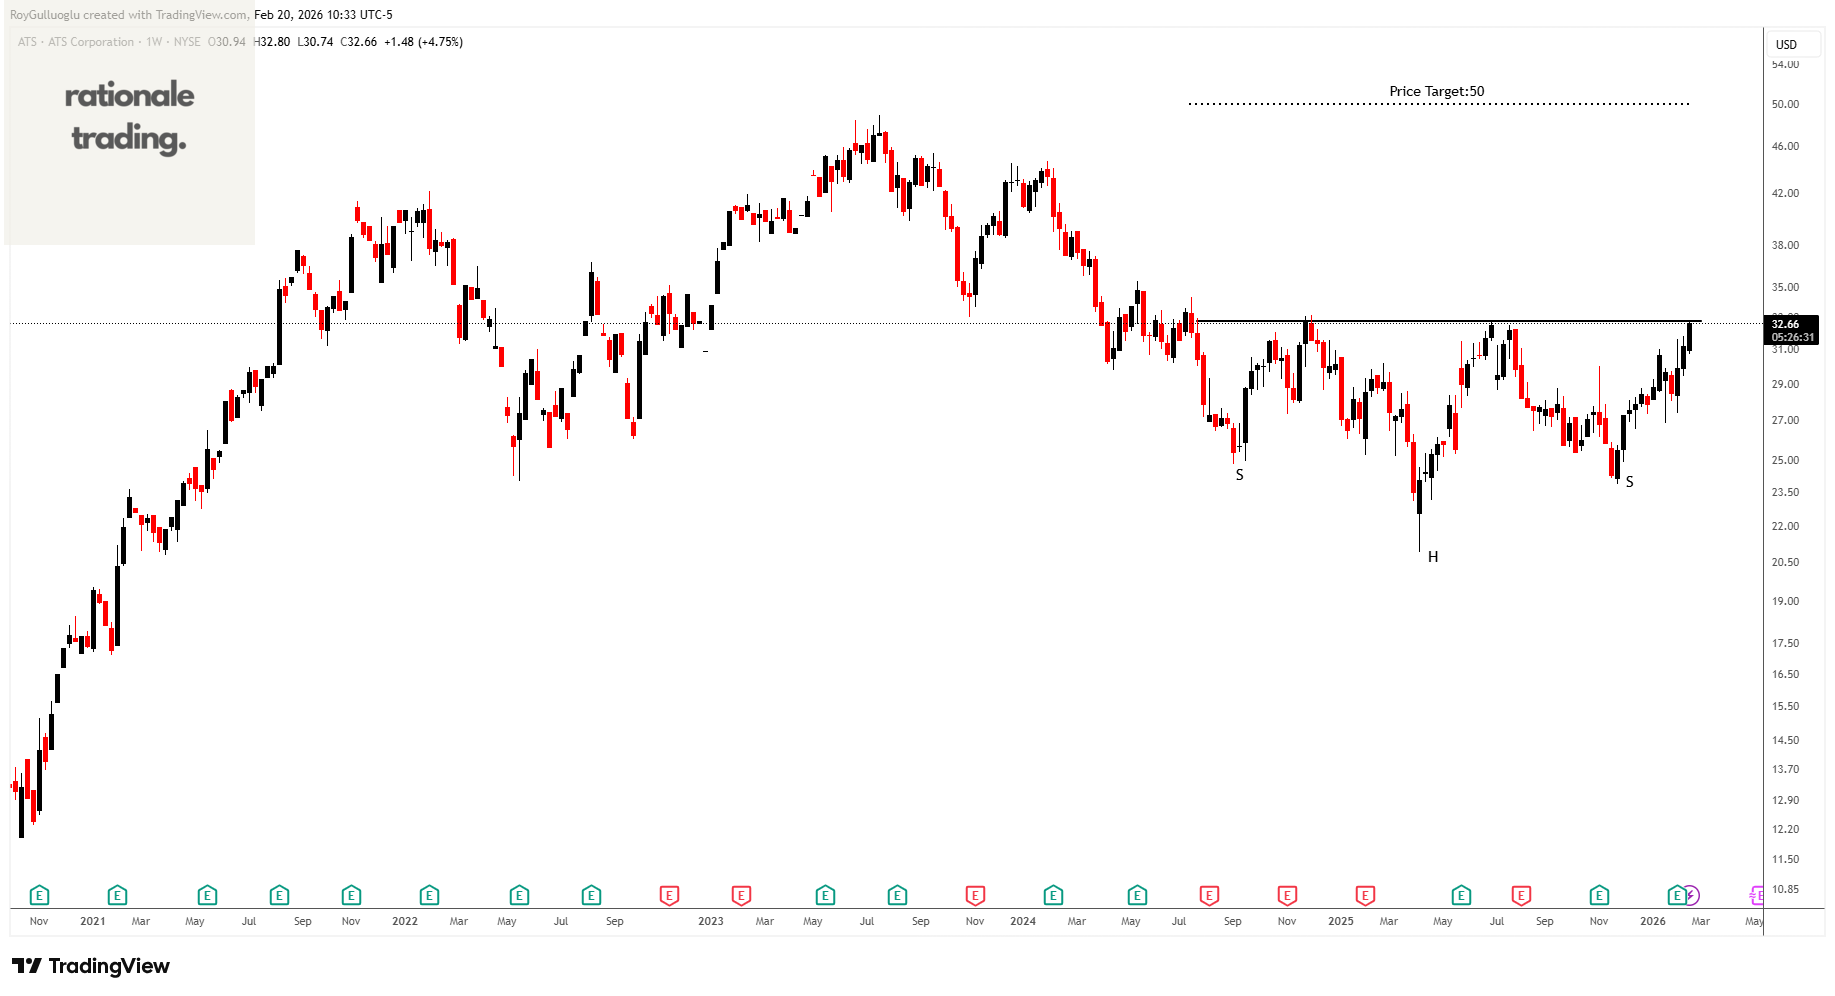
ATS Corporation, together with its subsidiaries, provides automation solutions worldwide. The company is involved in planning, designing, building, commissioning, and servicing automated manufacturing and assembly systems, including automation products and test solutions.
The above weekly chart formed an approximately 20-month-long H&S bottom chart pattern as a bullish reversal after a downtrend.
The horizontal boundary at 32.73 levels acts as a resistance within this pattern.
A daily close above 33.72 levels would validate the breakout from the 20-month-long H&S bottom chart pattern.
Based on this chart pattern, the potential price target is 50 levels.
Ardmore Shipping Corporation-(ASC/NYSE)-Long Idea
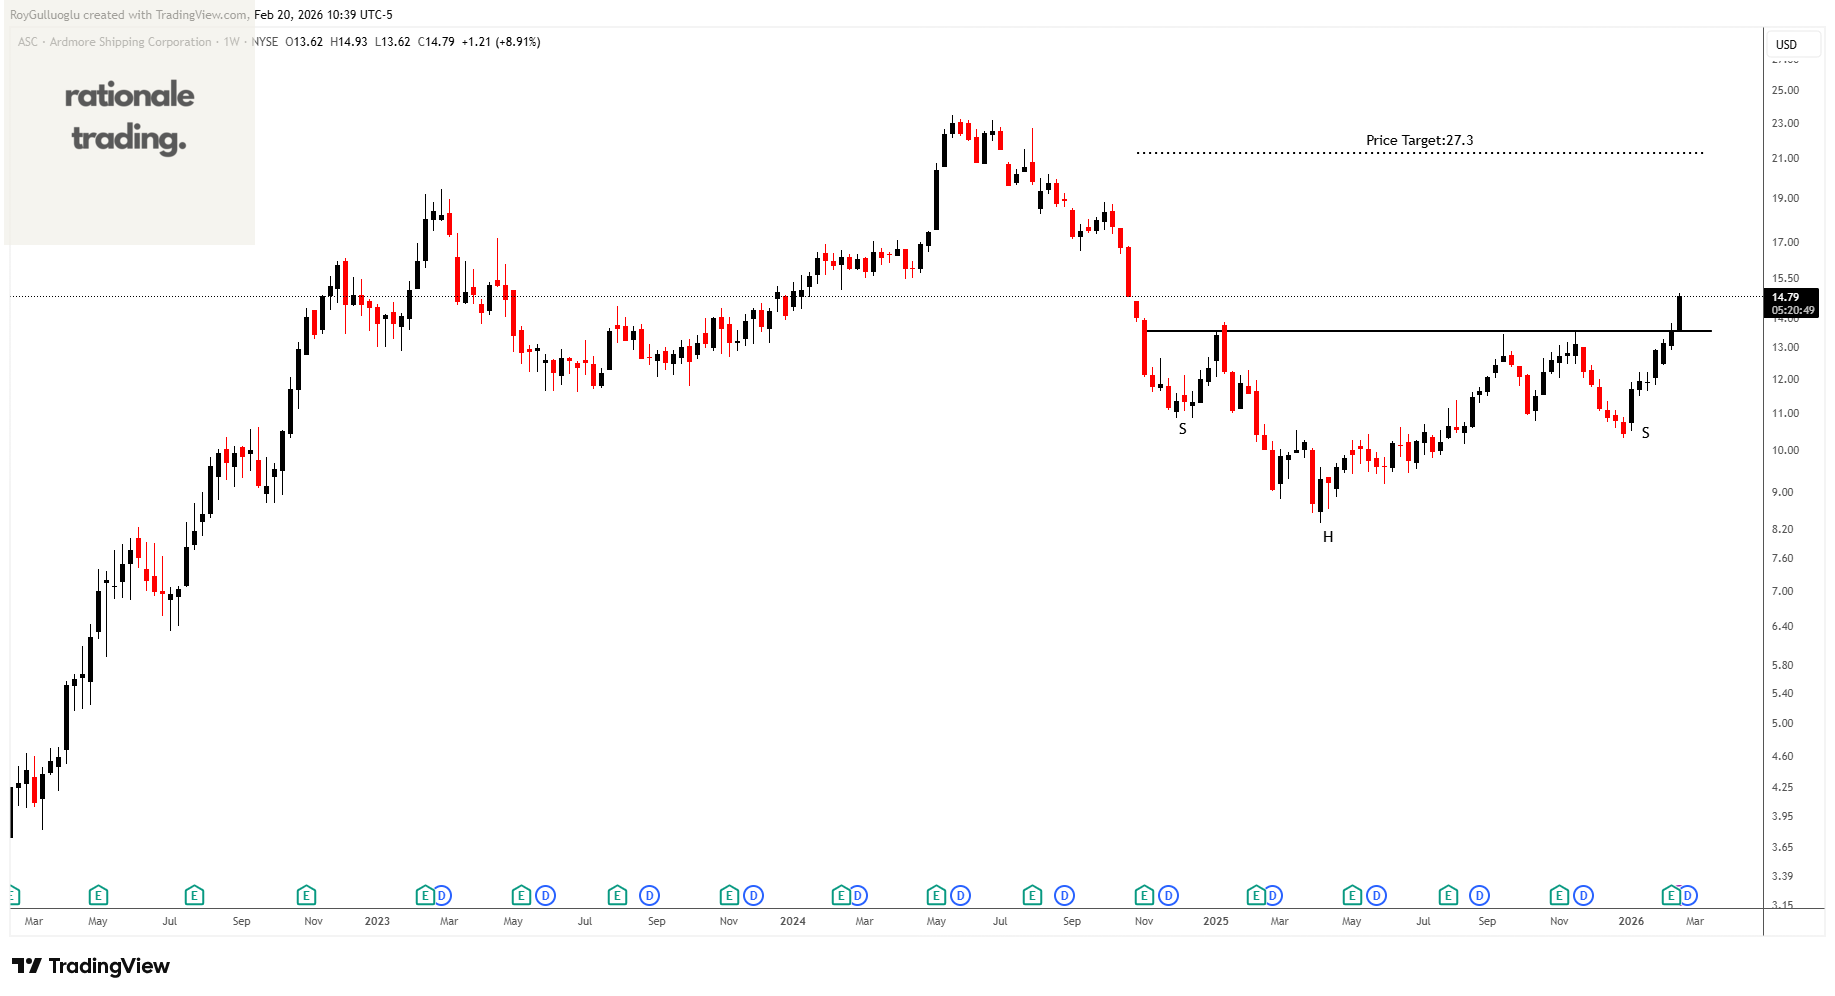
Ardmore Shipping Corporation engages in the seaborne transportation of petroleum products and chemicals worldwide.
The above weekly chart formed an approximately 20-month-long H&S bottom chart pattern as a bullish reversal after a downtrend.
The horizontal boundary at 13.56 levels acted as a resistance within this pattern.
A daily close above 13.96 levels validated the breakout from the 20-month-long H&S bottom chart pattern.
Based on this chart pattern, the potential price target is 27.3 levels.
Celestica Inc.-(CLS/NYSE)-Long Idea
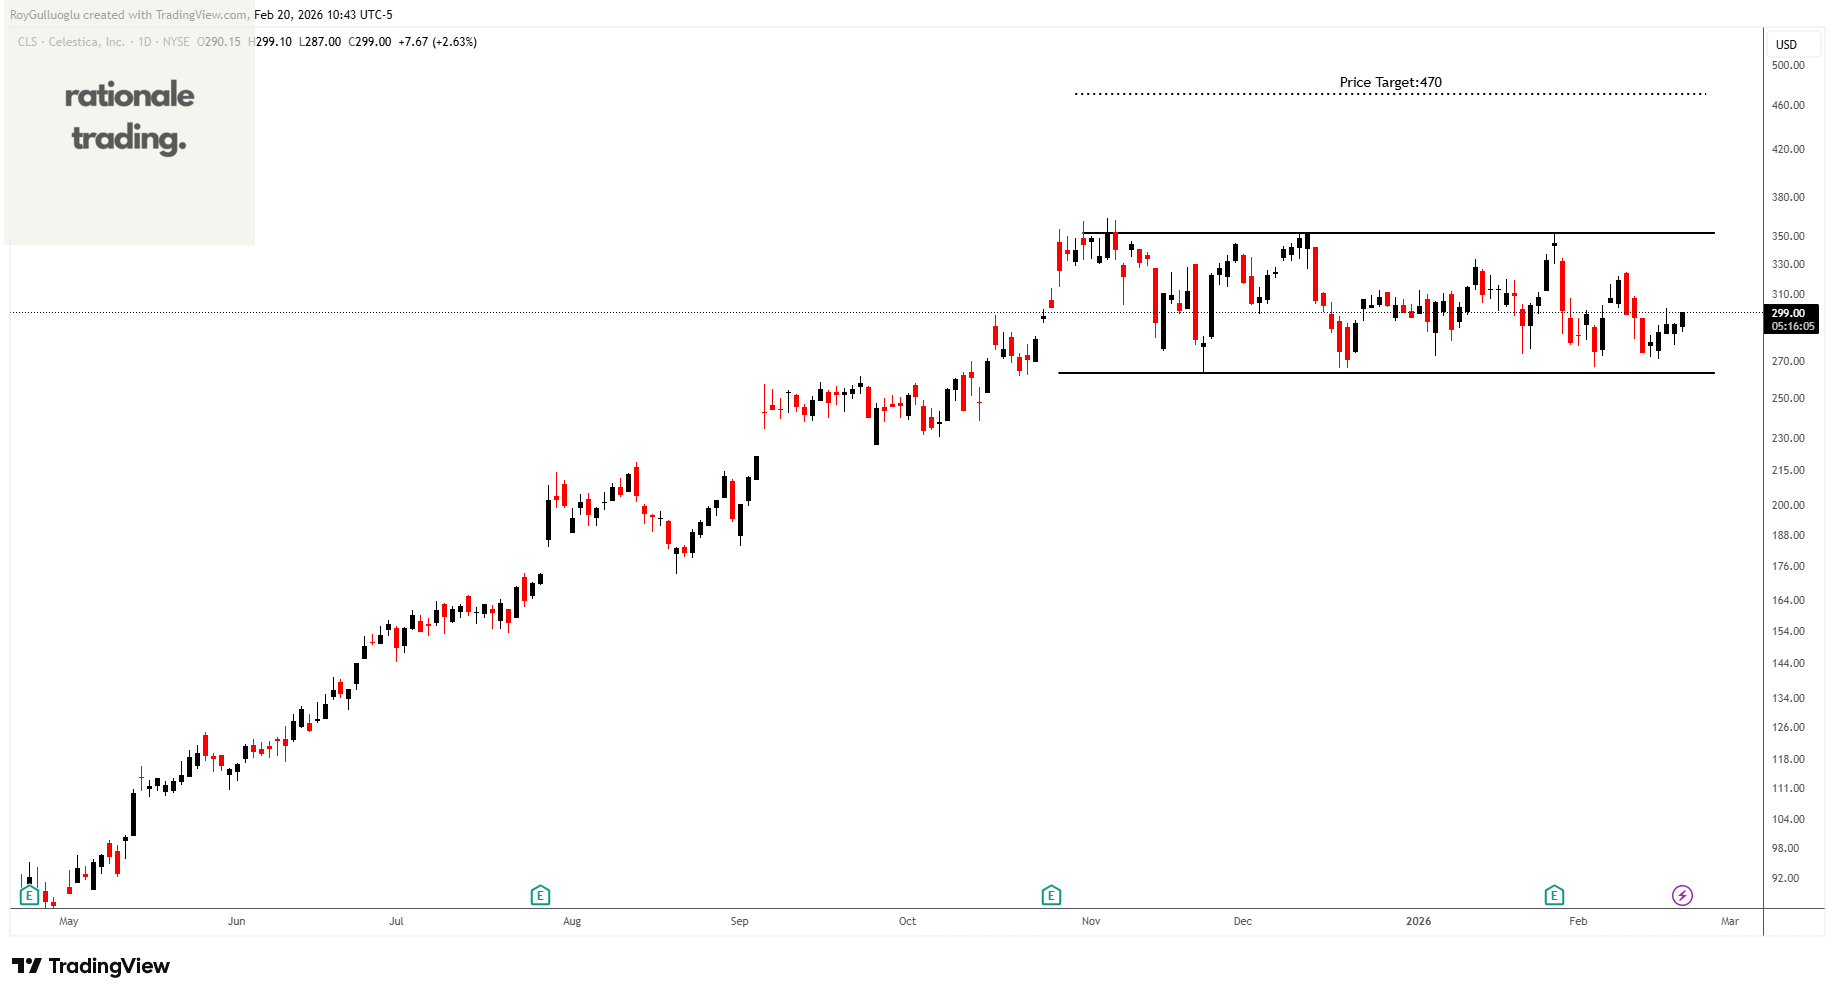
Celestica Inc., together with its subsidiaries, provides supply chain solutions in Asia, North America, and internationally.
The above daily chart formed an approximately 3-month-long rectangle chart pattern as a bullish continuation after an uptrend.
The horizontal boundary at 352.2 levels acts as a resistance within this pattern.
A daily close above 362.75 levels would validate the breakout from the 3-month-long rectangle chart pattern.
Based on this chart pattern, the potential price target is 470 levels.
Prologis, Inc.-(PLD/NYSE)-Long Idea
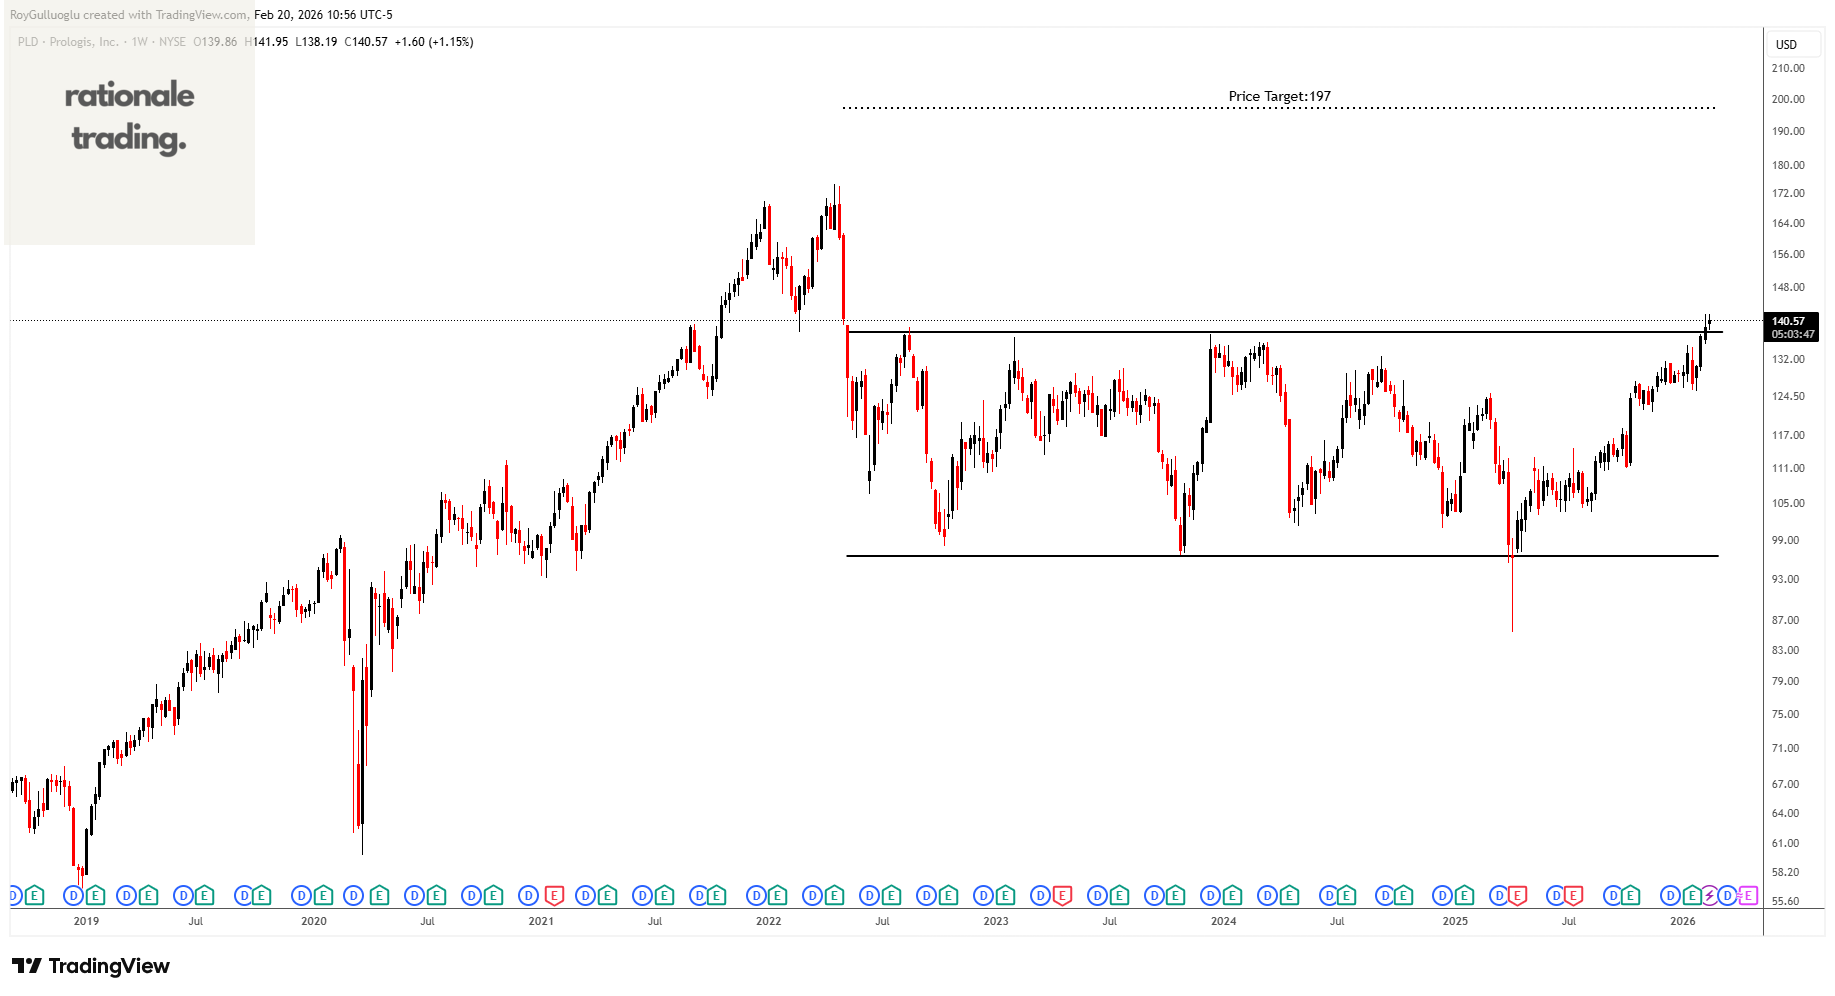
Prologis, Inc., is the global leader in logistics real estate with a focus on high-barrier, high-growth markets.
The above weekly chart formed an approximately 45-month-long rectangle chart pattern as a bullish reversal after a downtrend.
The horizontal boundary at 137.82 levels acts as a resistance within this pattern.
A daily close above 141.95 levels would validate the breakout from the 45-month-long rectangle chart pattern.
Based on this chart pattern, the potential price target is 197 levels.
Great clean patterns this week, Roy.
Teşekkürler Roy