


News Corporation-(NWS/NASDAQ)-Long Idea
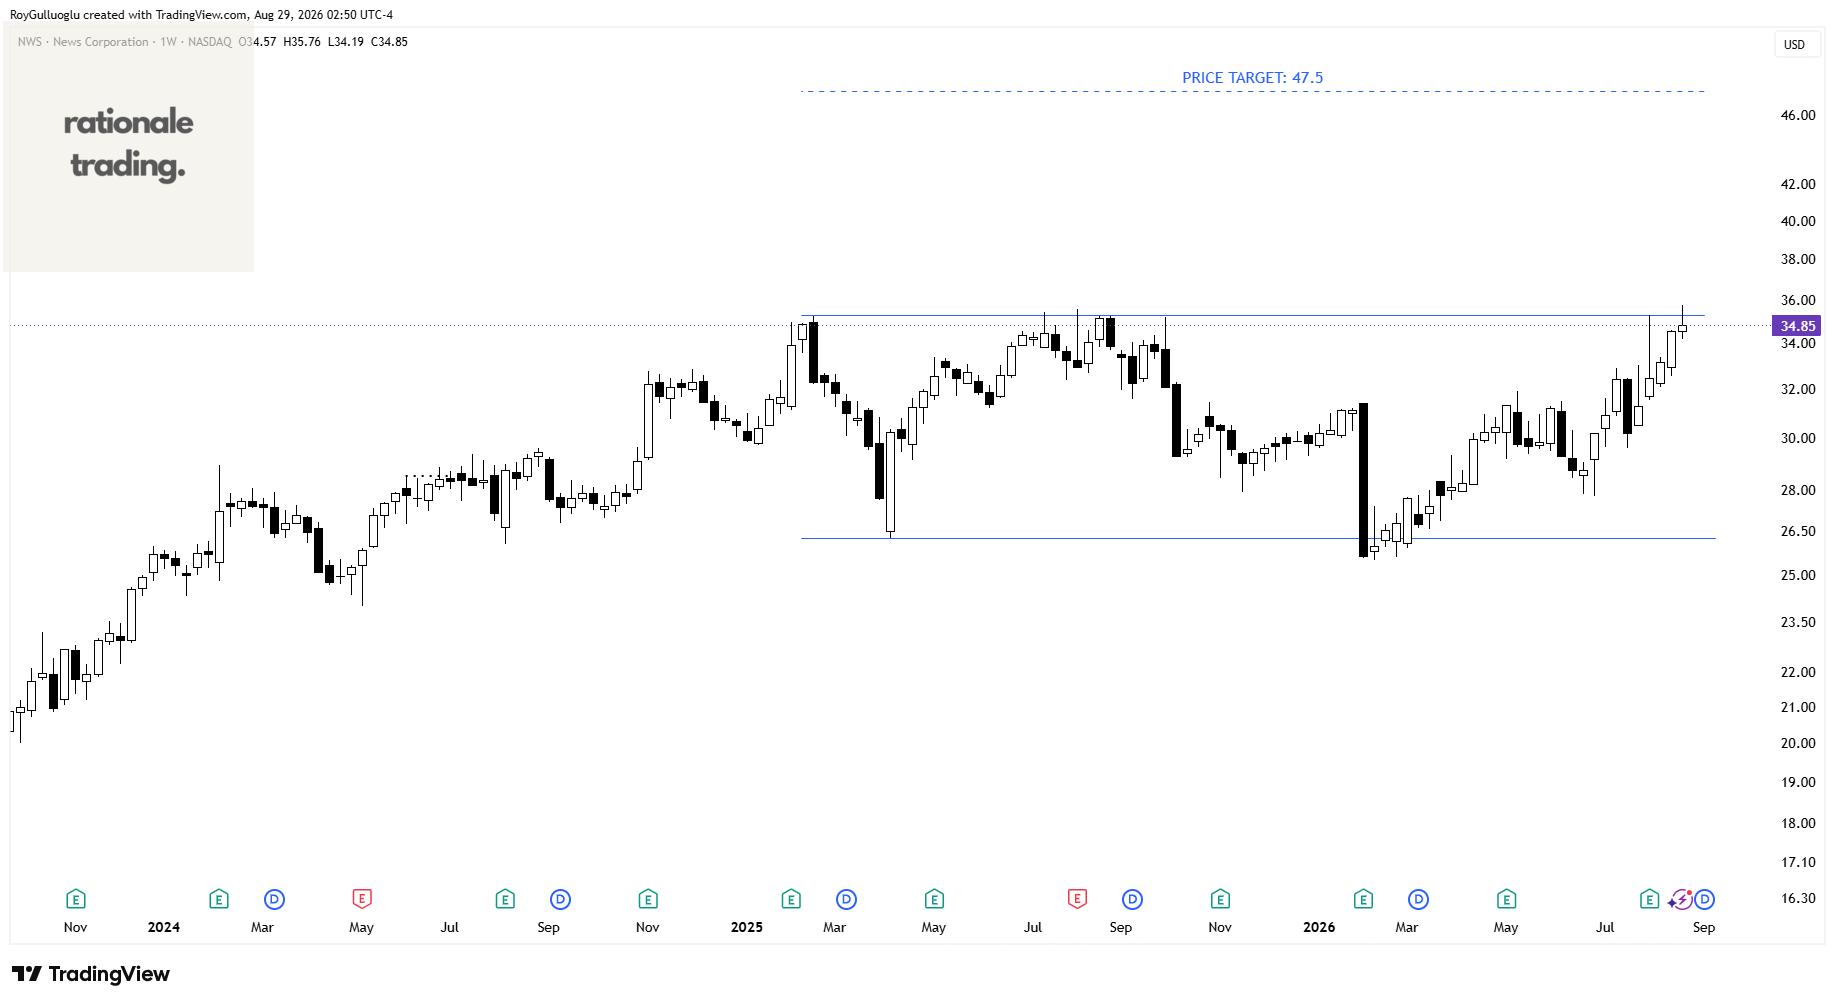
News Corporation, a media and information services company, creates and distributes authoritative and engaging content, and other products and services for consumers and businesses
The above weekly chart formed an approximately 20-month-long rectangle chart pattern as a bullish continuation after an uptrend.
Within this pattern, the horizontal boundary at 35.31 levels acts as a resistance.
A daily close above 36.35 levels would validate the breakout from the 20-month-long rectangle chart pattern.
Based on this chart pattern, the potential price target is 47.5 levels.
Mistras Group, Inc.-(MG/NYSE)-Long Idea
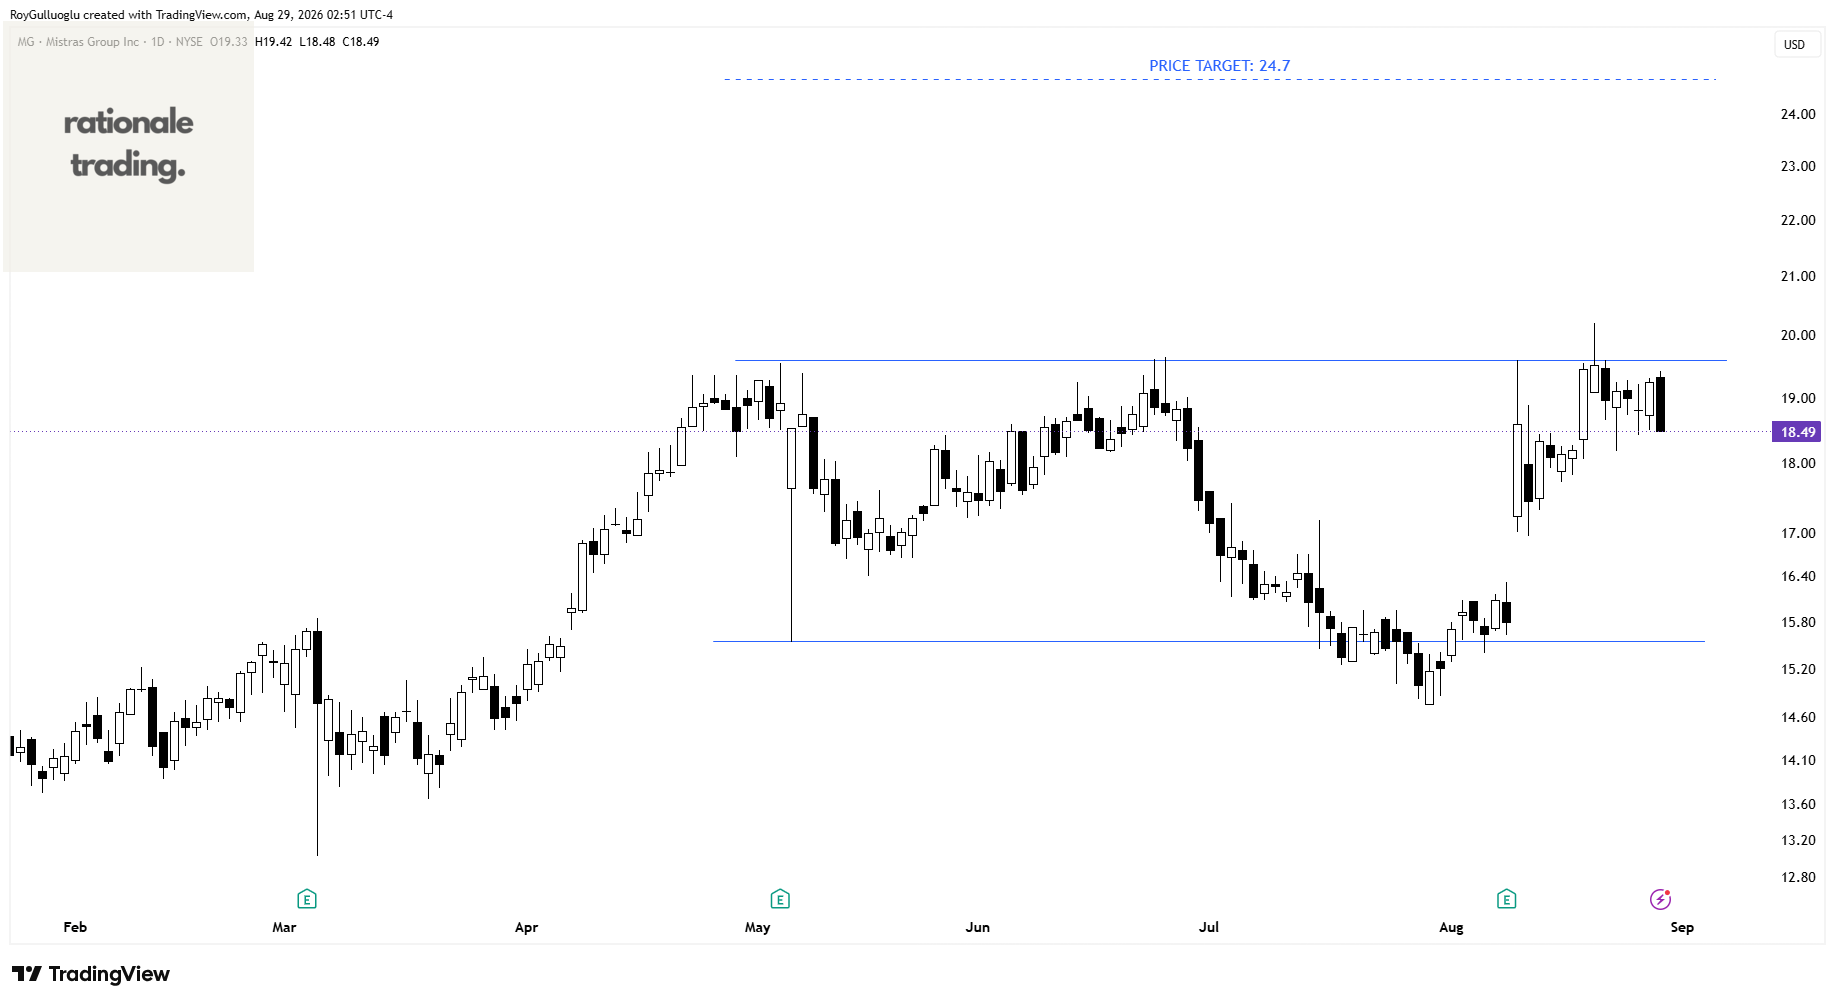
Mistras Group, Inc. provides technology-enabled industrial asset integrity and laboratory testing solutions in the United States, Europe, the Middle East, Africa, Asia, and South America.
The above daily chart formed an approximately 3-month-long rectangle chart pattern as a bullish continuation after an uptrend.
Within this pattern, the horizontal boundary at 19.6 levels acts as a resistance.
A daily close above 20.18 levels would validate the breakout from the 3-month-long rectangle chart pattern.
Based on this chart pattern, the potential price target is 24.7 levels.
Tarsus Pharmaceuticals, Inc.-(TARS/NASDAQ)-Long Idea
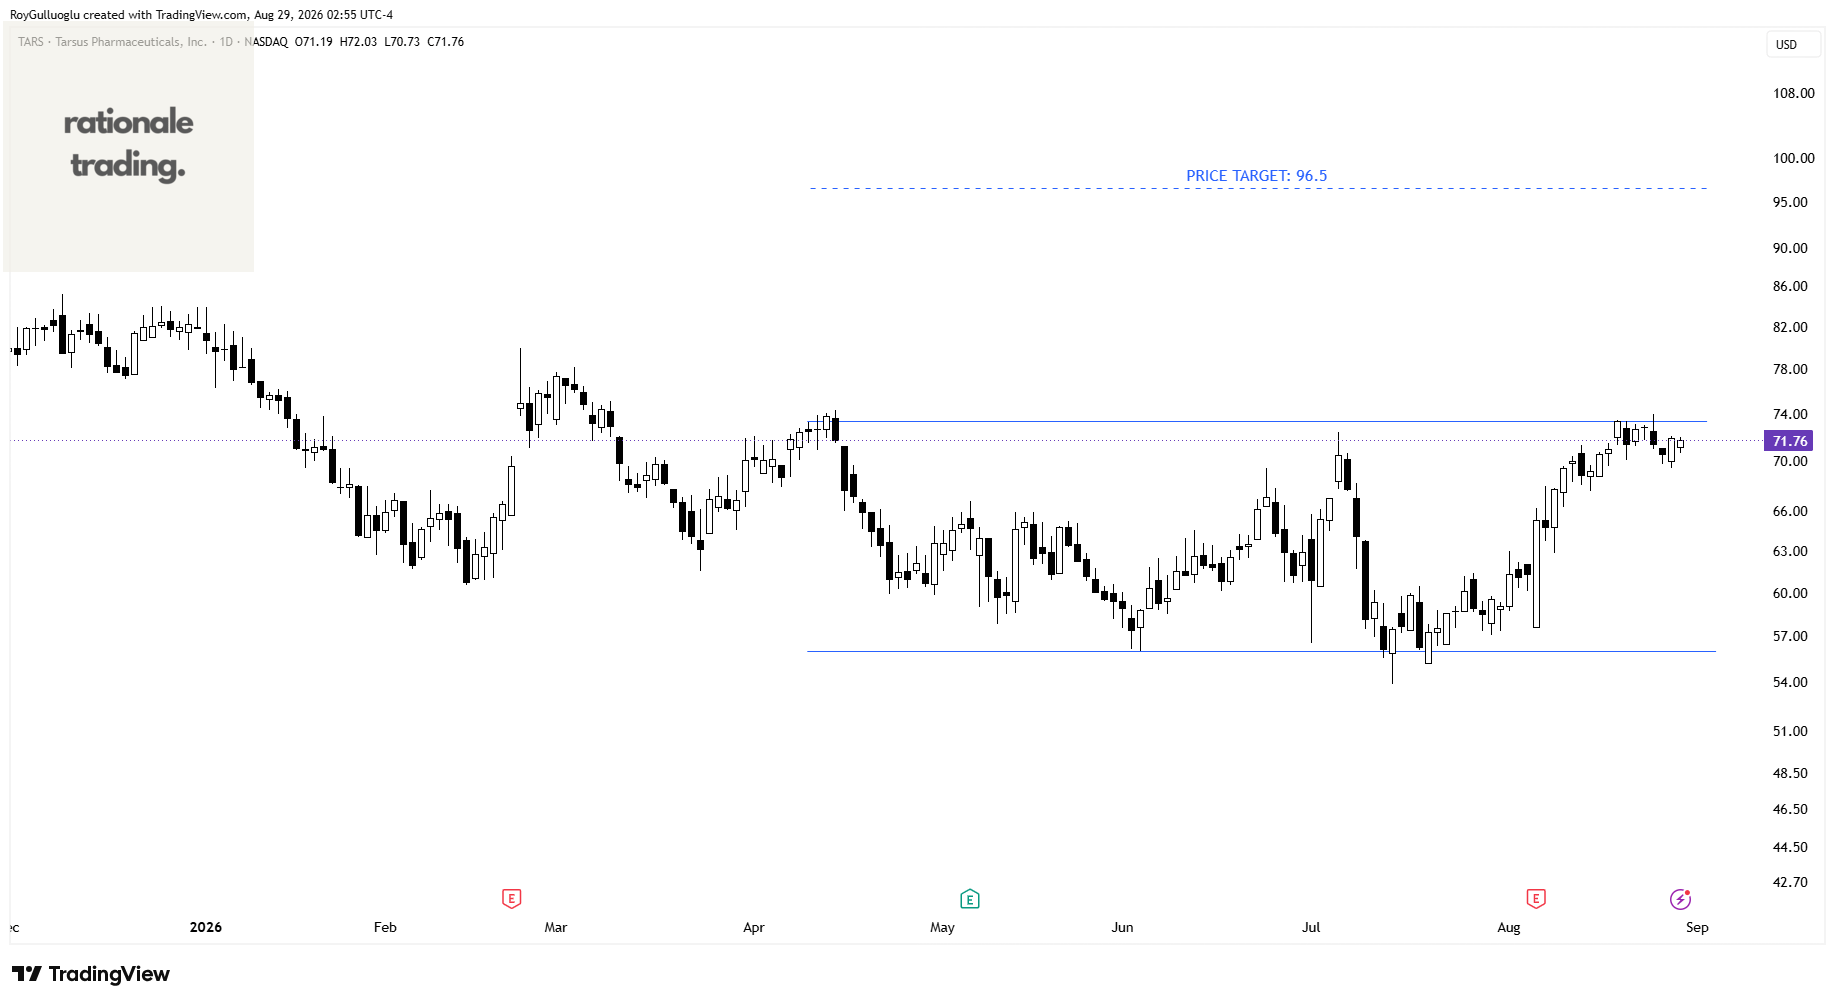
Tarsus Pharmaceuticals, Inc., a commercial stage biopharmaceutical company, focuses on the development and commercialization of therapeutic candidates for eye care in the United States.
The above daily chart formed an approximately 3-month-long rectangle chart pattern as a bullish reversal after a downtrend.
Within this pattern, the horizontal boundary at 73.42 levels acts as a resistance.
A daily close above 75.6 levels would validate the breakout from the 3-month-long rectangle chart pattern.
Based on this chart pattern, the potential price target is 96.5 levels.
Interactive Brokers Group, Inc.-(IBKR/NASDAQ)-Long Idea
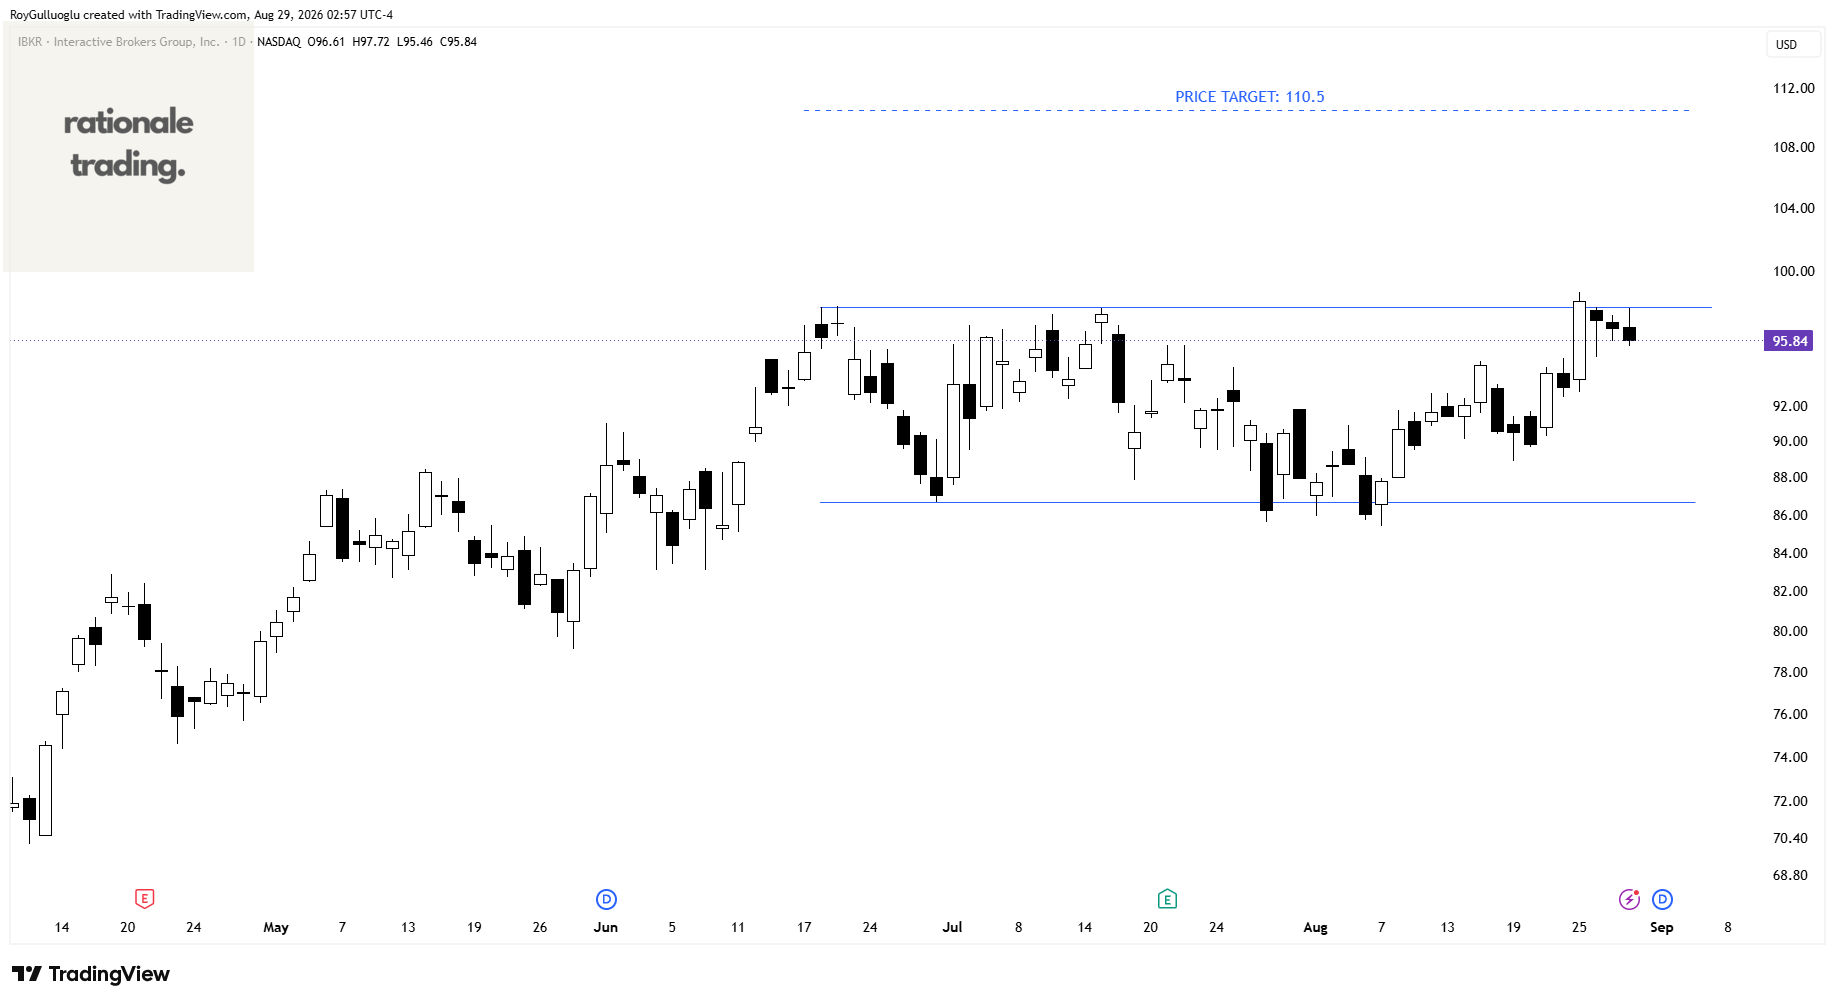
Interactive Brokers Group, Inc. operates as an automated electronic broker in the United States and internationally.
The above daily chart formed an approximately 2-month-long rectangle chart pattern as a bullish continuation after an uptrend.
Within this pattern, the horizontal boundary at 97.8 levels acts as a resistance.
A daily close above 100.7 levels would validate the breakout from the 2-month-long rectangle chart pattern.
Based on this chart pattern, the potential price target is 110.5 levels.
Avino Silver & Gold Mines Ltd.-(ASM/TSX)-Long Idea
Avino Silver & Gold Mines Ltd., together with its subsidiaries, engages in the acquisition, exploration, and advancement of mineral properties in Mexico.
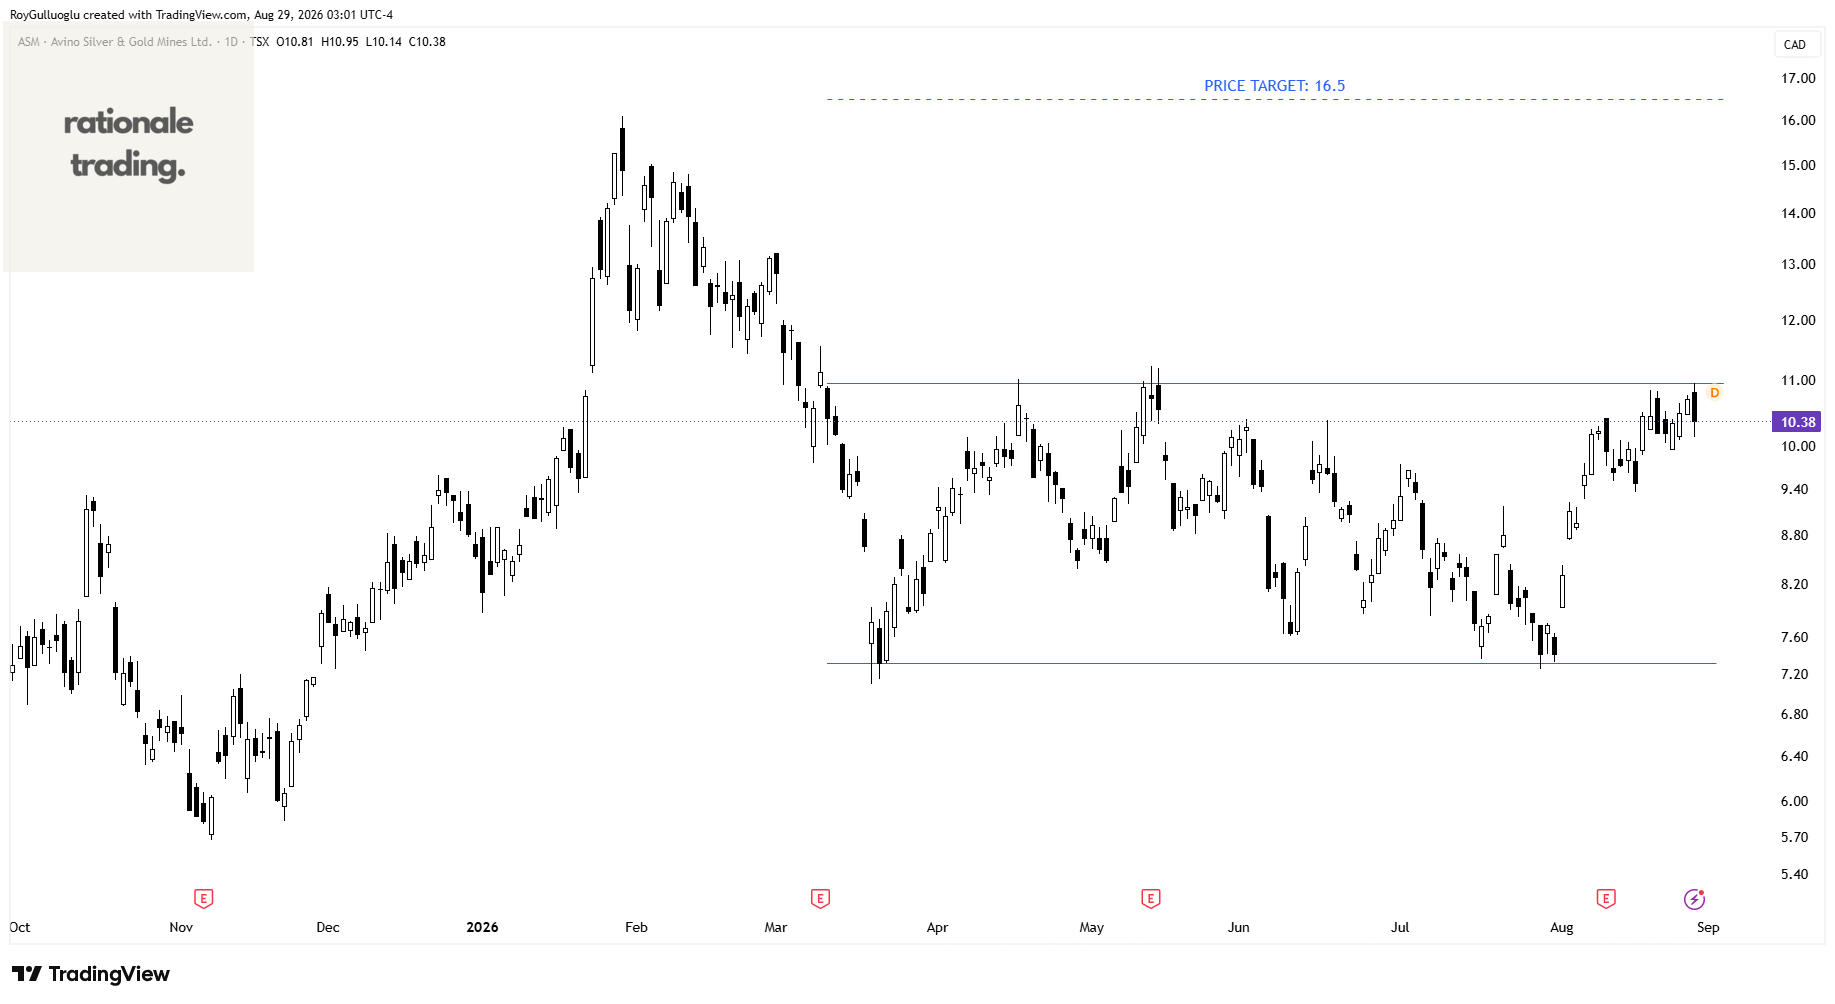
The above daily chart formed an approximately 4-month-long rectangle chart pattern as a bullish reversal after a downtrend.
Within this pattern, the horizontal boundary at 10.95 levels acts as a resistance.
A daily close above 11.27 levels would validate the breakout from the 4-month-long rectangle chart pattern.
Based on this chart pattern, the potential price target is 16.5 levels.
ASELSAN Elektronik Sanayi ve Ticaret Anonim Sirketi -(ASELS/BIST)-Long Idea
ASELSAN Elektronik Sanayi ve Ticaret Anonim Sirketi engages in research, development, engineering, production, testing, assembly, integration, sale, support, consultancy, and trading of software, equipment, systems, tools, materials, and platforms in turkey.
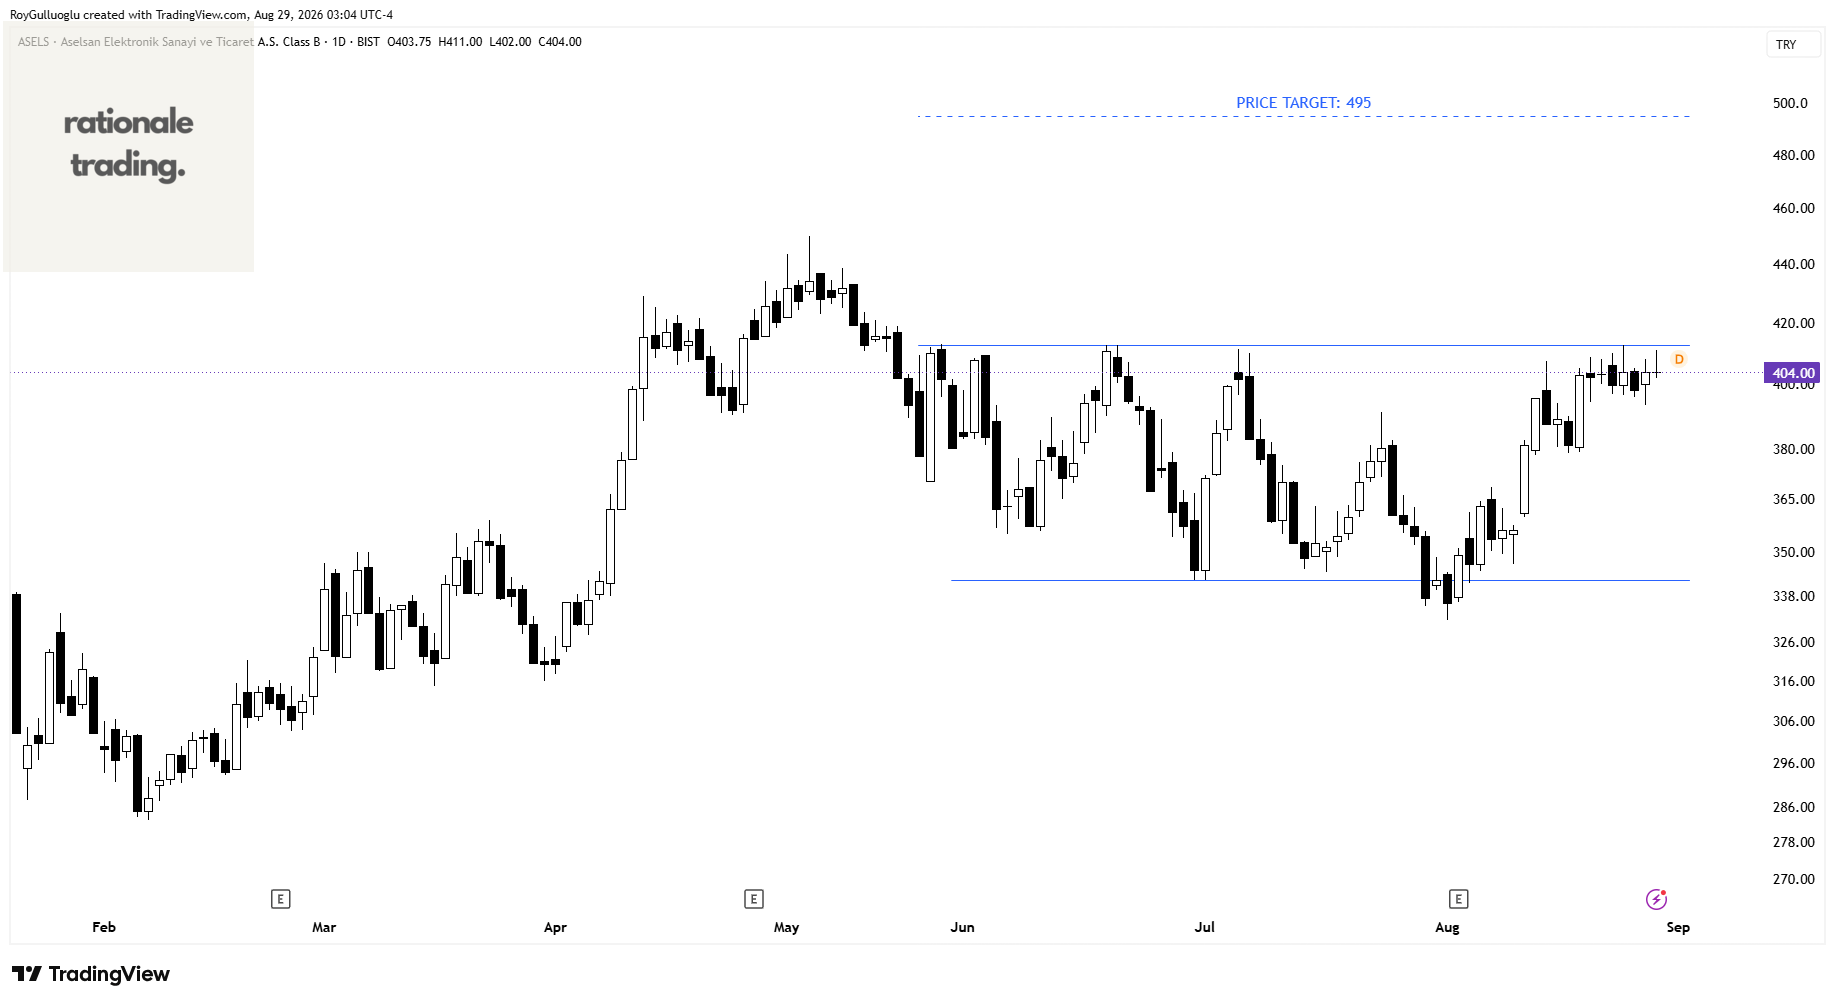
The above daily chart formed an approximately 2-month-long rectangle chart pattern as a bullish reversal after a downtrend.
Within this pattern, the horizontal boundary at 412.75 levels acts as a resistance.
A daily close above 425 levels would validate the breakout from the 2-month-long rectangle chart pattern.
Based on this chart pattern, the potential price target is 495 levels.